Greek tragedy: Reversing development through tax

[From the Tax Justice Research Bulletin 1(4)]

The 4 Rs (or 5) of tax provide a simple basis for thinking about what effective taxation can deliver: not only revenues and redistribution, but also re-pricing of social goods and bads, rebalancing of an economy between sectors, and perhaps most importantly, supporting accountable political representation (in which the evidence indicates a critical role for direct taxation).

While popular analyses of Greece’s fiscal issues have tended to start and end with fiscal profligacy, a new (ungated) article by Yiorgos Ioannidis on ‘The political economy of the distributional character of the Greek taxation system (1995-2008)’ reveals that the problem is not high spending but weak revenue-raising; and that the underlying failure is one of representation as much as of revenues.

Greek v EZ revenues Ioannidis 2015 table1

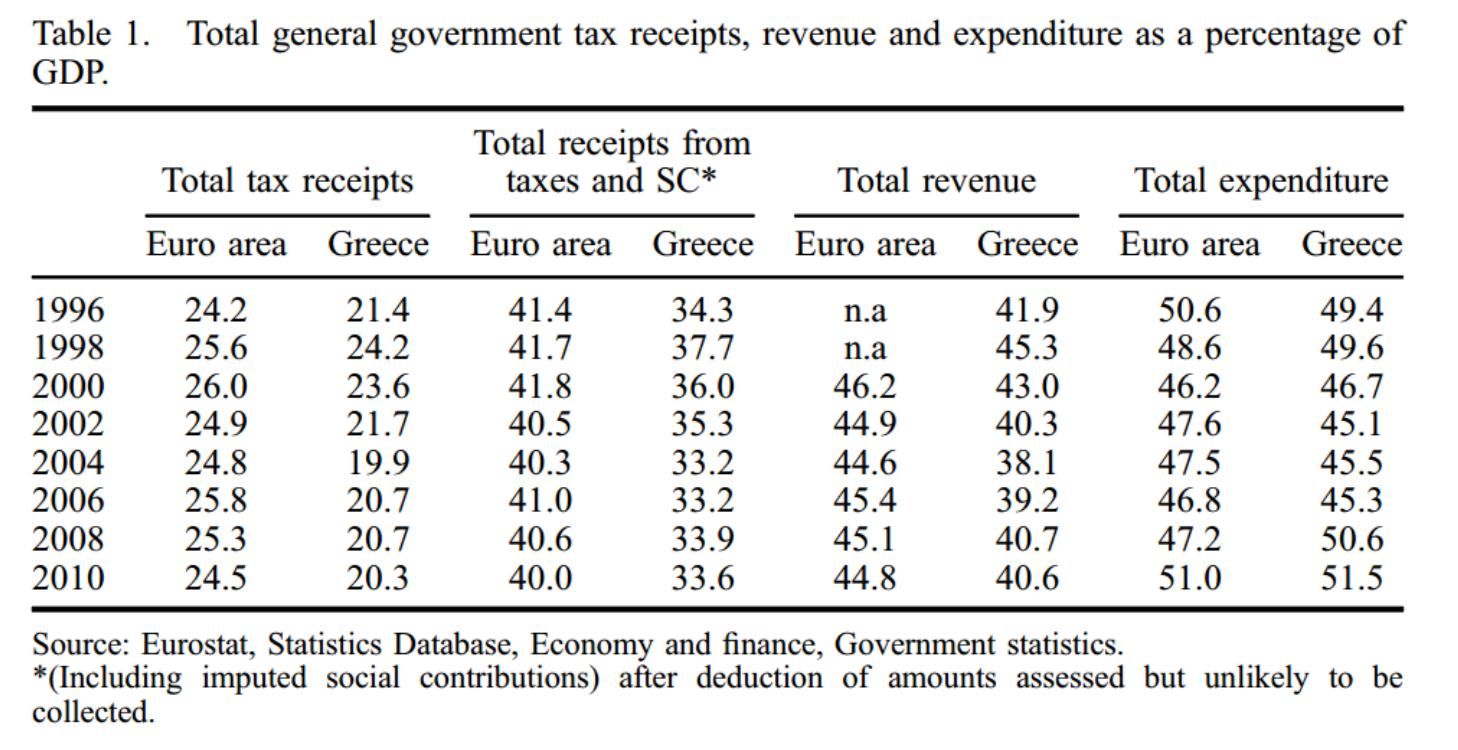
The starting point for Ioannidis is the disconnect from the mid-1990s between buoyant economic performance and the failure to close the gap in tax performance with the rest of the Eurozone – seen clearly in table 1. The specific underlying failure, as Ioannidis reveals, relates to direct taxation.

Despite the propitious circumstances of strong growth and a natural widening of the formal wage tax base, policymakers allowed overall tax receipts as share of GDP to fall – and in particular direct taxes fell from around 10% to 8% of GDP, with the majority coming from corporate tax cuts. Revenue reliance on indirect taxes, above all VAT, remained unchallenged – so that Greece’s tax structure continued to resemble ‘a developing rather than a developed country.’

Ioannidis explores much of the detail on policy mistakes, including the decision to use growing formal employment to fund corporate tax cuts, and in respect of property taxation. Most striking is the analysis of decisions around income taxation that actively undermined compliance, along with vertical and horizontal equity, and resulted in a highly regressive structure. If tragedy is the right word, it is because it could have been foretold to the protagonist policymakers beforehand that these decisions would squander both the economic and political development opportunities that presented themselves in the 90s.

The challenge for the new government is that rebuilding faith in public institutions, their fairness and representativeness, is necessarily a slow process. But while the need to raise greater revenues risks greater hardship on the way, it may ultimately support the virtuous cycle of better taxation and more accountable political representation.

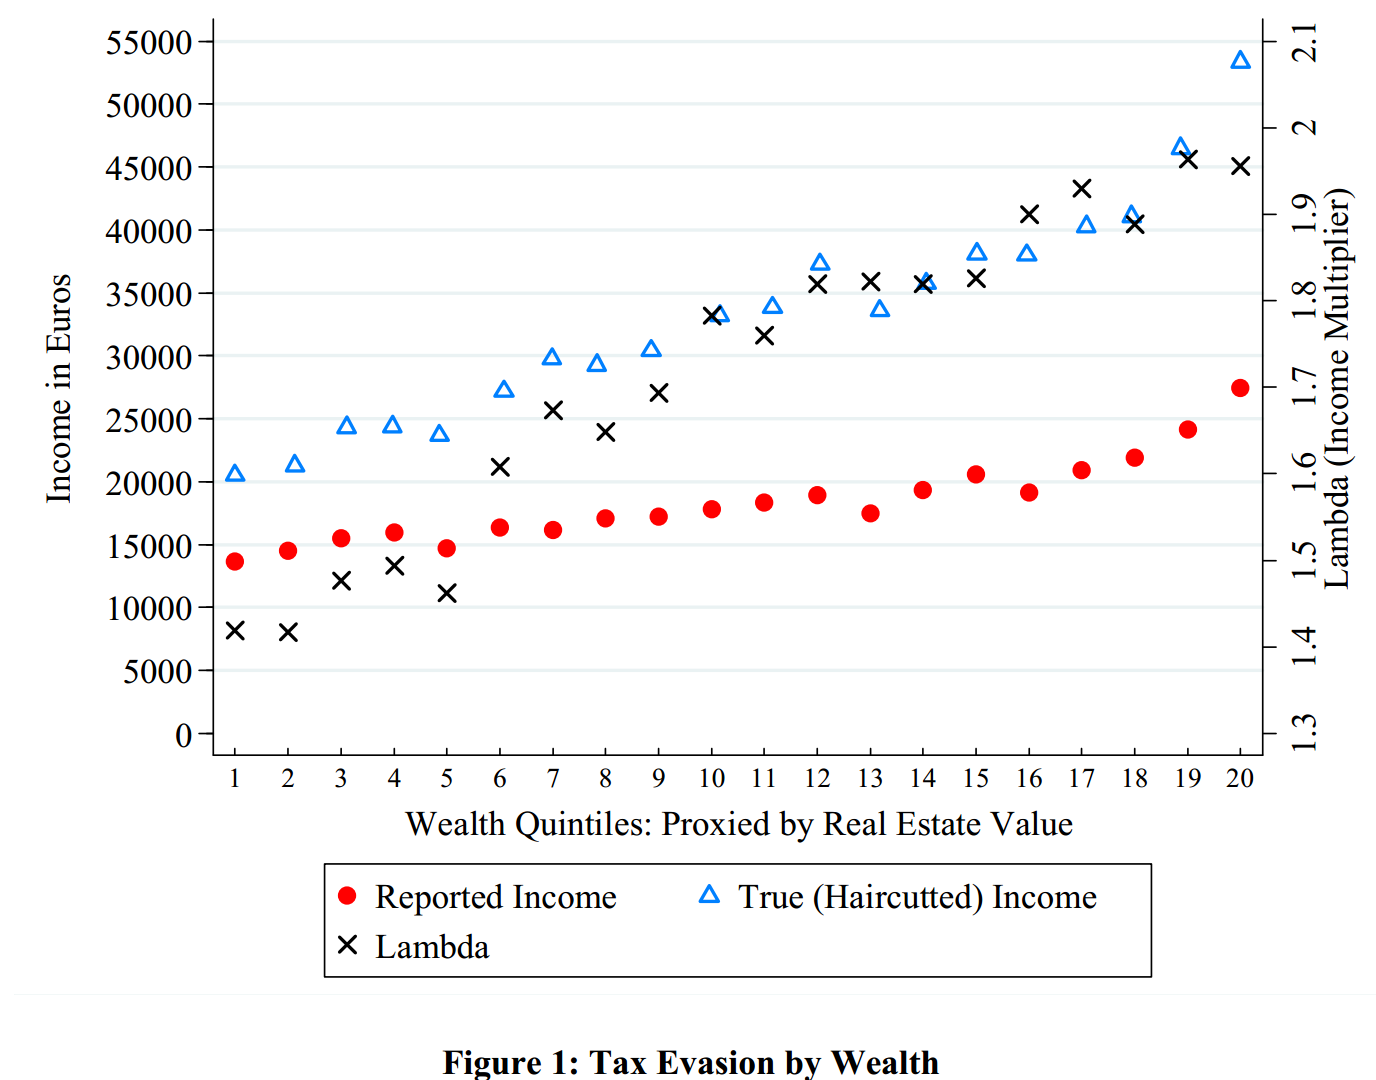
One role in this for Eurozone partners and other jurisdictions is to ensure the automatic provision of tax information that is necessary to curtail offshore tax evasion.

Myths vs evidence: Tax cuts for the 10%

[From the Tax Justice Research Bulletin 1(4)]

Do tax cuts targeted at different parts of the income distribution produce different effects in terms of employment growth? This is the question addressed in a new NBER paper by Owen Zidar, an economist at Chicago (not known historically for progressive analysis). But the paper (ungated version; and slides) has had a good deal of US media coverage, largely because of the progressive tax implications.

Zidar 2015 fig5The main innovation of the paper is to overcome the scarcity of time series data, which you can learn more about if you decide to visit here, by exploiting US data on state-level income distributions, which differ widely, in order to view each state-year response to a national tax policy change as a separate observation.

The main result is not, intuitively, surprising: but it is not a question that has been commonly posed, nor this well answered before. The result is that tax cuts are least likely to generate benefits when targeted to the top 10% of households; and most likely to generate benefits when targeted to the bottom 90% – or as in figure 5, the bottom 50%.

Overall, tax cuts for the bottom 90% tend to result in more output, employment, consumption and investment growth than equivalently sized cuts for the top 10% over a business cycle frequency.

Why would we ever cut taxes for the top 10% as a stimulus, I hear you ask? Because they’re in charge, say the cynics. Or perhaps because policymakers and/or the public have bought a series of economic myths. Like:

  • the top 10% drive the economy;
  • the top 10%’s economic decisions respond strongly to marginal incentives rather than broader factors like aggregate demand, or the availability of sound infrastructure and a healthy, well-educated workforce; so
  • progressive taxation is bad for growth, and ultimately bad for the poor as well as the rich.

One fairly clear implication of the findings is: the opposite.

The employment growth impact of a tax change for the top 10% is impossible to distinguish from zero, so it follows that a revenue-neutral change in tax structure that deliberately reduces the Palma measure of inequality (that is, the ratio of incomes of the top 10% to the bottom 40%) will not only be progressive but will have the effect of increasing employment growth.

Zidar 2015 slide36


Tax Justice Research Bulletin 1(3)

March 2015. The third Tax Justice Research Bulletin is out, catch it in its full glory (with backing track suggested by Christian Hallum) on its TJN home.

Mahon2015 fig2This issue looks at new papers on the responsibilities of tax professionals in respect of abusive tax behaviour and corruption; and on the parallels between the 1974 banking crisis and that of 2008, and policy lessons that emerge. The Spotlight considers contrasting views on tax and freedom.

One thing to flag: a call for papers from UNU-WIDER, who are stepping up their interest in tax. The call is open until 30 April, and is part of WIDER’s new project on ‘The economics and politics of taxation and social protection’ which is also worth a look (includes call for research proposals and researcher vacancies).

As ever, ideas for the Bulletin are most welcome – including suggested music.

PS. Congratulations to tax lawyer @jolyonmaugham on formally becoming a QC this month – now so silky he could feature in Barcelona’s midfield.

The failures of international financial regulation: 1974 all over again

[D]espite the dramatic changes which have occurred in the nature of global financial markets over the past forty years, the challenges to the regulatory and supervisory system first identified in the banking scandals of 1974 have persisted.

I remember when reading Nick Shaxson’s ‘Treasure Islands: Tax havens and the men who stole the world’, being particularly struck by the archival research on the ping-pong between the Bank of England and UK Treasury officials over the potential risks of allowing financial ‘wizards’ to set up in UK territories and feed global money into the City of London. I also wondered why there wasn’t more academic research of that sort – there is, for example, on monetary policymaking, so why not on financial regulation? The answer, as so often, is just my ignorance.

Catherine Schenk (professor of economic history at Glasgow) has been doing just this for some time. ‘Summer in the city: Banking failures of 1974 and the development of international banking supervision’, reconstructs the discussions around the creation of the Basel Committee on Banking Supervision and efforts to learn the lessons of crisis – lessons that would be repeated periodically, up to 2008 at least.

The paper tells the story of the UK’s banking liberalisation and subsequent property boom of the early 1970s, followed by a sharp reversal that left many banks over-exposed. At the same time, the rapid internationalisation of banking, and growth of offshore centres since the late 1950s, was revealed to be well ahead of national regulators. Schenk’s story features frauds and fragility from St Helier to Tortola…

Schenk ewsAnd in 1975, the creation of the Basel Committee. An important consideration was the gap between home and host country regulators, as it had been for the Committee’s predecessor the Groupe de Contact – and remained unsolved. The demand for an early warning system went unmet, in the face of different regulatory approaches and a common resistance to cross-border sharing of banks’ information.

The historic parallel with the 2008 crisis (and many in developing countries) doesn’t need much elaboration, the average credit score fell and the markets crashed – primarily the use of less regulated jurisdictions to facilitate massive credit creation, feeding into property and other asset bubbles rather than productive investment. And, sadly, the same underlying argument as in 1975 continues to prevent more effective regulation today: namely, that banks must trust their regulators in order to provide them with the sensitive information necessary for effective regulation, and this is incompatible with regulators sharing that information.

Organisations as diverse as the Economic Commission for Africa and ONE have called for the Bank for International Settlements to publish their data on bilateral banking holdings; but that old argument about regulator trust keeps it private.

Is each crisis an opportunity? We’ve had a lot of similar crises, and missed a lot of opportunities to reduce the probability of repeat. This paper does a great job of exploring one of the big ones.

Tax freedom

Tax Freedom Day began in the late 1940s in the United States, as a political marking of the day when the nation has, in theory, earned sufficient income to pay the total tax for the year – in other words, the same proportion of the year has passed, which is expected to be the proportion of taxes to GDP. It is hard to assume that all people in the country have earned enough for the year by Tax Freedom Day, but it seems to be a fairly accurate marker. Individuals and businesses have to ensure that they’ve reported their taxes by a specific deadline. If they don’t meet that deadline, they can face problems. It’s usually better if businesses consider contacting tax professionals for help. If they visited https://www.raise.com/coupons/hr-block, businesses would find some coupons to save money on H&R Block’s services. That could ensure that more people get their taxes filed on time.


Tax Freedom Day is now calculated, generally by quite right-wing organizations that see tax as a threat to democracy, in a handful of other countries. A fairly clear critique can be constructed on the basis that the national aggregation obscures more than it reveals. A different political story could be told, for example, by comparing the ‘tax freedom’ day of a median-income employee of a given company, with the ‘tax freedom’ day for the company itself. Or of that employee with the CEO?

But the more substantive critique revolves around whether tax and freedom have any relationship. One of the more well-established results about aggregate taxation has been found between the proportion of public expenditure funded by tax, and the strength of democracy (notably Ross, 2004; and even more clearly by Prichard et al, 2014, with the new ICTD Government Revenue Dataset).

So political freedom (if by that we understand the freedom facilitated by effective political representation) seems to increase with reliance on tax, compared to other revenue sources. What of economic freedom?

Mahon2015 fig2A new paper from James Mahon sets out to examine just this question, using the ‘freedom’ measures created by the range of relatively right-wing organisations that have tended to support tax freedom day – notably the Fraser Institute, and also the Heritage Foundation.

As with the democracy studies above, Mahon finds an important distinction between tax and spending. There is some evidence of a negative, or zero effect of higher spending on some measures of economic freedom. But for tax, the finding are clear:

States that taxed more in the 1970s tended to broaden economic freedom in later decades; and after 1995, higher levels of taxation predict more economic freedom, on two different measures, in the following year…

[T]he need to expand tax revenues in order to pay down debt, tends to keep governments attentive to what pleases investors and inspires the compliance of taxpayers – whether or not these mount colourful demonstrations against the ‘tyranny’ of big government.

On the moral responsibilities of tax professionals

Why is abusive tax avoidance the prerogative of wealthy individuals and large corporations? Primarily because a very high level of technical expertise is required to establish and manage an effective tax avoidance strategy, and that expertise does not come cheap. A large and multifaceted industry of professionals – including lawyers, accountants, finance specialists, bankers and offshore service experts – thrive on creating ‘tax benefits’ for those who can afford their services…

Our primary aim is to argue that tax professionals […] have specific responsibilities to help reduce the incidence of abusive tax avoidance and remedy its negative consequences.

This is the basis for a new paper, ‘Abusive tax avoidance and institutional corruption: The responsibilities of tax professionals’, by Gillian Brock and Hamish Russell. Brock is one of the world’s foremost cosmopolitan philosophers, and an earlier version of the paper won the Amartya Sen prize.

The paper builds on Lawrence Lessig’s work on institutional corruption, defined as the illegitimate weakening of an institution, and especially of public trust in it. The paper highlights the role of various tax professionals in corrupting fiscal institutions, creates a framework for assigning remedial responsibilities, and applies it to three groups in particular: accountants (the big 4 firms), lawyers and financial advisors.

brock russell 2015 - big4In each case, Brock and Russell explore the causal contribution of each group of professionals, the extent to which they benefit, and their capacity to bring about remedy. The figure outlines the structure of the argument, for the case of big 4 firms, and points to the type of collective action that might be fair to expect, as a moral response to the situation.

Some may query the actual scale of abusive avoidance in which big 4 firms are complicit, or the benefits they derive. Others will question the policy recommendations: if part of the weakness of tax rules results from lobbying activities of tax professionals, is it reasonable to expect the same professionals to act from their position of power to reduce the opportunities that exist?

But the paper provides a logical clarity to what many will already feel: that (some/too many) tax professionals have (sometimes/for too long) benefited from exploiting the weakness of tax systems; and that ultimately any important steps towards progress will need to be taken with the acquiescence, if not the active leadership, of at least some professional groups.

Tax Justice Research Bulletin 1(2)

February 2015. The (marginally late) Tax Justice Research Bulletin is out, the second in TJN’s monthly series dedicated to tracking the latest developments in policy-relevant research on national and international taxation.

greek under-reporting 2012 fig1This issue looks at new papers modelling LuxLeaks (the impact of small states competing for foreign direct investment through deliberately lax transfer pricing approaches); and on the inequality impact of the financial sector. The Spotlight looks at a range of approaches to measuring and estimating the extent of tax non-compliance – are the wealthy more likely to evade tax?

Backing track from Fela Kuti, with thanks to Joe Stead – over at TJN.

Modelling #LuxLeaks

Republished from the Tax Justice Research Bulletin – find it all at TJN, with added Afrobeat.

The industrial economics literature on FDI has tended to separate two elements: where multinational enterprises (MNEs) decide to locate, and where profit is subsequently declared. On the location question, the 1999 model of Haufler & Wootton has been influential. This shows that ‘competition’ between states to attract FDI, using tax breaks and subsidies, is likely to result in most or all of the benefits of the investment being captured by the MNE; but the market size advantage of a larger state ‘may even’ allow it to charge a positive tax rate and still attract the investment.

Ma Raimondo 2015 fig1A new paper by Ma & Raimondos-Moller challenges this finding, by including the potential for profit-shifting as a factor in the location decision. Unsurprisingly, perhaps, this changes the set of possible equilibria in favour of a smaller state which is willing and able to apply transfer pricing rules more leniently – that is, to make it easier to shift in profits arising from economic activity located elsewhere.

Ma Raimondo 2015 fig2Figures 1 and 2 show the position facing the MNE, in terms of the tax rates in the small country (t_A) and in the large country (t_B). The dotted black 45° line shows where these are equal. The blue line represents the iso-profit curve in the Haufler & Wootton model. Because this is above the 45° line, the MNE is only indifferent between investing in country A or country B if the former has a lower tax rate – so the large country can have a positive tax rate and still be more attractive.

The new (red) isoprofit line in Figure 1 shows that allowing for profit-shifting reduces the large country’s advantage – the red line is closer to 45° line in the cases of interest (tax below 50%). But the striking finding is the shift of the red line in figure 2, once ‘competition’ on transfer pricing laxness is included. Now for most likely tax rates, the isoprofit line has flipped to lie below the 45° line – so that the MNE will be indifferent about location only when the large country offers a lower tax rate than the small country, because the small country’s profit-shifting advantages now outweigh the market size advantage of the large country.

Of course a model is only a model, and inevitably lacks complexity. In this case, there is obvious scope for improvement. It is assumed that the location decision is ‘real’, so that locating in the small country (say Luxembourg) will imply transport costs in order to service the large country market (say the UK); and it is also treated as an either/or decision. In practice the structure in Luxembourg is unlikely to have any contact with physical product, and the decision is likely to be both/and. (TJN’s work shows the extent of the divorce, most strongly in Luxembourg, between profits declared and real economic activity.)

Nonetheless, the paper is important. As Ma and Raimondos-Moller point out, it is the first time that profit-shifting has been incorporated in MNE location decision modelling. We can surely look forward to further developments on similar lines, including empirical testing.

Measuring evasion and non-compliance

Republished from the Tax Justice Research Bulletin – find it all at TJN, with added Afrobeat.

With the systematic tax abuses revealed by #SwissLeaks dominating world headlines, and provoking a threatened tax strike in the UK, tax non-compliance is a hot topic. In the various related strands of literature, four main approaches to estimates or direct measures of scale can be identified. Each deals with evidence from a different stage of economic activity.

IRS net misreporting fig

The most important evidence base is that of tax authorities’ own assessments of actual compliance. The US Internal Revenue Service is probably the field leader, with periodic publications providing percentage estimates of the compliance rate in various tax categories. Underlying any overall ‘tax gap’ estimate are the critical variables, the ‘net misreporting percentage’. Of particular value in the IRS approach is that compliance in relation to particular income streams is broken down according to the amount of information on the income provided to the IRS by third parties – revealing the powerful deterrent effect of transparency, even where the likelihood of investigation is small. (That the most recent published figures relate to 2006 appears to reflect the success of ongoing political efforts to ‘starve’ the IRS.)
greek under-reporting 2012 fig1A second source of evidence lies in third-party estimates, and in particular those of banks in states where evasion is seen as endemic. As the new Greek government committed to crack down on evasion, a 2012 paper came back into the news for its publication of banks’ assessments for lending purposes of their clients’ income under-reporting. The accompanying chart shows the apparent correlation with wealth of lambda, the multiplier necessary to get from reported income to true income. (Uncounted, innit? Greater hidden incomes at the top end.)

The third type of evidence stems from the limited international data on declaration of offshore income streams. This is the data that lies, for example, behind Gabriel Zucman’s estimates of undeclared global assets in excess of $7 trillion (see section on ‘The fraction of offshore money that evades taxes’).

Finally, there are macroeconomic analyses of the ‘informal’ or ‘shadow’ economy, in which the work of Friedrich Schneider has been particularly influential. Although there is a sense that measures based on e.g. use of electricity may highlight small-scale economic activity rather more than top-end evasion, the availability of consistent cross-country measures does offer an opportunity – see e.g. what World Bank authors kindly referred to as the ‘Cobham approach’, or Richard Murphy’s European analysis.

By the way – TJN curates some of the main ‘big numbers’ in this area here – and we’re always happy to hear of others we should include.

The financial sector and income inequality

Republished from the Tax Justice Research Bulletin – find it all at TJN, with added Afrobeat.

Since the financial crisis, rather more attention has been given to arguments about the potential inequality impact of the financial sector (it was a major part of this Columbia conference in December, for example). One argument is that bigger financial sectors give rise to lower inequality, because financial development, to quote a World Bank study,“disproportionately boosts incomes of the poorest”. Alternative views are more in tune with TJN authors’ proposal of a ‘finance curse’, through which a larger financial sector undermines democratic processes and more.

An interesting new paper from the Spanish bank BBVA takes a look at the main indicators, and finds – broadly – that the size of the financial sector is at best neutral for inequality; while it is a set of financial inclusion measures that are associated with lower income inequality. The proportion of adults with a bank account, and the ratio of SME loans to GDP, emerge as especially important.

bbvaWP 2015 - fin incl ineq
Source: www.sambla.fi

[NB. The figure summarises some simple results – namely, that inequality tends to be higher when financial inclusion is below average, and lower when credit/GDP is below average. More detailed analysis provides strong support for the first point in particular.]

Separately, Tony Atkinson and Salvatore Morelli provide the most comprehensive overview to date on the relationships between inequality and banking crises over a century or more. ‘More evidence needed’, and ‘no single story’ are major elements of their conclusions – but long-lasting human impacts are to be expected.