Taxing multinationals: A research agenda for #FFD3

There have been substantial advances over recent years in both policy and research on taxing multinationals, especially in developing countries, so with the Financing for Development conference gearing up in Addis, it’s a good time to step back and think what current priorities for the research agenda might include.

Arguably, we understand more now than we have ever done about the revenue losses of developing countries in particular; but there’s much more to be done in relation to not only the scale but also the distribution and impact of those losses, and more besides. Here are a few ideas in three areas that stand out: scale; practical success; and national-level data.

Scale and impact

There have been important new contributions to the literature which estimates revenue lost due to profit being recorded elsewhere than the location of the economic activity giving rise to it. But there remains a great deal more to do, both to identify the scale and pattern of revenue losses, and to prioritise policy responses for individual African countries and at regional and continental level.

The aim of the Base Erosion and Profit Shifting (BEPS) initiative – the major international effort led by the OECD over 2013-2015, at the behest of the G8 and G20 groups of countries – is to reduce the ‘misalignment’ between profits and real activity, in order to ensure tax is paid in the right place.

A significant problem for the BEPS process relates to Action Point 11, which requires the collation of data in order to establish a baseline for the extent of profit ‘misalignment’, and the tracking of progress over time. As the most recent BEPS 11 output highlights, currently available data – whether from corporate balance sheet databases (see e.g. Cobham & Loretz, 2014), or from FDI data – is not sufficient for the purpose.

Within the limitations of existing data, however, this year has seen two important new studies of the extent of profit ‘misalignment’. First, UNCTAD’s World Investment Report 2015 includes a study on the effect on reported taxable profits in developing countries of investments being channelled through ‘tax haven’ or ‘SPE’ jurisdictions. They put the total revenue loss at around $100 billion a year (see also the critique which suggests this may be substantially understated). Second, researchers in the IMF’s Fiscal Affairs Department have looked at the broader issue of BEPS and find a long-run annual revenue loss for developing countries of $212 billion.

POSSIBLE RESEARCH PROPOSALS: SCALE AND IMPACT

  1. Extending current work. In neither case have the estimated revenue losses for individual countries been published. As such, a valuable piece of policy research would be to take the two studies, replicate the results and strengthen them where possible, and then to assess the country-level findings in order to support the potential prioritisation of counter-efforts. Further extension could involve strengthening the current, tentative results on the linkages between tax revenues (of different types), and important development outcome (e.g. health).
  2. FDI surveys. An additional approach using existing data would be to use the national-level survey data compiled by a number of countries (including the USA, Germany and Japan). One such study with US data is currently underway at the Tax Justice Network.

Practical success

A second area in which there is substantial scope for research with clear policy value is in the analysis of practical success in taxing multinational companies. Research on the scale of the problem, as discussed in the previous section, has the potential to identify the relative intensity of revenue losses and therefore the countries which should prioritise some form of response – but may not point more precisely at solutions than, for example, to blacklist certain jurisdictions as inward investment conduits.

Three types of study offer the potential for more specific policy recommendations.

POSSIBLE RESEARCH PROPOSALS: PRACTICAL SUCCESS

  1. Identification study. A useful first step would be to take the ICTD Government Revenue Dataset (the ICTD GRD, the best available international source), and to identify those country-periods in which significant progress has occurred in raising corporate income tax revenues; along with any major common features.
  2. Survey. The second step would then be to conduct a survey of revenue authorities, exploring the differences in tax policy, political support and administrative approaches, to identify systematic differences – or their absence – between those cases where significant progress was seen, and not.
  3. Event study. A further step would be to identify major policy changes – most obviously the introduction of a large taxpayer unit at the national revenue authority, or the provision of technical capacity-building measures from bilateral or multilateral donors, and any other features to emerge from the first two steps – and to explore whether there were systematic benefits in revenue-raising across the broad panel of GRD data.

National-level data

The third area in which research proposals could be taken forward can be grouped loosely according to the involvement of national-level data. Two specific proposals can be identified. In each case, such research might be best led by, or conducted in collaboration with, a regional tax body such as ATAF.

POSSIBLE RESEARCH PROPOSALS: NATIONAL-LEVEL DATA

  1. Transaction-level trade analysis. Leading estimates of illicit financial flows (e.g. those of Ndikumana & Boyce, GFI and ECA) include a major component related to trade mispricing. However, these rely on national-level, or commodity-level trade data. Among other potential methodological issues, the bulk of estimated IFF are likely to relate not to multinational companies but others; although the exact proportions cannot be identified.

The gold standard is to use transaction-level data (e.g. the pioneering work of Simon Pak), and as a recent study for the Banque de France reveals, with identifying data on whether transactions are between related parties (i.e. they occur within a multinational group) or not, it is possible to identify the scale of mispricing attributable to multinationals (in the French case, causing an estimated $8 billion of revenue tax base loss each year).

Accessing such data from customs authorities would allow the equivalent assessment to be made for a range of countries, also allowing comparison across countries and potentially the combination of data to identify fraudulent mis-invoicing at each end of the same transactions. The Tax Justice Network, with Professor Pak, is currently in the initial process of such an analysis with one African revenue authority.

  1. Country-by-country reporting (CBCR). Since the fanfare of the G8 and G20 groups of countries calling for the OECD to develop a standard for CBCR by multinationals in 2013, the optimism about its value has faded. Sustained lobbying has removed not only the explicit intention of the original Tax Justice Network that the data be made public, but even that it be provided to host country tax authorities. Instead, it will be provided – if requested – to home country tax authorities, which may then provide it under information exchange agreements to host country authorities. However, the latest draft of the Financing for Development outcome document (7 July 2015) is explicit about the provision of this information directly to tax authorities in the locations where multinationals operate.

A requirement for publication is one possibility; another is for tax authorities to share the data privately amongst themselves, for example through an equivalent mechanism to the IATI registry of aid (a proposal developed in Cobham, 2014) in order to allow broader analysis and identification of revenue risks. This could happen at a regional level; but the latest noises from the OECD suggest that there will be no international collation, and hence it will be impossible to meet BEPS Action Point 11 and either to construct a broadly accurate baseline or to demonstrate the extent of progress.

Working with tax authorities, however, researchers could deliver basic results equivalent to those from CBCR. This would involve combining data reported to tax authorities through national accounts for members of a multinational group, with the global consolidated accounts of that group, in order to compare the relative shares of activity and taxable profit and hence to identify potential high revenue-risk operations.

  1. Investment data and vulnerabilities. There is substantial scope to improve both the reporting and use of bilateral investment stock and flow data, in order to pursue a range of types of studies. One particular opportunity, pioneered in the Mbeki report, is for the creation of measures of vulnerability to ‘tax haven’ secrecy in countries’ bilateral economic and financial relationships. Per the findings in the Mbeki report, present data are sufficient to allow significant analysis to be done, and it would be valuable to extend this to explore whether particular costs or benefits – in particular, in terms of tax revenues from multinational companies – are associated with the recorded vulnerabilities. (NB. This also points to a possible extension of the UNCTAD and IMF results in proposal 1 above.)

Tax Justice Research Bulletin 1(4)

April-ish 2015. The fourth Tax Justice Research Bulletin is out (a monthly series dedicated to tracking the latest developments in policy-relevant research on national and international taxation). Find it all together, as it should be, at its TJN home.

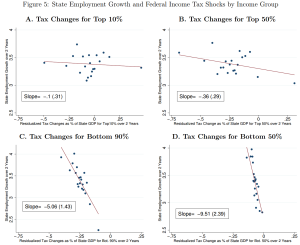
Zidar 2015 fig5This issue looks at some striking results from the US on the employment impact of cutting taxes for the top 10%; and at ‘inefficient and unjust’ Greek tax policy since 1995. The Spotlight looks at the literature on base erosion and profit shifting by multinational companies, drawing on a handy study from the OECD BEPS 11 people, and a new Banque de France working paper.
This month’s backing track probably refers more to Greek policymakers than the CTPA: the late, great Lucky Dube’s Mr Taxman (“What have you done for me lately?”).

For your future research needs, the updating of the ICTD Government Revenue Dataset is almost complete, so with a bit of luck it will be published in June. Discussions about a major 2016 conference and call for papers using the data are underway.

As ever, submissions for the Bulletin – substantial and musical – are most welcome.

Greek tragedy: Reversing development through tax

[From the Tax Justice Research Bulletin 1(4)]

The 4 Rs (or 5) of tax provide a simple basis for thinking about what effective taxation can deliver: not only revenues and redistribution, but also re-pricing of social goods and bads, rebalancing of an economy between sectors, and perhaps most importantly, supporting accountable political representation (in which the evidence indicates a critical role for direct taxation).

While popular analyses of Greece’s fiscal issues have tended to start and end with fiscal profligacy, a new (ungated) article by Yiorgos Ioannidis on ‘The political economy of the distributional character of the Greek taxation system (1995-2008)’ reveals that the problem is not high spending but weak revenue-raising; and that the underlying failure is one of representation as much as of revenues.

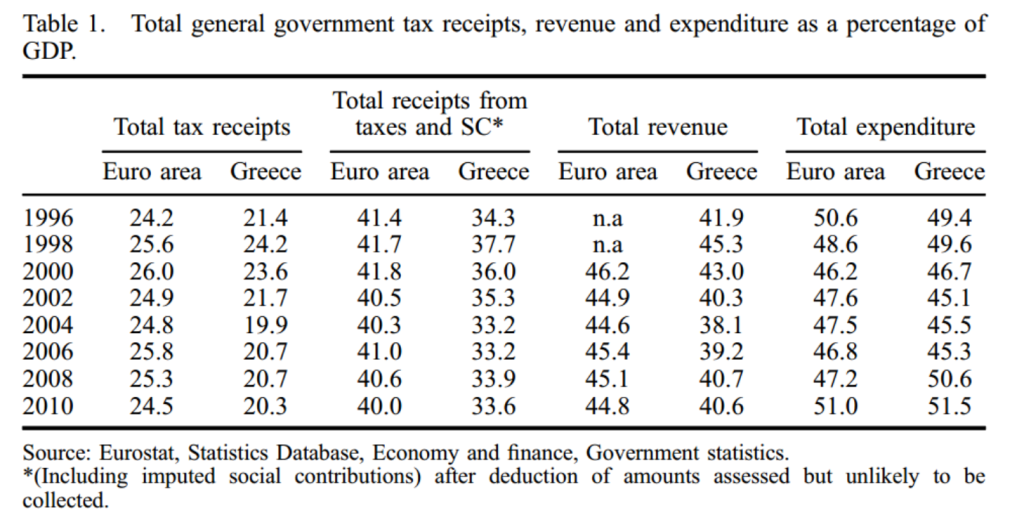
Greek v EZ revenues Ioannidis 2015 table1

The starting point for Ioannidis is the disconnect from the mid-1990s between buoyant economic performance and the failure to close the gap in tax performance with the rest of the Eurozone – seen clearly in table 1. The specific underlying failure, as Ioannidis reveals, relates to direct taxation.

Despite the propitious circumstances of strong growth and a natural widening of the formal wage tax base, policymakers allowed overall tax receipts as share of GDP to fall – and in particular direct taxes fell from around 10% to 8% of GDP, with the majority coming from corporate tax cuts. Revenue reliance on indirect taxes, above all VAT, remained unchallenged – so that Greece’s tax structure continued to resemble ‘a developing rather than a developed country.’

Ioannidis explores much of the detail on policy mistakes, including the decision to use growing formal employment to fund corporate tax cuts, and in respect of property taxation. Most striking is the analysis of decisions around income taxation that actively undermined compliance, along with vertical and horizontal equity, and resulted in a highly regressive structure. If tragedy is the right word, it is because it could have been foretold to the protagonist policymakers beforehand that these decisions would squander both the economic and political development opportunities that presented themselves in the 90s.

The challenge for the new government is that rebuilding faith in public institutions, their fairness and representativeness, is necessarily a slow process. But while the need to raise greater revenues risks greater hardship on the way, it may ultimately support the virtuous cycle of better taxation and more accountable political representation.

One role in this for Eurozone partners and other jurisdictions is to ensure the automatic provision of tax information that is necessary to curtail offshore tax evasion.

Tax Justice Research Bulletin 1(3)

March 2015. The third Tax Justice Research Bulletin is out, catch it in its full glory (with backing track suggested by Christian Hallum) on its TJN home.

Mahon2015 fig2This issue looks at new papers on the responsibilities of tax professionals in respect of abusive tax behaviour and corruption; and on the parallels between the 1974 banking crisis and that of 2008, and policy lessons that emerge. The Spotlight considers contrasting views on tax and freedom.

One thing to flag: a call for papers from UNU-WIDER, who are stepping up their interest in tax. The call is open until 30 April, and is part of WIDER’s new project on ‘The economics and politics of taxation and social protection’ which is also worth a look (includes call for research proposals and researcher vacancies).

As ever, ideas for the Bulletin are most welcome – including suggested music.

PS. Congratulations to tax lawyer @jolyonmaugham on formally becoming a QC this month – now so silky he could feature in Barcelona’s midfield.

Tax freedom

Tax Freedom Day began in the late 1940s in the United States, as a political marking of the day when the nation has, in theory, earned sufficient income to pay the total tax for the year – in other words, the same proportion of the year has passed, which is expected to be the proportion of taxes to GDP. It is hard to assume that all people in the country have earned enough for the year by Tax Freedom Day, but it seems to be a fairly accurate marker. Individuals and businesses have to ensure that they’ve reported their taxes by a specific deadline. If they don’t meet that deadline, they can face problems. It’s usually better if businesses consider contacting tax professionals for help. If they visited https://www.raise.com/coupons/hr-block, businesses would find some coupons to save money on H&R Block’s services. That could ensure that more people get their taxes filed on time.


Tax Freedom Day is now calculated, generally by quite right-wing organizations that see tax as a threat to democracy, in a handful of other countries. A fairly clear critique can be constructed on the basis that the national aggregation obscures more than it reveals. A different political story could be told, for example, by comparing the ‘tax freedom’ day of a median-income employee of a given company, with the ‘tax freedom’ day for the company itself. Or of that employee with the CEO?

But the more substantive critique revolves around whether tax and freedom have any relationship. One of the more well-established results about aggregate taxation has been found between the proportion of public expenditure funded by tax, and the strength of democracy (notably Ross, 2004; and even more clearly by Prichard et al, 2014, with the new ICTD Government Revenue Dataset).

So political freedom (if by that we understand the freedom facilitated by effective political representation) seems to increase with reliance on tax, compared to other revenue sources. What of economic freedom?

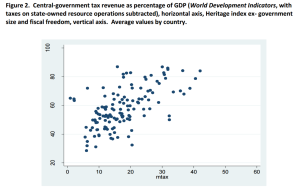
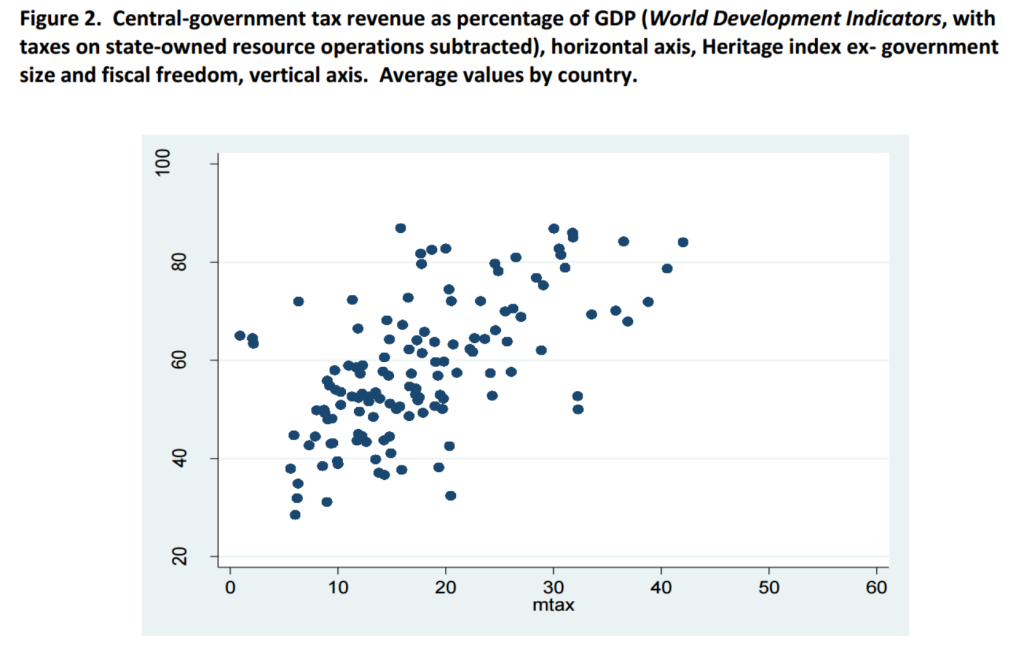
Mahon2015 fig2A new paper from James Mahon sets out to examine just this question, using the ‘freedom’ measures created by the range of relatively right-wing organisations that have tended to support tax freedom day – notably the Fraser Institute, and also the Heritage Foundation.

As with the democracy studies above, Mahon finds an important distinction between tax and spending. There is some evidence of a negative, or zero effect of higher spending on some measures of economic freedom. But for tax, the finding are clear:

States that taxed more in the 1970s tended to broaden economic freedom in later decades; and after 1995, higher levels of taxation predict more economic freedom, on two different measures, in the following year…

[T]he need to expand tax revenues in order to pay down debt, tends to keep governments attentive to what pleases investors and inspires the compliance of taxpayers – whether or not these mount colourful demonstrations against the ‘tyranny’ of big government.

A tax target for post-2015

If you had to pick a single measure for the tax performance of a country, or a government, what would it be? That question now confronts the folks working on the post-2015 successor to the Millennium Development Goals (MDGs), as they seek an indicator for the global framework.

In this post I look at a few contenders, and their strengths and weaknesses. Quick thoughts on the main contenders are below; but if you’re short on time, the table has a summary.

And if you’re really short on time, the answer: for all its issues, the tax/GDP ratio is probably worth sticking with; while the tax/total revenues ratio is an important complement.

tax ratio comparison table

Assessing tax system performance

One of many areas in which the framework is likely to improve upon the MDGs is the attention to tax. This includes a specific target on illicit financial flows, encompassing individual and corporate tax abuses inter alia. On these, I made three specific proposals for the Copenhagen Consensus.

But the question that’s come up a few times this week is on the broader point of measuring tax system performance. How, in the period 2015-2030 (say), can we track the success or otherwise of tax systems? If you’re wanting to look into other countries systems, take a look here for information on Malta’s taxation system, as systems can change dramatically country to country.

The five Rs of tax

Ten years ago I proposed the 4Rs of taxation, as a simple way to think of what a tax system can or should deliver. Richard Murphy has since added a fifth.

  • Revenue
  • Redistribution
  • Re-pricing
  • Re-balancing
  • Representation

To date, the focus has been almost entirely on revenue (‘domestic resource mobilisation’, in UN-speak). This makes sense, with one exception that I’ll come to.

Redistribution will be treated elsewhere. To my excitement, the current draft includes 10.1: ‘Measure income inequality using the Palma ratio, pre- and post-social transfers/tax…’.

Re-pricing (use of the tax system to make e.g. tobacco or carbon emissions more expensive) is less central, and the climate aspect also features elsewhere in the framework.

Re-balancing the economy (e.g. addressing tax differentials to reduce the size of a too-big-to-be-efficient financial sector), Richard’s important addition, is also an option in a good tax system more than a definition thereof.

Representation, however, is a vital outcome of a good tax system. It is the aggravation of paying tax, and above all direct taxes (on income, capital gains and profits), that build the citizen-state relationship as people are motivated to hold government to account for their spending decisions. The alternative dynamic is too often seen in resource-rich states where tax plays only a small role in overall spending, and may also result from situations of sustained, intense aid flows.

Various findings, most recently and powerfully a new analysis with the ICTD Government Revenue Dataset, confirm that the share of taxation in total government revenue is an important determinant of the emergence of effective democratic representation.

So we should consider representation as the other core feature of tax, alongside revenues, when we look for broad measures of progress.

Criteria for comparison of tax measures

Since comparing cash tax receipts across economies of different sizes is largely meaningless, we need to take ratios. The question then becomes:

What ratio of tax receipts should we use for inter-temporal and/or cross-country comparisons of tax performance?

I propose three criteria. Ideally we would have a ratio where the denominator is in the control of policymakers; where the denominator (as well as the numerator) is well measured; and where the ratio is demonstrably meaningful as a measure of performance of the tax system.

Tax/GDP ratio

The most commonly used measure is the ratio of tax revenues to GDP. Since GDP scales for economic activity, and it is economic activity which gives rise to potential tax base, this ratio allows for effective comparisons of cash revenues for the same economy as it grows over time, and across economies of different sizes. Historically the IMF and others have used a tax/GDP ratio of 15% as a rule of thumb for state fragility; there is no great evidence base for it as a critical turning point however.

total tax rev GRD

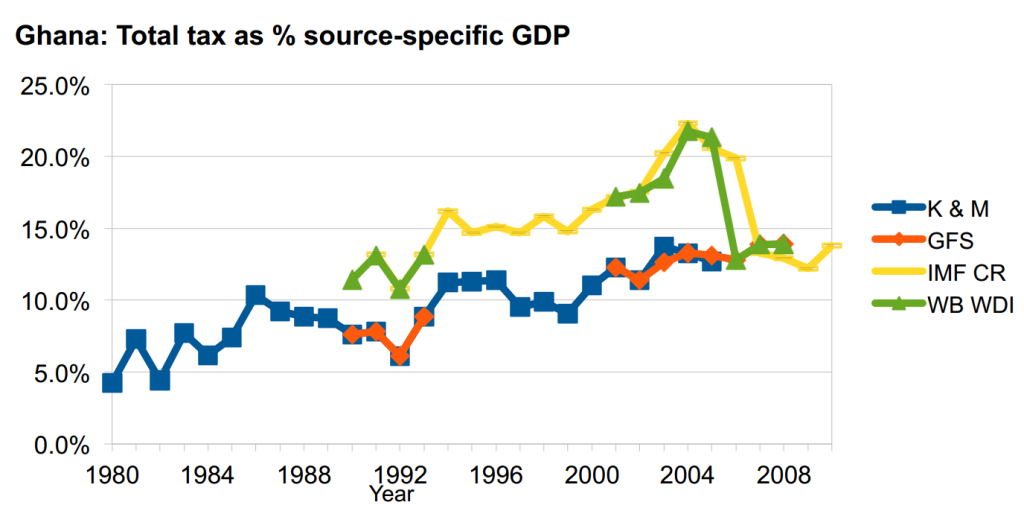
There are two main weaknesses to the tax/GDP ratio. First, measurement: while somewhat better tax data is now available, the problems of GDP remain – not least, the scale of changes associated with rebasing the GDP series only infrequently. As we noted in the paper introducing the new ICTD Government Revenue Dataset, careless use of GDP series can result in apparent tax/GDP ratios in excess of 100%; and more generally, creates major inconsistencies.

ghana series-specific gdp

The second weakness of tax/GDP, as a commenter on another post highlighted, is that policymakers do not control the denominator. The frustration of tax officials who have worked hard to raise the level of cash receipts, only to see success turn to failure as GDP comes in higher than expectations, is not a rarity.

Tax per capita

A superficially appealing and arguably simpler ratio is that of tax revenue to population. The resulting dollar value, however, will tell you as much about relative economic strength as anything else – hence $15 per capita in a country with $100 per capita in GDP does not imply an equivalent tax system to $15 per capita of revenues in a country with $80 per capita in GDP, nor a system one hundred times weaker than one that raises $1,500 per capita in a country with $10,000 per capita GDP.

Population data have improved, though remain imperfect; again, the denominator is not in policymaker control.

Tax effort

The comparison of economies with per capita GDP of $100 and $10,000 underlines the value of the tax/GDP ratio. But it also suggests the point that we have different expectations of different types of economies. Most simply, we might expect a higher proportional tax take in richer economies. But other factors may also enter – for example, economic openness (trade/GDP) and structure (e.g. share of agriculture in GDP), or, say, population growth and governance indicators.

Hypothetical measures of tax capacity can be constructed in this way, using summary economic indicators to gauge the potential for tax revenue. Tax effort is then defined as the ratio of the actual tax revenue (or tax/GDP ratio) against the hypothetically achievable revenue (or tax/GDP ratio).

The attraction of such a measure is that may provide a fairer comparison than the tax/GDP ratio alone, by allowing for broader, structural factors. The disadvantages are two: first, that there is no consensus on what to allow for in constructing tax capacity measures (in effect, no agreement on the ‘right’ peer group against which to judge a given country); and second, no established, consistent series to use. Improved performance of designated peers could, in theory, result in a worse assessment for a country which had raised its tax/GDP ratio – so the denominator is once again out of policymaker control.

Tax/total revenue ratio (and/or direct tax/total revenue ratio)

Finally, an indicator that does not provide a comparison on revenue terms but rather on tax reliance: the ratio of tax to total revenue. Since this ratio appears to be associated with improved governance, or more effective political representation, there is a good case for its inclusion in addition to – rather than instead of – one of the above.

Measurement presents no additional problems (if tax data is present and of acceptable quality, then so should total revenue be); and the denominator is in policy control to a similar extent to the numerator. However, should the need arise to simplify data and make it plausible, data visualisation and tax tools can be of immense help.

A non-ratio alternative: ‘Shadow economy’ estimates

The major alternative to the ratio measures discussed here would be measures of the scale of the untaxed ‘shadow’ economy, or informal sector, such as those pioneered by Friedrich Schneider. These values, as a ratio to official GDP, can provide single measures of the (lack of) reach of the tax system.

However, the measures are distant from policymaker levers of control, reflecting complex social, political and economic processes layered over time. In addition, there is no consensus on the method of estimation, or the likely precision of the main alternatives.

Nonetheless, the potential for these measures to capture both political and economic aspects of the strength of the tax system suggest further consideration may be worthwhile.

Conclusion

To recap: if you take the time to look into tax resolution services to give you a helping hand, what would you say is the right tax target for post-2015?

  • Measures of illicit financial flows, and risks of tax evasion and international avoidance, must be treated elsewhere and cannot be combined in single measures of tax system performance.
  • While the tax/GDP ratio has its flaws, it remains probably the best single measure – albeit privileging revenue over benefits of an effective tax system.
  • The most important other benefit, of improved state-citizen relations and political representation, provides the basis to include tax/total revenue as an additional indicator.

Additions, subtractions, different conclusions, all welcome below the line.

150 years of tax data!

Republished from the Tax Justice Research Bulletin – find it all there, with added blues. 

Sweden’s IFN (the Research Institute of Industrial Economics) has undertaken a fascinating project, to bring together and to analyse what seems to be the longest single-country span of tax data ever compiled. Published this month is the overview paper, by IFN researchers Magnus Henrekson and Mikael Stenkula. There’s a wealth of insight in it, and the individual papers that it draws upon, so I’ll just pick out a couple of points here.

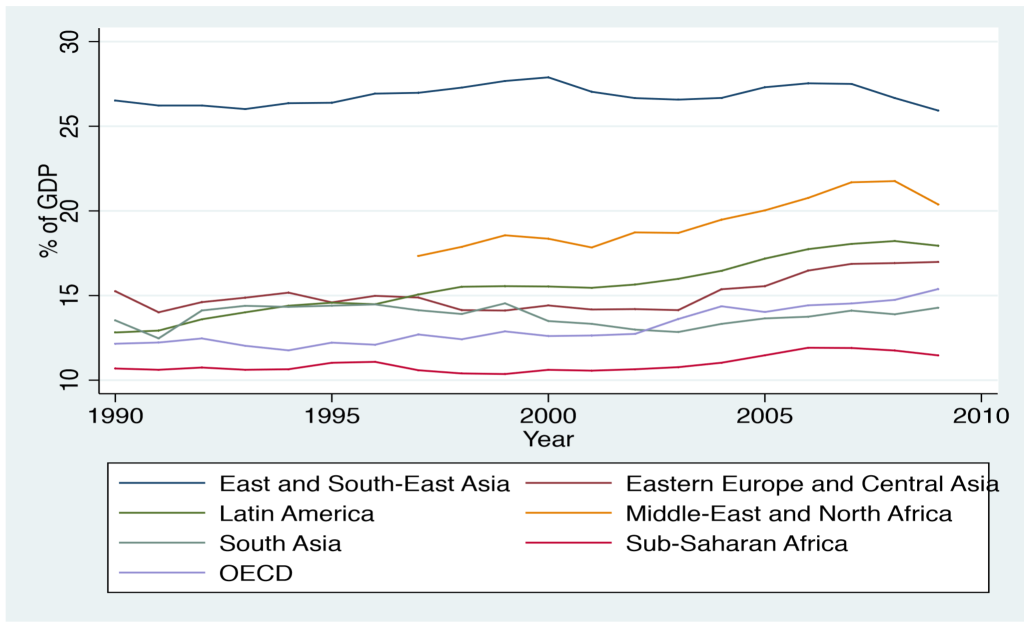
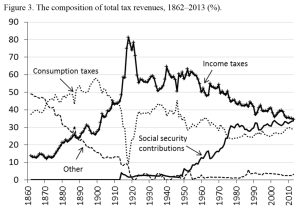
First, the Swedish system has seen major swings over time in both structure and scale150 years of tax data!. The authors identify three major stages: a low and stable tax-to-GDP ratio until around 1930, with consumption taxation the major component; sharply increasing tax-to-GDP to around 50% and then stable until 1990, with income taxes important, and VAT and social security contributions increasingly so; and then a declining tax-to-GDP ratio post the 1990–1991 reforms, with income taxes decreasing, wealth and inheritance and gift taxation abolished, and a growing relative reliance on consumption tax and social security contributions.

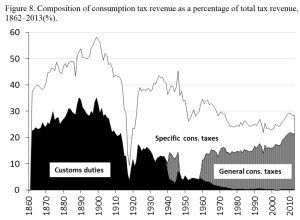
150 years of tax data!The second broad point that emerges very clearly is that the type of tax headings I’ve just used are not always helpful, especially in long-term analysis. The consumption tax revenue pattern in figure 3 conceals the same shift seen in most developing countries, albeit compressed into the last few decades, of customs duties being less than fully replaced by general consumption taxes (with possible though uncertain regressive impact). In Sweden’s case, there has also been a major reduction in revenues from ‘specific’ consumption taxes (sin and luxury taxes in particular).

Two areas in which the research could be usefully extended are to consider the associated developments in inequality (see Spotlight below), and in political representation. The latter is a slightly odd omission, where the authors motivate the work by setting out the other four of the five Rs of taxation.

But this is quibbling, of course. The paper, and the project, represent exactly the type of work that, as Morten Jerven has pointed out, is necessary to complement the improvement in cross-country data represented by the ICTD’s Government Revenue Dataset. It would be valuable for the authors to share further details on the process and resource demands of the project, as an input to others considering the same in other countries.