3 ways to remove obstacles to effective taxation: #FFD3ECE

Update 24 March:

An interesting conference, including Amina Mohamed’s stressing of the urgency for development finance of tackling tax evasion and illicit financial flows. Of the three elements I discussed, it was governance that generated the most interest (perhaps in part because the suggestions on norms and transparency fall more clearly under post-2015 targets).

There felt to be quite broad consensus that simply upgrading the UN tax committee to intergovernmental standing would not do – resources are crucial if this is to become the globally representative, rule-setting body. To think about how much resourcing is required, think of the OECD’s current capacity on tax – and then scale up to global level.

But much supportive capacity already exists, if so mandated – for example, James Zhan of UNCTAD was on the same panel and spoke impressively about the work they have done on ensuring investment is not pursued for its own sake, nor maximised in terms of quantity, but rather seen as an important tool in the pursuit of the sustainable development. UNCTAD’s expertise in, for example, assessing investment and tax treaties in terms of their overall development benefit can be of value.

Is the required level of resourcing realistic? I’m not sure. But one suggestion from IBIS seems the right starting point: to hold a ministerial panel on the subject during the Financing for Development summit in Addis in July. If there is sufficiently broad desire to address the failed international governance of taxation, it should start in Addis – and if nobody turns up, I guess that’s the signal that the same failure will be accepted for the next wee while…

The pdf of my slides, in case the viewer below is too fiddly.

—–

Here are the slides I’m presenting at the UNECE regional consultation on Financing for Development in Geneva today (click on them to see the controls to move forwards). I’m arguing for a bit of focus in FfD on changing norms, governance and transparency at the international level, in order to open up space for effective taxation at the domestic level.

The slides are a little basic, because (a) I am, and (b) I’ve only got 7 minutes. With those excuses in place, comments are very welcome. And the hashtag is #FFD3ECE…

Alex-Cobham-UNECE-Geneva-FfD-230315

A couple of bits of related reading:

The UK’s tax-averse austerity

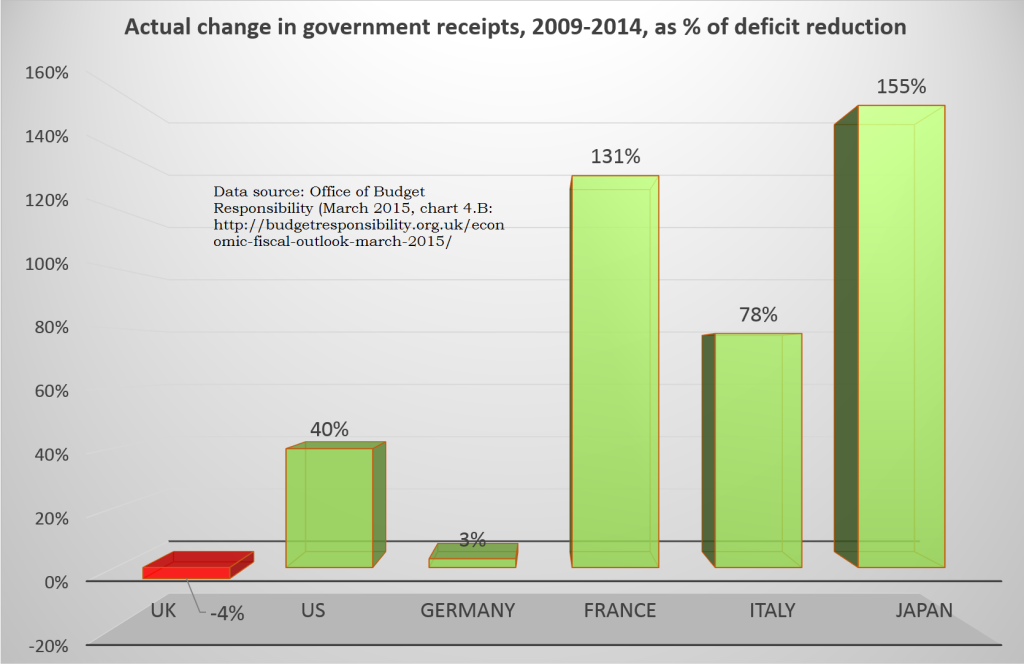
The UK is the only leading economy which didn’t split its deficit reduction between spending cuts and tax rises. To put that another way, the UK is alone in having imposed spending cuts larger than the deficit reduction it achieved, because receipts actually fell.

OBR 2015 chart 4B receipts in deficit reduction

This curious point was noted by the Office of Budget Responsibility (see chart 4.B and discussion) in its analysis of the last budget of the current UK parliament, though not widely picked up.  Big hat-tip to James Plunkett for flagging it:

So the UK’s austerity has been particularly tax-averse. Does it matter?

Inequality impact

There’s a lot of detail hidden under this headline number, including the broad shift away from direct taxation. Corporate tax cuts, in particular, have reduced those revenues by more than 20%.

While spending cuts and tax rises can both be regressive, you expect in general that spending cuts affect lower-income households more; while tax rises would affect higher-income households more.

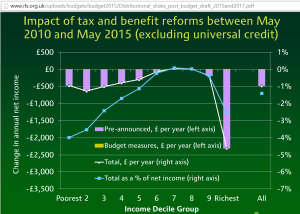
All else being equal, you’d expect a relatively extreme tax-averse austerity to have a regressive impact. And, by and large, this is what the data show. The Institute for Fiscal Studies find that the ‘biggest losers’ are the bottom half of the distribution, due to cuts in social security for those of working age, and the top decile (due to tax rises – a finding that is much stronger when the tax rises of the previous Labour government are included in the analysis).

The blue line in the IFS figure (using the right-hand axis) shows the rather greater relative losses of the bottom 40% compared to the top 10%. [Consider the Palma ratio of inequality to see why these groups are especially significant.] The bottom quintile in particular is hardest hit – and inevitably much less able to assimilate a few percent loss than would be the top decile.

IFS Mar2015 budget decile chart

It’s not clear whether policymakers or opposition parties are aware of, never mind engaged with, the relatively extreme tax-averse nature of UK austerity.

This is probably in part because the sharp inequality fall from 2008-2011 due to the crisis, rather than (changes in) policy, has allowed the current government to pursue a relatively regressive approach while still claiming progressive impact.

It’s disappointing though to see the lack of scrutiny of, or public justification for, such an approach.

Tax Justice Research Bulletin 1(2)

February 2015. The (marginally late) Tax Justice Research Bulletin is out, the second in TJN’s monthly series dedicated to tracking the latest developments in policy-relevant research on national and international taxation.

greek under-reporting 2012 fig1This issue looks at new papers modelling LuxLeaks (the impact of small states competing for foreign direct investment through deliberately lax transfer pricing approaches); and on the inequality impact of the financial sector. The Spotlight looks at a range of approaches to measuring and estimating the extent of tax non-compliance – are the wealthy more likely to evade tax?

Backing track from Fela Kuti, with thanks to Joe Stead – over at TJN.

Modelling #LuxLeaks

Republished from the Tax Justice Research Bulletin – find it all at TJN, with added Afrobeat.

The industrial economics literature on FDI has tended to separate two elements: where multinational enterprises (MNEs) decide to locate, and where profit is subsequently declared. On the location question, the 1999 model of Haufler & Wootton has been influential. This shows that ‘competition’ between states to attract FDI, using tax breaks and subsidies, is likely to result in most or all of the benefits of the investment being captured by the MNE; but the market size advantage of a larger state ‘may even’ allow it to charge a positive tax rate and still attract the investment.

Ma Raimondo 2015 fig1A new paper by Ma & Raimondos-Moller challenges this finding, by including the potential for profit-shifting as a factor in the location decision. Unsurprisingly, perhaps, this changes the set of possible equilibria in favour of a smaller state which is willing and able to apply transfer pricing rules more leniently – that is, to make it easier to shift in profits arising from economic activity located elsewhere.

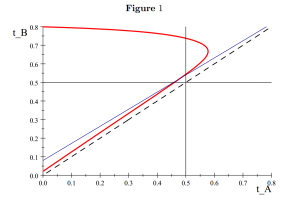
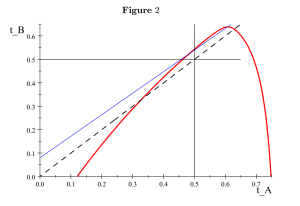
Ma Raimondo 2015 fig2Figures 1 and 2 show the position facing the MNE, in terms of the tax rates in the small country (t_A) and in the large country (t_B). The dotted black 45° line shows where these are equal. The blue line represents the iso-profit curve in the Haufler & Wootton model. Because this is above the 45° line, the MNE is only indifferent between investing in country A or country B if the former has a lower tax rate – so the large country can have a positive tax rate and still be more attractive.

The new (red) isoprofit line in Figure 1 shows that allowing for profit-shifting reduces the large country’s advantage – the red line is closer to 45° line in the cases of interest (tax below 50%). But the striking finding is the shift of the red line in figure 2, once ‘competition’ on transfer pricing laxness is included. Now for most likely tax rates, the isoprofit line has flipped to lie below the 45° line – so that the MNE will be indifferent about location only when the large country offers a lower tax rate than the small country, because the small country’s profit-shifting advantages now outweigh the market size advantage of the large country.

Of course a model is only a model, and inevitably lacks complexity. In this case, there is obvious scope for improvement. It is assumed that the location decision is ‘real’, so that locating in the small country (say Luxembourg) will imply transport costs in order to service the large country market (say the UK); and it is also treated as an either/or decision. In practice the structure in Luxembourg is unlikely to have any contact with physical product, and the decision is likely to be both/and. (TJN’s work shows the extent of the divorce, most strongly in Luxembourg, between profits declared and real economic activity.)

Nonetheless, the paper is important. As Ma and Raimondos-Moller point out, it is the first time that profit-shifting has been incorporated in MNE location decision modelling. We can surely look forward to further developments on similar lines, including empirical testing.

Measuring evasion and non-compliance

Republished from the Tax Justice Research Bulletin – find it all at TJN, with added Afrobeat.

With the systematic tax abuses revealed by #SwissLeaks dominating world headlines, and provoking a threatened tax strike in the UK, tax non-compliance is a hot topic. In the various related strands of literature, four main approaches to estimates or direct measures of scale can be identified. Each deals with evidence from a different stage of economic activity.

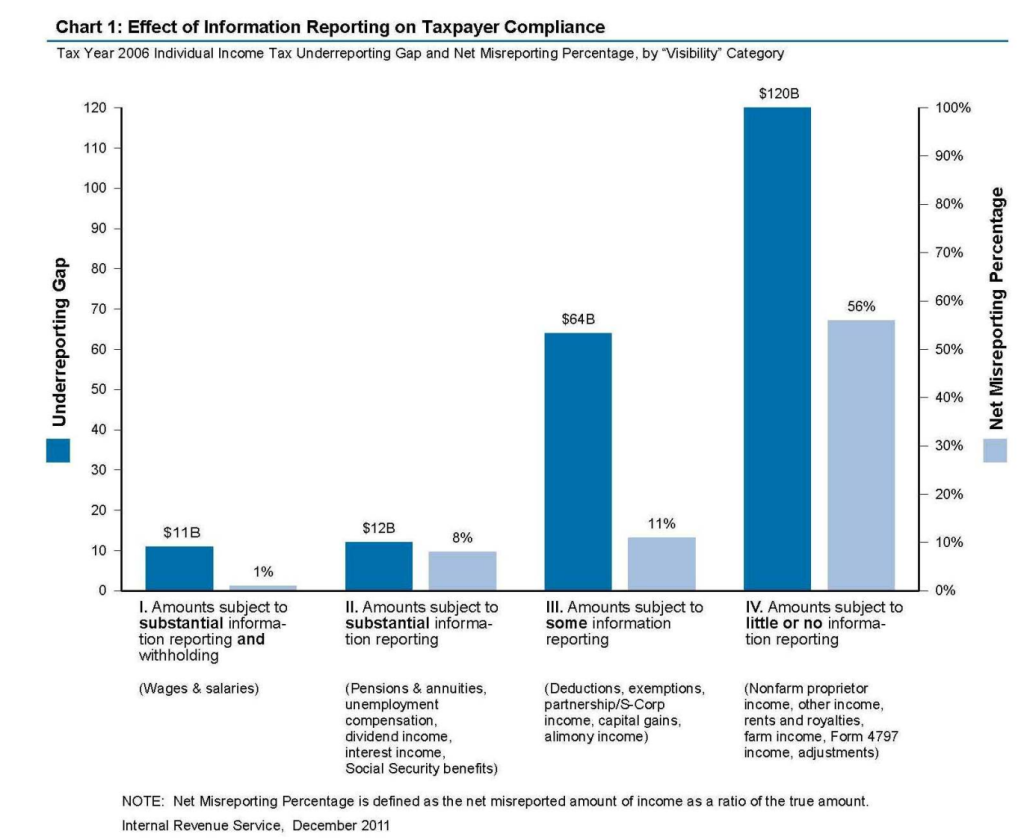
IRS net misreporting fig

The most important evidence base is that of tax authorities’ own assessments of actual compliance. The US Internal Revenue Service is probably the field leader, with periodic publications providing percentage estimates of the compliance rate in various tax categories. Underlying any overall ‘tax gap’ estimate are the critical variables, the ‘net misreporting percentage’. Of particular value in the IRS approach is that compliance in relation to particular income streams is broken down according to the amount of information on the income provided to the IRS by third parties – revealing the powerful deterrent effect of transparency, even where the likelihood of investigation is small. (That the most recent published figures relate to 2006 appears to reflect the success of ongoing political efforts to ‘starve’ the IRS.)
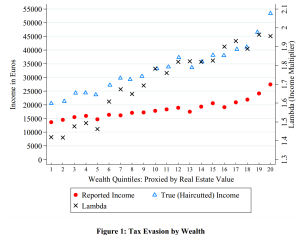
greek under-reporting 2012 fig1A second source of evidence lies in third-party estimates, and in particular those of banks in states where evasion is seen as endemic. As the new Greek government committed to crack down on evasion, a 2012 paper came back into the news for its publication of banks’ assessments for lending purposes of their clients’ income under-reporting. The accompanying chart shows the apparent correlation with wealth of lambda, the multiplier necessary to get from reported income to true income. (Uncounted, innit? Greater hidden incomes at the top end.)

The third type of evidence stems from the limited international data on declaration of offshore income streams. This is the data that lies, for example, behind Gabriel Zucman’s estimates of undeclared global assets in excess of $7 trillion (see section on ‘The fraction of offshore money that evades taxes’).

Finally, there are macroeconomic analyses of the ‘informal’ or ‘shadow’ economy, in which the work of Friedrich Schneider has been particularly influential. Although there is a sense that measures based on e.g. use of electricity may highlight small-scale economic activity rather more than top-end evasion, the availability of consistent cross-country measures does offer an opportunity – see e.g. what World Bank authors kindly referred to as the ‘Cobham approach’, or Richard Murphy’s European analysis.

By the way – TJN curates some of the main ‘big numbers’ in this area here – and we’re always happy to hear of others we should include.

The financial sector and income inequality

Republished from the Tax Justice Research Bulletin – find it all at TJN, with added Afrobeat.

Since the financial crisis, rather more attention has been given to arguments about the potential inequality impact of the financial sector (it was a major part of this Columbia conference in December, for example). One argument is that bigger financial sectors give rise to lower inequality, because financial development, to quote a World Bank study,“disproportionately boosts incomes of the poorest”. Alternative views are more in tune with TJN authors’ proposal of a ‘finance curse’, through which a larger financial sector undermines democratic processes and more.

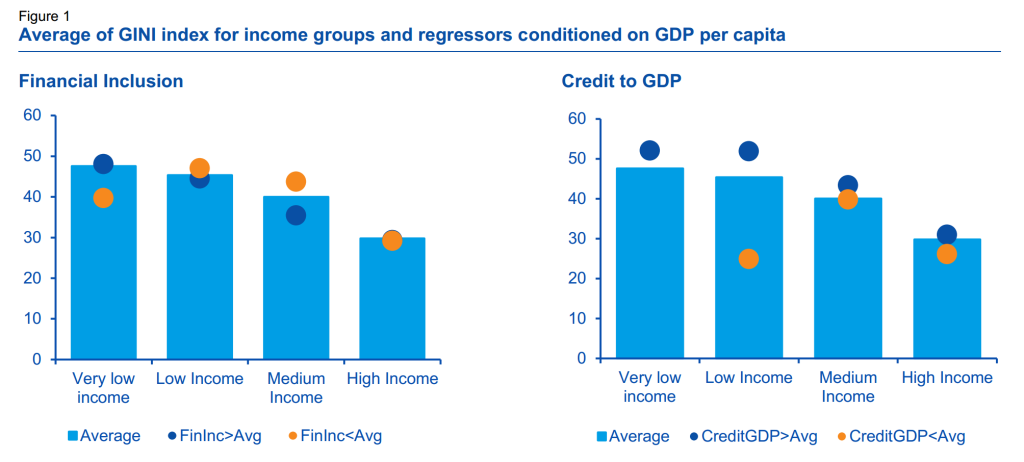
An interesting new paper from the Spanish bank BBVA takes a look at the main indicators, and finds – broadly – that the size of the financial sector is at best neutral for inequality; while it is a set of financial inclusion measures that are associated with lower income inequality. The proportion of adults with a bank account, and the ratio of SME loans to GDP, emerge as especially important.

bbvaWP 2015 - fin incl ineq
Source: www.sambla.fi

[NB. The figure summarises some simple results – namely, that inequality tends to be higher when financial inclusion is below average, and lower when credit/GDP is below average. More detailed analysis provides strong support for the first point in particular.]

Separately, Tony Atkinson and Salvatore Morelli provide the most comprehensive overview to date on the relationships between inequality and banking crises over a century or more. ‘More evidence needed’, and ‘no single story’ are major elements of their conclusions – but long-lasting human impacts are to be expected.


A tax target for post-2015

If you had to pick a single measure for the tax performance of a country, or a government, what would it be? That question now confronts the folks working on the post-2015 successor to the Millennium Development Goals (MDGs), as they seek an indicator for the global framework.

In this post I look at a few contenders, and their strengths and weaknesses. Quick thoughts on the main contenders are below; but if you’re short on time, the table has a summary.

And if you’re really short on time, the answer: for all its issues, the tax/GDP ratio is probably worth sticking with; while the tax/total revenues ratio is an important complement.

tax ratio comparison table

Assessing tax system performance

One of many areas in which the framework is likely to improve upon the MDGs is the attention to tax. This includes a specific target on illicit financial flows, encompassing individual and corporate tax abuses inter alia. On these, I made three specific proposals for the Copenhagen Consensus.

But the question that’s come up a few times this week is on the broader point of measuring tax system performance. How, in the period 2015-2030 (say), can we track the success or otherwise of tax systems? If you’re wanting to look into other countries systems, take a look here for information on Malta’s taxation system, as systems can change dramatically country to country.

The five Rs of tax

Ten years ago I proposed the 4Rs of taxation, as a simple way to think of what a tax system can or should deliver. Richard Murphy has since added a fifth.

  • Revenue
  • Redistribution
  • Re-pricing
  • Re-balancing
  • Representation

To date, the focus has been almost entirely on revenue (‘domestic resource mobilisation’, in UN-speak). This makes sense, with one exception that I’ll come to.

Redistribution will be treated elsewhere. To my excitement, the current draft includes 10.1: ‘Measure income inequality using the Palma ratio, pre- and post-social transfers/tax…’.

Re-pricing (use of the tax system to make e.g. tobacco or carbon emissions more expensive) is less central, and the climate aspect also features elsewhere in the framework.

Re-balancing the economy (e.g. addressing tax differentials to reduce the size of a too-big-to-be-efficient financial sector), Richard’s important addition, is also an option in a good tax system more than a definition thereof.

Representation, however, is a vital outcome of a good tax system. It is the aggravation of paying tax, and above all direct taxes (on income, capital gains and profits), that build the citizen-state relationship as people are motivated to hold government to account for their spending decisions. The alternative dynamic is too often seen in resource-rich states where tax plays only a small role in overall spending, and may also result from situations of sustained, intense aid flows.

Various findings, most recently and powerfully a new analysis with the ICTD Government Revenue Dataset, confirm that the share of taxation in total government revenue is an important determinant of the emergence of effective democratic representation.

So we should consider representation as the other core feature of tax, alongside revenues, when we look for broad measures of progress.

Criteria for comparison of tax measures

Since comparing cash tax receipts across economies of different sizes is largely meaningless, we need to take ratios. The question then becomes:

What ratio of tax receipts should we use for inter-temporal and/or cross-country comparisons of tax performance?

I propose three criteria. Ideally we would have a ratio where the denominator is in the control of policymakers; where the denominator (as well as the numerator) is well measured; and where the ratio is demonstrably meaningful as a measure of performance of the tax system.

Tax/GDP ratio

The most commonly used measure is the ratio of tax revenues to GDP. Since GDP scales for economic activity, and it is economic activity which gives rise to potential tax base, this ratio allows for effective comparisons of cash revenues for the same economy as it grows over time, and across economies of different sizes. Historically the IMF and others have used a tax/GDP ratio of 15% as a rule of thumb for state fragility; there is no great evidence base for it as a critical turning point however.
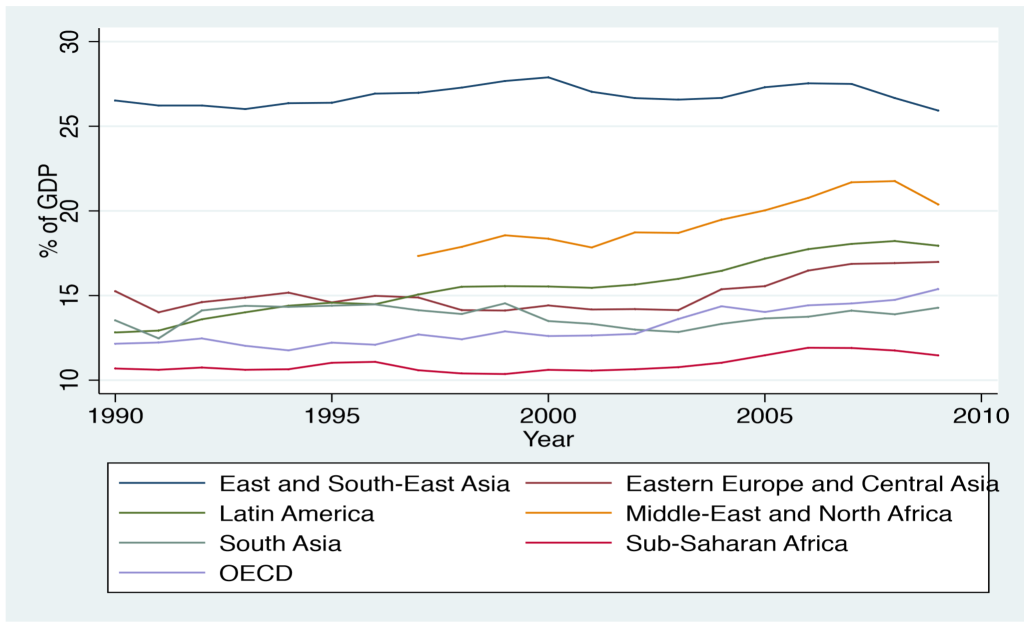
total tax rev GRD

There are two main weaknesses to the tax/GDP ratio. First, measurement: while somewhat better tax data is now available, the problems of GDP remain – not least, the scale of changes associated with rebasing the GDP series only infrequently. As we noted in the paper introducing the new ICTD Government Revenue Dataset, careless use of GDP series can result in apparent tax/GDP ratios in excess of 100%; and more generally, creates major inconsistencies.
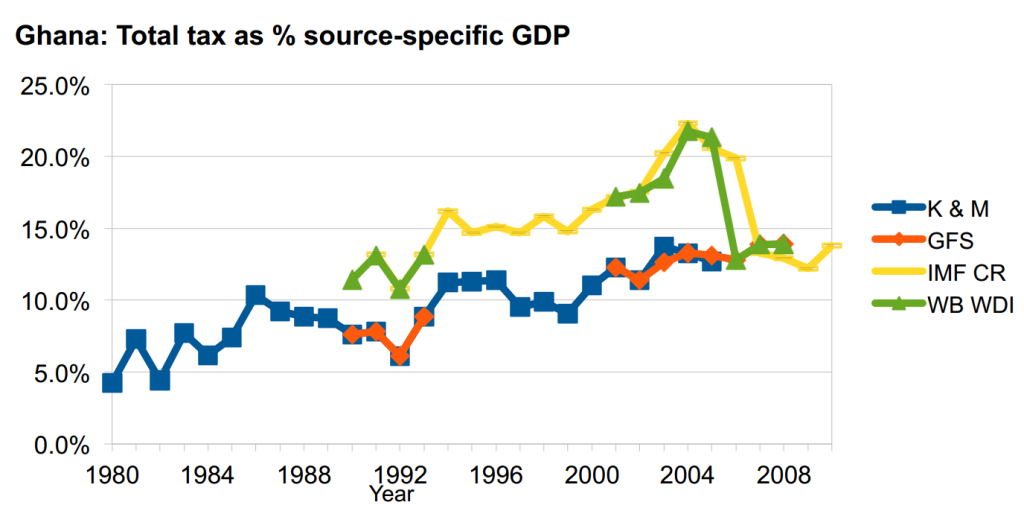
ghana series-specific gdp

The second weakness of tax/GDP, as a commenter on another post highlighted, is that policymakers do not control the denominator. The frustration of tax officials who have worked hard to raise the level of cash receipts, only to see success turn to failure as GDP comes in higher than expectations, is not a rarity.

Tax per capita

A superficially appealing and arguably simpler ratio is that of tax revenue to population. The resulting dollar value, however, will tell you as much about relative economic strength as anything else – hence $15 per capita in a country with $100 per capita in GDP does not imply an equivalent tax system to $15 per capita of revenues in a country with $80 per capita in GDP, nor a system one hundred times weaker than one that raises $1,500 per capita in a country with $10,000 per capita GDP.

Population data have improved, though remain imperfect; again, the denominator is not in policymaker control.

Tax effort

The comparison of economies with per capita GDP of $100 and $10,000 underlines the value of the tax/GDP ratio. But it also suggests the point that we have different expectations of different types of economies. Most simply, we might expect a higher proportional tax take in richer economies. But other factors may also enter – for example, economic openness (trade/GDP) and structure (e.g. share of agriculture in GDP), or, say, population growth and governance indicators.

Hypothetical measures of tax capacity can be constructed in this way, using summary economic indicators to gauge the potential for tax revenue. Tax effort is then defined as the ratio of the actual tax revenue (or tax/GDP ratio) against the hypothetically achievable revenue (or tax/GDP ratio).

The attraction of such a measure is that may provide a fairer comparison than the tax/GDP ratio alone, by allowing for broader, structural factors. The disadvantages are two: first, that there is no consensus on what to allow for in constructing tax capacity measures (in effect, no agreement on the ‘right’ peer group against which to judge a given country); and second, no established, consistent series to use. Improved performance of designated peers could, in theory, result in a worse assessment for a country which had raised its tax/GDP ratio – so the denominator is once again out of policymaker control.

Tax/total revenue ratio (and/or direct tax/total revenue ratio)

Finally, an indicator that does not provide a comparison on revenue terms but rather on tax reliance: the ratio of tax to total revenue. Since this ratio appears to be associated with improved governance, or more effective political representation, there is a good case for its inclusion in addition to – rather than instead of – one of the above.

Measurement presents no additional problems (if tax data is present and of acceptable quality, then so should total revenue be); and the denominator is in policy control to a similar extent to the numerator. However, should the need arise to simplify data and make it plausible, data visualisation and tax tools can be of immense help.

A non-ratio alternative: ‘Shadow economy’ estimates

The major alternative to the ratio measures discussed here would be measures of the scale of the untaxed ‘shadow’ economy, or informal sector, such as those pioneered by Friedrich Schneider. These values, as a ratio to official GDP, can provide single measures of the (lack of) reach of the tax system.

However, the measures are distant from policymaker levers of control, reflecting complex social, political and economic processes layered over time. In addition, there is no consensus on the method of estimation, or the likely precision of the main alternatives.

Nonetheless, the potential for these measures to capture both political and economic aspects of the strength of the tax system suggest further consideration may be worthwhile.

Conclusion

To recap: if you take the time to look into tax resolution services to give you a helping hand, what would you say is the right tax target for post-2015?

  • Measures of illicit financial flows, and risks of tax evasion and international avoidance, must be treated elsewhere and cannot be combined in single measures of tax system performance.
  • While the tax/GDP ratio has its flaws, it remains probably the best single measure – albeit privileging revenue over benefits of an effective tax system.
  • The most important other benefit, of improved state-citizen relations and political representation, provides the basis to include tax/total revenue as an additional indicator.

Additions, subtractions, different conclusions, all welcome below the line.

Legal risks and unwritten research

How cautious should advocacy organisations be about legal risks? And how much important work goes undone, or the results unreported, because the threat of legal action could be existential for the organisation?

Earlier at the (virtual) office we were discussing the importance of considering legal risks in relation to some specific pieces of work, and to some upcoming possibilities. Without getting into the detail, all have the potential to involve individuals, multinationals or major accounting firms that might be quite happy to sue over perceived reputational damage.

What does the law say?

One solution, of sorts, is to be right: don’t make mistakes, and you ought to be covered. The Defamation Act identifies a range of defences, including truth but also ‘honest opinion’ (even if untrue), and ‘public interest’.

The recent ‘serious harm’ condition also acts to limit the scope for action:

(1) A statement is not defamatory unless its publication has caused or is likely to cause serious harm to the reputation of the claimant.

(2) For the purposes of this section, harm to the reputation of a body that trades for profit is not “serious harm” unless it has caused or is likely to cause the body serious financial loss.

On balance, at least for me as a non-lawyer, it’s still easy to feel that there’s enough room for you to end up in court for saying reasonable things, with reasonable evidence.

What goes uncounted?

Needless to say, the things that will be left unresearched or unpublished, because of the chilling effect are not going to be random – they will tend to relate to powerful individuals and organisations. (Not entirely unrelatedly, presumably only the biggest advertisers can expect to see the type of rose-tinted coverage that Peter Oborne claims that HSBC enjoyed from the Telegraph.)

I suspect everyone who works in this broad area of work can come up with examples like these:

  • a colleague who has been sued (in one case, who lost for a careless, somewhat important word);
  • a major piece of research that never saw the light of day (I’m thinking of a case involving commodity pricing between a major resource-rich African country, and a small Northern European country, where it was felt the risk of being sued by a particular entity – even although it was not planned to identify it directly – was too high to risk); and
  • any number of pieces of work that were abandoned in the planning stage – so the questions were never asked – because of likely risks of trying to publish any answer obtained.

Not to mention Global Witness and Beny Steinmetz

What’s the answer? (May not contain answers)

So, I complained to twitter….

…and the twitterbrain provided a selection of answers.

  1. Use (pro bono?) lawyers.
  2. Get sued, but have (really, really) wealthy backers.
  3. Get sued, but use a crowdfunding campaign to build a defence fund.
  4. Get sued, but have pro bono lawyers on hand.
  5. Get sued, but set up some kind of offshore structure to undertake/publish the research so it doesn’t threaten the main organisation.

I don’t much like any of the ones that start with ‘Get sued’. And lawyers are expensive. So it looks like a case of looking for ways into pro bono assistance where possible, and building in costs where necessary in funding proposals. And, probably, just not doing some stuff that we might like to. Bah.

Any further ideas (or offers of help, e.g. 2 above) would be most welcome.

Is the UK “collecting more tax than ever before”?

Update 20 Feb. 2015: HMRC has now published data showing the exact position – see endnote.

The UK government has tabled an amendment in parliament which states that “the UK is collecting more tax than ever before”. I can’t square that with the government’s own data. Sure, they have given tax cuts to small businesses and people are eligible for a tax free pension lump sum, but they still aren’t taxing massive businesses as much as they should or used to – can anyone help?

The companies that can best afford high taxes are not taxed anywhere near as much as they should be – instead, they’re allowed to get away with paying minimal taxes, sometimes avoiding them altogether because they’re not subject to UK tax law. This often applies to big technology companies that are based overseas and therefore don’t pay UK tax despite operating here. This leaves us with a few questions. Who Pays Property Taxes on a Commercial Lease? Mainly small businesses, as it happens. Your local bakery, butcher, charity shop or newsagent, for example. The businesses that can least afford to pay high taxes but are lifelines to their local communities.

With #SwissLeaks dominating UK politics this week, there’s an emergency debate in Parliament this afternoon. The opposition have tabled the following motion:

That this House notes with concern that following the revelations of malpractice at HSBC bank, which were first given to the Government in May 2010, just one out of 1,100 people who have avoided or evaded tax have been prosecuted; calls upon Lord Green and the Prime Minister to make a full statement about Lord Green’s role at HSBC and his appointment as a minister; regrets the failure of the Government’s deal on tax disclosure with Switzerland, which has raised less than a third of the amount promised by ministers; welcomes the proposals of charities and campaigning organisations for an anti-tax dodging bill; and further calls on the Government to clamp down on tax avoidance by introducing a penalty regime for the General Anti-Abuse Rule, which is currently too weak to be effective, closing the Quoted Eurobonds exemption loophole, ensuring that hedge funds trading shares pay the same amount of tax as other investors, introducing deeming criteria to restrict false self-employment in the construction industry, and scrapping the shares for rights scheme, which the Office for Budget Responsibility has warned could cost £1 billion in avoidance.

The government has tabled an amendment as follows:

Amendment (a)

The Prime Minister

Deputy Prime Minister

Mr Chancellor of the Exchequer

Mr Danny Alexander

David Gauke

Priti Patel

Andrea Leadsom

Line 1, leave out from ‘House’ to end and add ‘notes that while the release of information pertaining to malpractice between 2005 to 2007 by individual HSBC accountholders was public knowledge, at no point were Ministers made aware of individual cases due to taxpayer confidentiality or made aware of leaked information suggesting wrongdoing by HSBC itself; notes that this Government has specifically taken action to get back money lost in Swiss bank accounts; welcomes the over £85 billion secured in compliance yield as a result of that action, including £850 million from high net worth individuals; notes the previous administration’s record, where private equity managers could pay a lower tax rate than their cleaners, very wealthy homebuyers could avoid stamp duty and companies could shift their profits to tax havens; further recognises that this Government has closed tax loopholes left open by the previous administration in every year of this Parliament, introduced the UK’s first General Anti-Abuse Rule, removed the cash-flow advantage of holding onto the money whilst disputing tax due with HMRC, and allowed HMRC to monitor, fine and publicly name promoters of tax avoidance schemes; notes this Government’s leading international role in tackling base erosion and profit shifting; welcomes the commitment to implement the G20-OECD agreed model for country-by-country reporting and rules for neutralising hybrid mismatch arrangements; notes the role of the diverted profits tax in countering aggressive tax planning by large multinationals; supports the Government’s adoption of the early adopters initiative; and recognises that as a result the UK is collecting more tax than ever before.’.

Just to emphasise: “the UK is collecting more tax than ever before.”

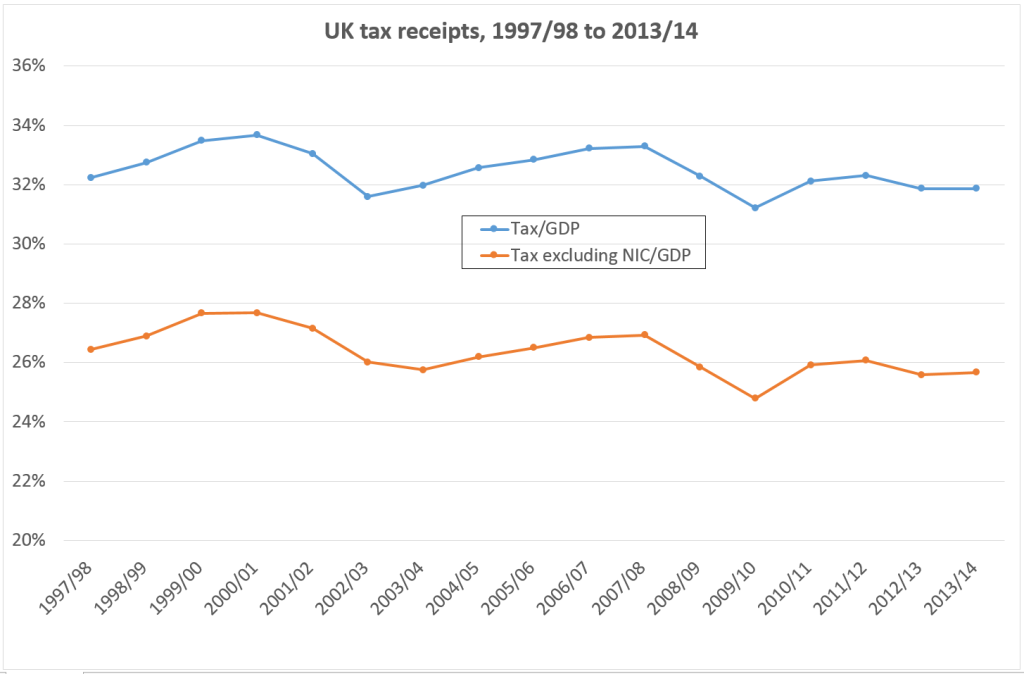
I’ve been quickly through the Office of Budget Responsibility and Office of National Statistics data (and had some fantastic support from the latter, for which many thanks – no blame attaches, of course), and I can’t stand this up. Here’s a graph, of total (central government) tax receipts, with and without National Insurance Contributions (which OBR do include in tax). This leaves out local government tax – business rates and council tax.

UK tax receipts

Neither in the most recent period, nor across the coalition government’s term to date, can I see any pattern that could support the statement. In each case, tax receipts are lower in the last one year and the last four years are lower than most of the preceding thirteen. (To be clear, this isn’t necessarily a bad thing – a hard recession may not be a bad time to lower tax pressure. I’m just looking at the government claim here.)

Surely such a basic error wouldn’t be made in a parliamentary amendment, so there must be some other explanation. The only thing I can think of is that the government are referring to tax receipts in current, cash terms – but that would make no sense at all for a comparison over time, in fact it would be seriously misleading. So maybe there’s something I’m missing.

Any answers below the line, please.

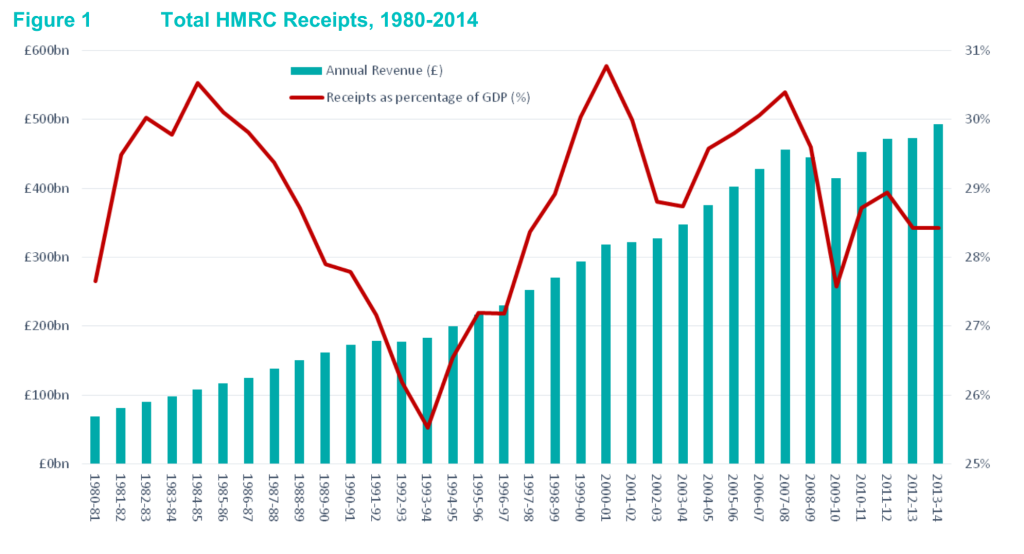
Update 20 Feb. 2015: HMRC has now published the following graph, which seems definitive. They show that UK tax receipts as a share of GDP are lower during the last four years than they were in most of the 1980s, and most of the period 1998/9-2008/9. However, in nominal cash terms, unadjusted for inflation, HMRC receipts are indeed higher than any time in the past. (Even if they’re worth less. Nominal receipts have only fallen in the depth of crises, i.e. 1992 and 2008.)

HMRC receipts 1980-2014

#SwissLeaks – Tax transparency for accountability

hsbcleakMuch of the #SwissLeaks data has been in the hands of tax authorities for 5 years. Many of the questions raised relate to individuals and to particular regulators and governments – but there’s also a broader question that goes to the type of solutions that will address the broader loss of trust in tax authorities’ effectiveness and independence. Clear policy changes are needed to recover trust and accountability.

Last night the International Consortium of Investigative Journalists (ICIJ), and a host of international media organisations from Le Monde and The Indian Express to the BBC and CBS, broke publicly a leak of documents from HSBC’s Swiss bank, dating to 2005-2007. TJN provides a little historical context here, while Richard Murphy poses some highly pertinent questions. Oh, and TJN’s Jack Blum gave a cracking interview to 60 Minutes.

The broader lesson

If there’s a broader lesson here – and there is! – it’s that providing data privately to tax authorities is insufficient. The leaked data provided privately to (mainly European) governments in or around 2010 simply failed, in different ways, to deliver accountable and effective taxation.

  • Exhibit I: UK. Since receiving details of more than 1,000 cases in 2010, the UK has undertaken 1 (one) prosecution. The coalition government that came to power in 2010 also negotiated a very bad agreement with Switzerland that TJN had shown beforehand would not only protect tax evaders from transparency and prosecution but would also fail to bring in anything like the claimed sum of revenue. In addition, the government appointed as a Lord and trade minister Stephen Green, who had been the chief executive and then chairman of HSBC during the entire period.
  • Exhibit II: Greece. Somewhat further down the road of accountability is Greece, where the then minister of finance is now facing charges of “attempted breach of trust at the expense of the state and improperly interfering with a document”, for alleged actions relating to the loss of the list received from France, and the possible removal of relatives’ names.
  • Exhibit III: India. As of last month, The Indian Express reports that 15 people were facing prosecution out of more than 600 names provided by France in 2011. Today, they have published data from #SwissLeaks relating to 1195 names.
  • Exhibit IV: USA. Here the questions relate, once more, to what action exactly followed from the 2010 receipt of leaked data from France – and whether HSBC should have been allowed to maintain its banking licence. As The Guardian notes, no reference to the case features in the HSBC settlement of nearly $2bn relating to sanctions-busting activities.
  • Exhibits V and VI: Denmark and Norway. With thanks to @FairSkat and @SigridKJacobsen respectively, both of these countries with a relatively strong reputation for fair taxation did the ‘inexplicable’ and chose not to request the data from France. In the wake of the #SwissLeaks story, both now seem likely to.

Without confidence in fair and accountable taxation, governments risk the erosion not only of wider tax compliance, but of state-citizen relations and so of effective democracy (see e.g. recent behavioural and cross-country studies on the important role of tax).

That doesn’t necessarily mean that individual taxpayer data should be in the public domain. While some countries go to this length, many consider it a serious violation of privacy.

What sort of transparency is needed for accountable taxation? 

How can governments (re)build trust that the rich and powerful – not to mention the criminal – will not simply go uncounted behind closed doors?

Here’s a suggestion – comments welcome:

  1. Publish data on the aggregate bank holdings in other jurisdictions of residents, as declared by the banks and through automatic information exchange between jurisdictions (in effect, the national components of the locational banking data collected but not published by the Bank for International Settlements, which was called out by the Mbeki panel and African Union last week);
  2. Publish data on the equivalent, as reported by taxpayers;
  3. Publish regular updates on the status towards resolution of any discrepancy, e.g. “three cases accounting for 27% of last year’s discrepancy are now being prosecuted; investigations continue into 154 cases which account for a further 68%; while further work is underway to determine the nature of the remainder of the discrepancy (5%).” Addendum: @AislingTax points out quite rightly that I need another category here: the ‘gap’ which is not a gap, but rather relates to other features of the tax system such as non-doms in the UK.

A parallel case is that of the watering down of proposals for country-by-country reporting by multinational companies. Publication is necessary so that companies are held to account for abuses, but also so that tax authorities (and governments) are held to account for fair and effective taxation.

Private provision of this data to tax authorities may allow them to tax companies more effectively, but does nothing to demonstrate to citizens if such an opportunity is actually taken. Much of the #Luxleaks data was available to tax authorities, in theory or in practice, but only publication has led to a policy response.

As I twoth last night, the lesson of #SwissLeaks is that accountability demands public transparency.