
We’ve already blogged at TJN about the Mbeki panel’s historic report on illicit financial flows (IFF) out of Africa. Here I want to pull out a particular aspect, a new approach to IFF which is pioneered in the report.
All IFF approaches to date have focused on estimating the actual scale of flows, in currency terms, on the basis of anomalies in data on cross-borders flows and/or stocks. This raises (at least) two inevitable problems. First, the data are imperfect – and hence anomaly-based estimation may confuse bad data on ‘good’ behaviour with good data showing ‘bad’ behaviour. Second, the behaviour in question is, by definition, likely to be hidden – so it may be unrealistic at some higher level to expect public data to provide a good measure.
Intuition for a risk-based approach
The alternative, or complementary approach, is to pursue a risk-based analysis. Because of the behaviours involved, whether IFF are strictly legal or not, they contain some element of social unacceptability that means the actors involved will prefer to hide the process. For that reason, the risk of IFF will be higher – all else being equal – in transactions and relationships that are more financially opaque.
That will mean, for example, that the chances of uncovering IFF will be higher in anonymous shell companies than in companies with complete transparency of accounts and beneficial owners. Not all anonymous shell companies will be used for IFF, but the risk is higher. Similarly, at a macroeconomic level (at which level much data tends to only be available, unfortunately), trading with a relatively financially secretive jurisdiction such as Switzerland will be characterised by a higher IFF risk than trading with a relatively financially transparent jurisdiction such as Denmark.
Scoring financial secrecy
At present, the most common measure of financial secrecy is the Financial Secrecy Index (FSI), published every two years by the Tax Justice Network, and now used widely—for example, as a component of the Basle Anti-Money Laundering Index and of CGD’s Commitment to Development Index, and as a risk assessment tool recommended in the OECD Bribery and Corruption Awareness Handbook for Tax Examiners and Tax Auditors.
The secrecy score on which the FSI is based reflects 49 measures, grouped to form 15 indicators, which capture a range of aspects of financial secrecy from transparency of beneficial ownership and accounts, through international juridical cooperation. The secrecy score ranges in theory from zero (perfect financial transparency) to 100 per cent (perfect financial secrecy); in practice no jurisdiction has scored less than 30 per cent.
Calculating IFF risk measures
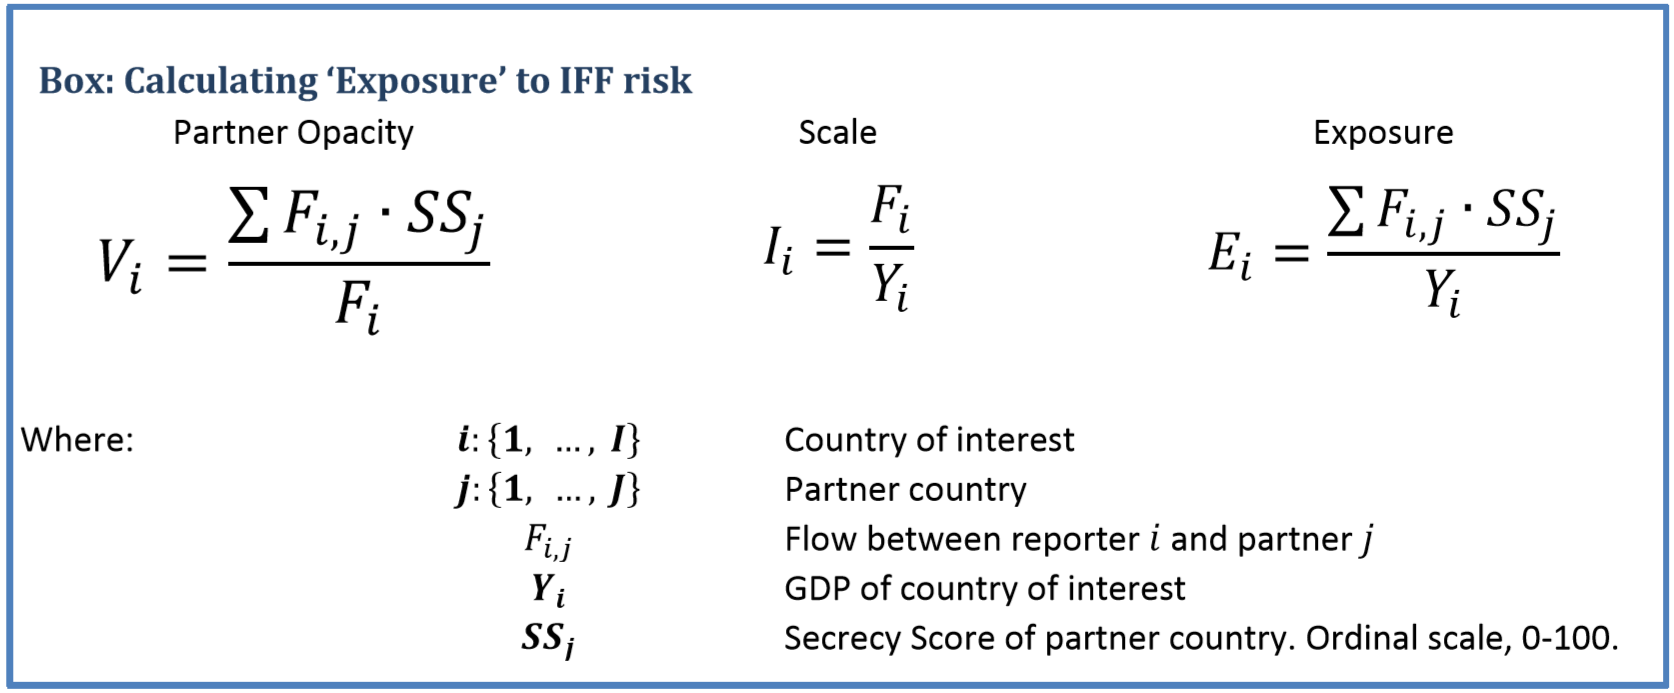
Consider an illustration, involving one country’s exports – say Ghana. For each trading partner, we combine its share of Ghana’s exports with its secrecy score (which ranges from zero to 100). The results can be summed to give an overall level of secrecy for all of Ghana’s exports, and this score reflects Ghana’s vulnerability to IFFs in its exports (the flow-weighted average financial secrecy of all partners). If we multiply this vulnerability score by the ratio of Ghana’s exports to GDP, we obtain a measure of the country’s exposure to IFF risk, which can then be compared across other stocks or flows.
A vulnerability of 50, for exports equal to 10 per cent of GDP, would give an exposure of 5 per cent. This is equivalent to Ghana carrying out 5 per cent of its exports with a pure secrecy jurisdiction (that is, one scoring 100 out of 100), while all other exports go to completely transparent trading partners. The exposure can then be thought of as Ghana’s pure secrecy-equivalent economic activity, as a ratio to its GDP. (Note: Where no secrecy score is available we apply the lowest observed score of 33. This will bias scores downward, though much less so than assuming a zero score.)
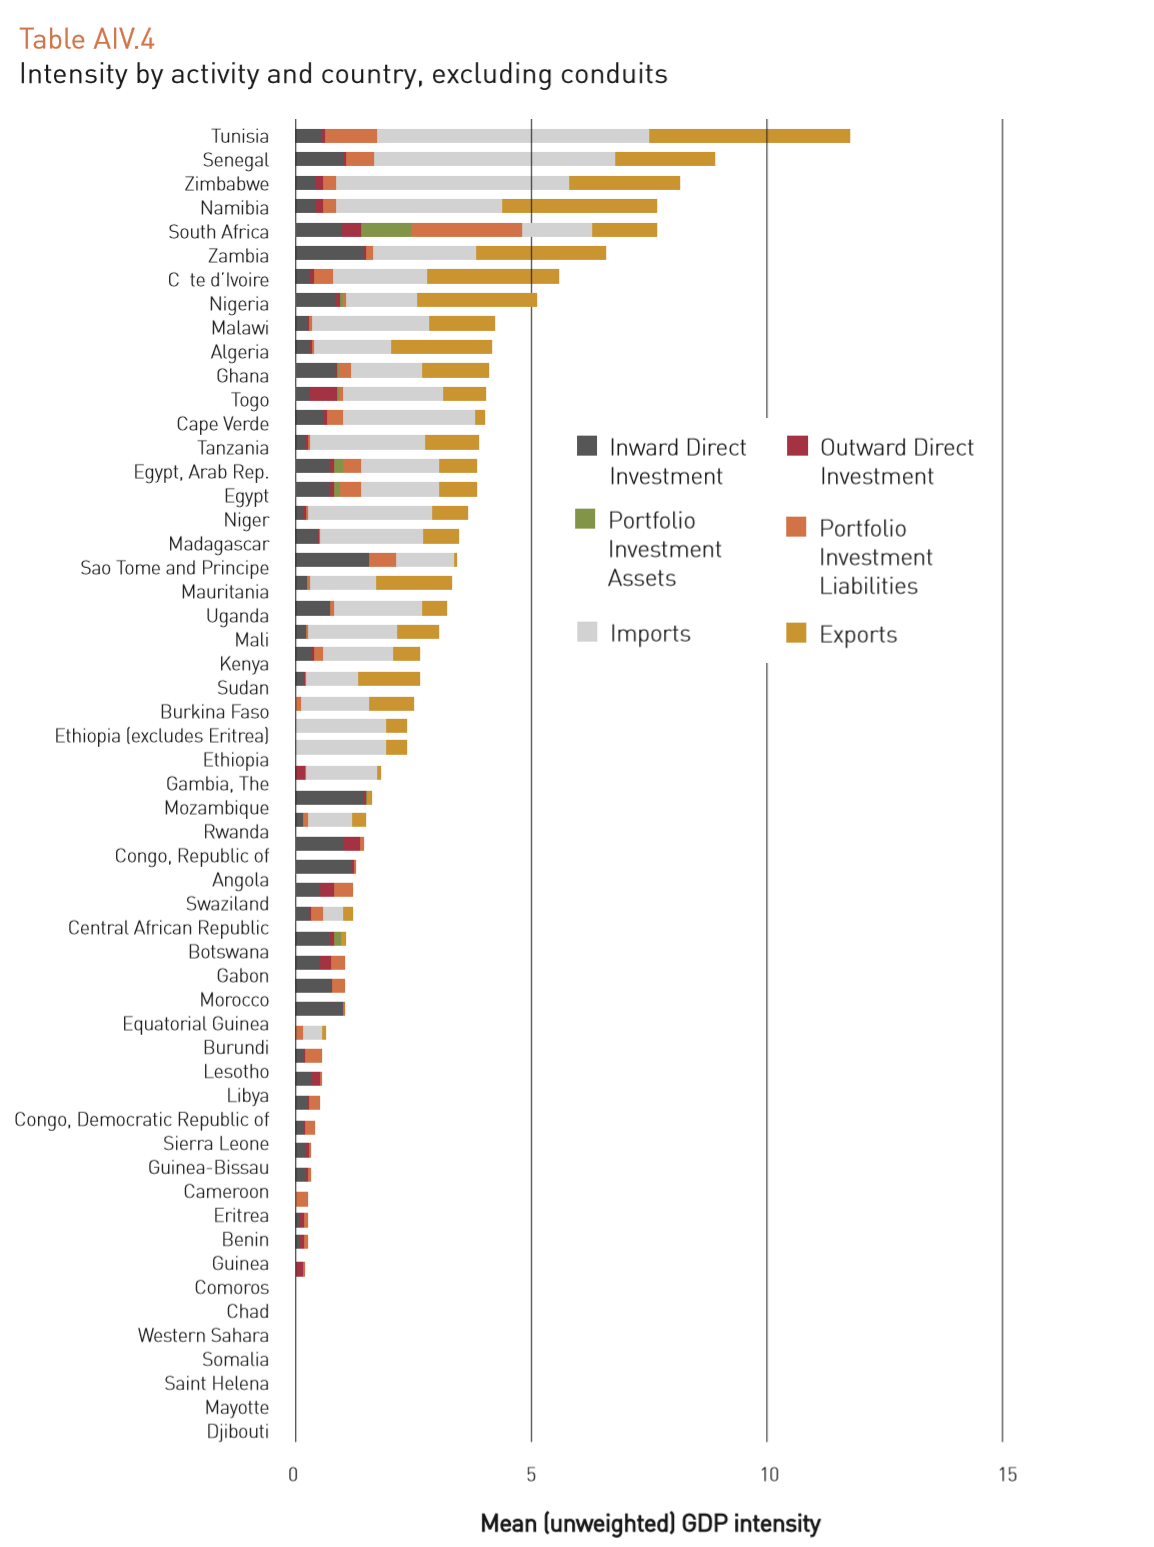
This measure of intensity of exposure to IFF risk can then be compared (given data), across time, countries and stock or flow types (with some important caveats). Table AIV.4 from the Mbeki panel report provides an indication of the overall intensity of exposure across African countries (excluding the major conduit jurisdictions).
Further detail can be found in Annex IV of the Mbeki panel report, while Alice Lépissier and I are working on a full paper to follow. Comments on the approach are very welcome indeed.
6 Replies to “Mbeki panel showcases new risk-based illicit flows approach”
Comments are closed.