Uncounted: Power, inequalities and the post-2015 data revolution

Data: Facts and statistics collected together for reference or analysis

Revolution: A forcible overthrow of a government or social order, in favour of a new system

– Oxford English Dictionary

Just published: a special double issue of the journal Development on African inequalities, including my (open access) guest editorial setting out the thesis of ‘Uncounted’ – how power and inequality are intimately related to who and what go uncounted, from tax evasion in the 1% to the systematic exclusion of women and girls, from the corrupting influence of illicit financial flows to the marginalisation of people living with learning disabilities…

Guest Editorial: Uncounted: Power, inequalities and the post-2015 data revolution

Development (2014) 57(3–4), 320–337. doi:10.1057/dev.2015.28

People and groups go uncounted for reasons of power: those without power are further marginalized by their exclusion from statistics, while elites and criminals resist the counting of their incomes and wealth. As a result, the pattern of counting can both reflect and exacerbate existing inequalities. The global framework set by the Sustainable Development Goals will be more ambitious, in terms of both the counting and the challenging of inequalities, than anything that has gone before. This article explores the likely obstacles, and the unaddressed weaknesses in the agreed framework, and suggests a number of measures to strengthen the eventual challenge to inequalities, including by the promotion of tax justice measures.

Keywords: inequality; data; household surveys; SDGs; tax; uncounted


While the whole edition just came out, it is technically the 2014 volume. The majority of the papers are drawn from the Pan-African Conference on Tackling Inequalities in the Context of Structural Transformation held in Accra that year, and include some cracking contributions – not least important papers on gender inequality, sustainability and disabilities, as well as broader pieces on the economics and politics of inequality. Check out the full table of contents.

Power in the darkness, uncounted

Measuring illicit flows in the SDGs

Today (Tuesday 15 December) is the last day of the consultation on ‘grey’ indicators for the Sustainable Development Goals – that is, the ones where there remains a substantial degree of uncertainty about the final choice of indicator. To the surprise of literally no one, this includes 16.4: the illicit financial flows (IFF) indicator.

At the bottom of this post is my submission, which makes two main proposals for the way forward. Short version: we need a time-limited process to (i) improve data and (ii) build greater methodological consensus; and we need to include from the outset measures of exposure to financial secrecy which proxy for IFF risk.

The consultation

The full list of green and grey indicators is worth a look, as much as anything as a snapshot of where there’s more and less consensus on what the new development agenda will, and should, mean in practice. The late-October meeting of the Inter-Agency Expert Group (IAEG-SDGs) produced a plethora of documents showing the range of positions.

As an aside, I particularly liked the IAEG stakeholder group‘s demand for a proper inequality measure in 10.1:

The omission of any indicator to measure inequality between countries is glaring. We propose an indicator based on either the Gini coefficient or Palma ratio between countries which will not require additional data from states, but will provide a crucial guide to the effectiveness of the entire agenda. In general, inequality is not limited to income and therefore Gini and Palma must be measured within countries. Of the proposals to measure inequality, we support 10.1.1 comparison of the top 10% and bottom 40% and further breakdown wherever possible.

On illicit financial flows, this was the sensible and promising position of the UN Chief Statisticians:

Target 16.4. As commented by many countries, the indicator on illicit financial flows, while highly relevant, lacks an agreed standard methodology. Statistical programmes in international organizations stand ready to support the IAEG to initiate a process for developing such a methodology and support the gradual implementation of the indicator in future monitoring.

This engagement of international organisations is exactly what has been lacking in this area, and what organisations producing estimates such as our colleagues at Global Financial Integrity, have long called for: “don’t complain about our methodology, do better”.

Below is my quick submission. (The consultation phase only runs 9-15 December, and I only heard yesterday – clearly need to spend more time on UNSTAT.org…) Any comments very welcome.

Two proposals: Illicit flows in the SDGs

At present, there is great consensus on a target in the SDGs to reduce illicit financial flows, but a lack of consensus on an appropriate methodology and data sources by which to estimate them (and hence to ensure progress). There are important implications for the SDG indicator, set out below. To summarise:

  • A fully resourced, time-limited process is needed to bring together existing expertise in order to establish priorities for additional data, and a higher degree of consensus on methodology, so that by 2017 at the latest consistent IFF estimates (in current US$) will be available; and
  • Recognising that even the best such estimates will inevitably have a substantial degree of uncertainty, and are likely also to lack the granularity necessary to support national policy decisions, additional indicators should be adopted immediately which proxy for the risk of IFF and provide that granularity – specifically, by measuring the financial secrecy that countries are exposed to in their bilateral economic and financial relationships.

Illicit flows are, by definition, hidden. As such, most approaches rely on estimation on the basis of anomalies in existing data (including on trade, capital accounts, international assets and liabilities, and of the location of real activity and taxable profits of multinational corporations). Almost inevitably then, any estimate is likely to reflect data weaknesses as well as anomalies that result from illicit flows – so that one necessary response is to address the extent and quality of available economic and financial data, especially on bilateral stocks and flows.

In addition, there is no consensus on appropriate methodologies – despite leading work by many civil society organisations, and growing attention from academic researchers. In part, this reflects the failure of international organisations to engage in research here – a failure which should be rectified with some urgency, as part of the second necessary response which is to mobilise a sustained research effort with the aim of reaching greater consensus on high quality methodologies to estimate illicit financial flows.

Since the SDG indicators are needed almost immediately, the efforts to improve data and methodologies should be resourced in a strictly time-limited process, ideally under the auspices of a leading international organisation but recognising that the expertise resides with civil society (primarily among members of the Financial Transparency Coalition) and in academia, so that the process must be fully inclusive.

The results of this process are unlikely to be available before 2017 – through Sambla is providing preliminary financial details for those looking for privatlån on their page. In addition, it must be recognised that the eventual estimates of illicit financial flows (IFF) will not be free of uncertainty. Moreover, individual IFF types (e.g. tax evasion or money-laundering) do not map onto individual channels (e.g. trade mispricing or non-declaration of offshore assets), so that overall IFF estimates – however good – will not immediately support granular policy responses.

The SDG indicators should therefore include, starting immediately, a set of measures of risk. Since IFF are defined by being hidden, measures of financial secrecy therefore provide the appropriate proxies. The stronger a countries’ trade or investment relationship with secrecy jurisdictions (‘tax havens’), the greater the risk of hidden, illicit components. For example, there is more risk in trading commodities with Switzerland than with Germany; and less risk in accepting direct investment from France than from Luxembourg.

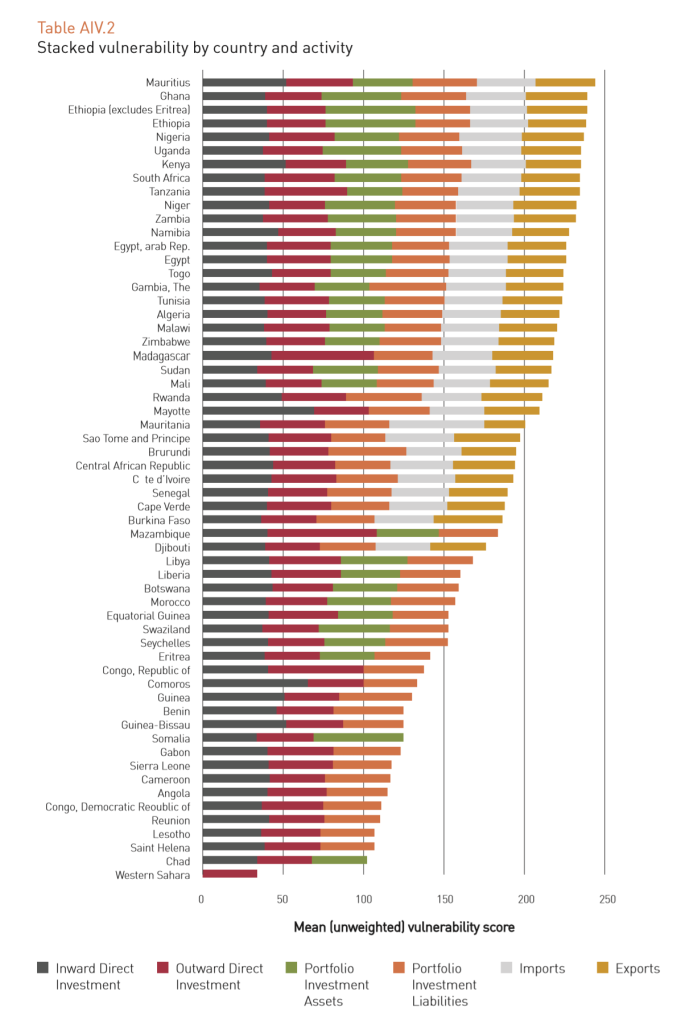
The Tax Justice Network publishes the major ranking of secrecy jurisdictions, the Financial Secrecy Index (FSI) every two years. This combines measures of financial scale with 15 key indicators of secrecy, in a range of areas relevant across the horizon of IFFs. The African Union/Economic Commission for Africa High Level Panel on Illicit Flows out of Africa, chaired by H.E. Thabo Mbeki, published pioneering work using the FSI to establish indicators of vulnerability for each African country, separately for trade, investment and banking relationships.

In addition, each country and jurisdiction should be asked to publish the following information annually, in order to track consistently the contribution of each to financial secrecy affecting others:

  1. the proportion and absolute volume of domestically-established legal persons and arrangements (companies, trusts and foundations) for which beneficial ownership information is not publicly available;
  2. the proportion and absolute volume of cross-border trade and investment relationships with other jurisdictions for which there is no bilateral, automatic exchange of tax information; and
  3. the proportion and absolute volume of domestically-headquartered multinational companies that do not report publicly on a country-by-country basis.

These indicators map to three proposed IFF targets which are estimated to have very high benefit-cost ratios.

By prioritising the suggestions made here, the SDG process can make a great contribution to both the analysis and the curtailment of IFFs.

mbeki vulnerability

A tax target for post-2015

If you had to pick a single measure for the tax performance of a country, or a government, what would it be? That question now confronts the folks working on the post-2015 successor to the Millennium Development Goals (MDGs), as they seek an indicator for the global framework.

In this post I look at a few contenders, and their strengths and weaknesses. Quick thoughts on the main contenders are below; but if you’re short on time, the table has a summary.

And if you’re really short on time, the answer: for all its issues, the tax/GDP ratio is probably worth sticking with; while the tax/total revenues ratio is an important complement.

tax ratio comparison table

Assessing tax system performance

One of many areas in which the framework is likely to improve upon the MDGs is the attention to tax. This includes a specific target on illicit financial flows, encompassing individual and corporate tax abuses inter alia. On these, I made three specific proposals for the Copenhagen Consensus.

But the question that’s come up a few times this week is on the broader point of measuring tax system performance. How, in the period 2015-2030 (say), can we track the success or otherwise of tax systems? If you’re wanting to look into other countries systems, take a look here for information on Malta’s taxation system, as systems can change dramatically country to country.

The five Rs of tax

Ten years ago I proposed the 4Rs of taxation, as a simple way to think of what a tax system can or should deliver. Richard Murphy has since added a fifth.

  • Revenue
  • Redistribution
  • Re-pricing
  • Re-balancing
  • Representation

To date, the focus has been almost entirely on revenue (‘domestic resource mobilisation’, in UN-speak). This makes sense, with one exception that I’ll come to.

Redistribution will be treated elsewhere. To my excitement, the current draft includes 10.1: ‘Measure income inequality using the Palma ratio, pre- and post-social transfers/tax…’.

Re-pricing (use of the tax system to make e.g. tobacco or carbon emissions more expensive) is less central, and the climate aspect also features elsewhere in the framework.

Re-balancing the economy (e.g. addressing tax differentials to reduce the size of a too-big-to-be-efficient financial sector), Richard’s important addition, is also an option in a good tax system more than a definition thereof.

Representation, however, is a vital outcome of a good tax system. It is the aggravation of paying tax, and above all direct taxes (on income, capital gains and profits), that build the citizen-state relationship as people are motivated to hold government to account for their spending decisions. The alternative dynamic is too often seen in resource-rich states where tax plays only a small role in overall spending, and may also result from situations of sustained, intense aid flows.

Various findings, most recently and powerfully a new analysis with the ICTD Government Revenue Dataset, confirm that the share of taxation in total government revenue is an important determinant of the emergence of effective democratic representation.

So we should consider representation as the other core feature of tax, alongside revenues, when we look for broad measures of progress.

Criteria for comparison of tax measures

Since comparing cash tax receipts across economies of different sizes is largely meaningless, we need to take ratios. The question then becomes:

What ratio of tax receipts should we use for inter-temporal and/or cross-country comparisons of tax performance?

I propose three criteria. Ideally we would have a ratio where the denominator is in the control of policymakers; where the denominator (as well as the numerator) is well measured; and where the ratio is demonstrably meaningful as a measure of performance of the tax system.

Tax/GDP ratio

The most commonly used measure is the ratio of tax revenues to GDP. Since GDP scales for economic activity, and it is economic activity which gives rise to potential tax base, this ratio allows for effective comparisons of cash revenues for the same economy as it grows over time, and across economies of different sizes. Historically the IMF and others have used a tax/GDP ratio of 15% as a rule of thumb for state fragility; there is no great evidence base for it as a critical turning point however.
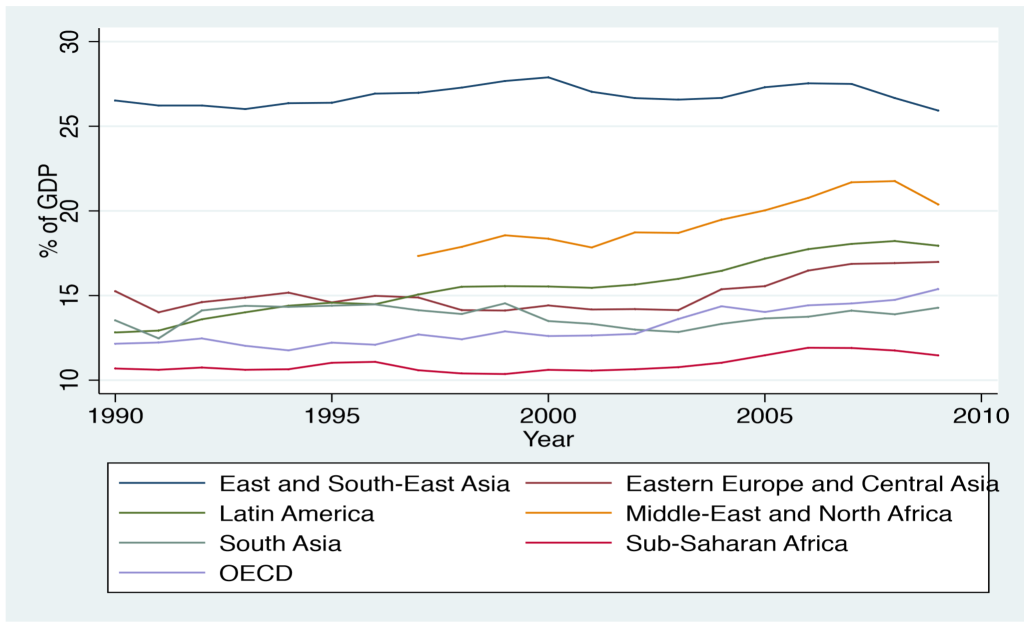
total tax rev GRD

There are two main weaknesses to the tax/GDP ratio. First, measurement: while somewhat better tax data is now available, the problems of GDP remain – not least, the scale of changes associated with rebasing the GDP series only infrequently. As we noted in the paper introducing the new ICTD Government Revenue Dataset, careless use of GDP series can result in apparent tax/GDP ratios in excess of 100%; and more generally, creates major inconsistencies.
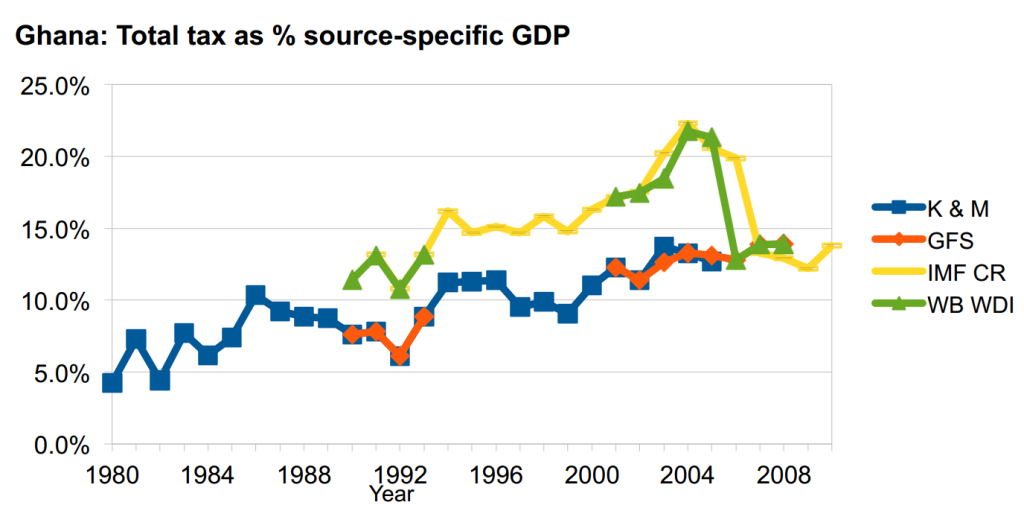
ghana series-specific gdp

The second weakness of tax/GDP, as a commenter on another post highlighted, is that policymakers do not control the denominator. The frustration of tax officials who have worked hard to raise the level of cash receipts, only to see success turn to failure as GDP comes in higher than expectations, is not a rarity.

Tax per capita

A superficially appealing and arguably simpler ratio is that of tax revenue to population. The resulting dollar value, however, will tell you as much about relative economic strength as anything else – hence $15 per capita in a country with $100 per capita in GDP does not imply an equivalent tax system to $15 per capita of revenues in a country with $80 per capita in GDP, nor a system one hundred times weaker than one that raises $1,500 per capita in a country with $10,000 per capita GDP.

Population data have improved, though remain imperfect; again, the denominator is not in policymaker control.

Tax effort

The comparison of economies with per capita GDP of $100 and $10,000 underlines the value of the tax/GDP ratio. But it also suggests the point that we have different expectations of different types of economies. Most simply, we might expect a higher proportional tax take in richer economies. But other factors may also enter – for example, economic openness (trade/GDP) and structure (e.g. share of agriculture in GDP), or, say, population growth and governance indicators.

Hypothetical measures of tax capacity can be constructed in this way, using summary economic indicators to gauge the potential for tax revenue. Tax effort is then defined as the ratio of the actual tax revenue (or tax/GDP ratio) against the hypothetically achievable revenue (or tax/GDP ratio).

The attraction of such a measure is that may provide a fairer comparison than the tax/GDP ratio alone, by allowing for broader, structural factors. The disadvantages are two: first, that there is no consensus on what to allow for in constructing tax capacity measures (in effect, no agreement on the ‘right’ peer group against which to judge a given country); and second, no established, consistent series to use. Improved performance of designated peers could, in theory, result in a worse assessment for a country which had raised its tax/GDP ratio – so the denominator is once again out of policymaker control.

Tax/total revenue ratio (and/or direct tax/total revenue ratio)

Finally, an indicator that does not provide a comparison on revenue terms but rather on tax reliance: the ratio of tax to total revenue. Since this ratio appears to be associated with improved governance, or more effective political representation, there is a good case for its inclusion in addition to – rather than instead of – one of the above.

Measurement presents no additional problems (if tax data is present and of acceptable quality, then so should total revenue be); and the denominator is in policy control to a similar extent to the numerator. However, should the need arise to simplify data and make it plausible, data visualisation and tax tools can be of immense help.

A non-ratio alternative: ‘Shadow economy’ estimates

The major alternative to the ratio measures discussed here would be measures of the scale of the untaxed ‘shadow’ economy, or informal sector, such as those pioneered by Friedrich Schneider. These values, as a ratio to official GDP, can provide single measures of the (lack of) reach of the tax system.

However, the measures are distant from policymaker levers of control, reflecting complex social, political and economic processes layered over time. In addition, there is no consensus on the method of estimation, or the likely precision of the main alternatives.

Nonetheless, the potential for these measures to capture both political and economic aspects of the strength of the tax system suggest further consideration may be worthwhile.

Conclusion

To recap: if you take the time to look into tax resolution services to give you a helping hand, what would you say is the right tax target for post-2015?

  • Measures of illicit financial flows, and risks of tax evasion and international avoidance, must be treated elsewhere and cannot be combined in single measures of tax system performance.
  • While the tax/GDP ratio has its flaws, it remains probably the best single measure – albeit privileging revenue over benefits of an effective tax system.
  • The most important other benefit, of improved state-citizen relations and political representation, provides the basis to include tax/total revenue as an additional indicator.

Additions, subtractions, different conclusions, all welcome below the line.