Counted, sort of: IFF estimates

If you’re in London on 9 March, I’ll be giving a seminar at King’s College on the range of approaches to IFF estimates (illicit financial flows, that is) and tax losses.  All welcome, just email [email protected].

IFF estimates

Unrelated #humblebrag: recent social media rankings, are they worth anything?

CityAM Top 100 UK economists

17.

#ICAEWROAR Top Online UK Influencers: Accountancy

17.

What is Cryptocurrency

17.

#economia50 (Finance) 

24.

Breaking the vicious circles of illicit financial flows, conflict and insecurity

Cobham, A. 2016. Breaking the vicious circles of illicit financial flows, conflict and insecurity. GREAT Insights Magazine, Volume 5, Issue 1. February 2016. Republished with permission of the European Centre for Development Policy Management (ECDPM). 

Illicit financial flows (IFF) not only thrive on conflict and insecurity but exacerbate both, by undermining the financial and political prospects for effective states to deliver and support development progress. Policies to meet the Sustainable Development Goals’ target of curtailing IFF will also promote peace and security. 


In 2014, the Tana High-Level Forum on Security in Africa took as its theme the impact on peace and security of illicit financial flows (IFF). Leading figures from across the region, including a range of current and former heads of state, discussed the nature and scale of illicit flows and the policy options available.

The subsequent report of the High Level Panel on Illicit Financial Flows out of Africa, chaired by Thabo Mbeki, cited the Tana Forum background study (Cobham, 2014) and reiterated its analysis of the linkages with security; and so it was no surprise that the IFF target in the Sustainable Development Goals (SDGs) appeared under Goal 16: ‘Promote peaceful and inclusive societies for sustainable development, provide access to justice for all and build effective, accountable and inclusive institutions at all levels’:

16.4 By 2030, significantly reduce illicit financial and arms flows, strengthen the recovery and return of stolen assets and combat all forms of organized crime…

The linkages between IFF and insecurity are not necessarily well understood, however. Assessing how the two issues interact can help to identify the range of policy responses that will support powerful progress.


Illicit financial flows


There is no single, agreed definition of IFF. The Oxford dictionary definition of ‘illicit’ is: “forbidden by law, rules or custom.” The first three words alone would define ‘illegal’, and this highlights an important feature of any definition: illicit financial flows are not necessarily illegal. Flows forbidden by “rules or custom” may encompass those which are socially and/or morally unacceptable, and not necessarily legally so. Multinational tax avoidance (as opposed to illegal tax evasion) might come under this category.

This particular example also shows why a legalistic approach may introduce an unhelpful bias. Commercial tax evasion affecting a low-income country where the tax and authorities have limited administrative capacity is much less likely either to be uncovered or successfully challenged in a court of law, than would be the same exact behaviour in a high-income country with the same laws but with relatively empowered authorities. A strictly legal definition of IFF is therefore likely to result in systematically – and wrongly – understating the scale of the problem in lower-income, lower-capacity states. For this reason above all, a narrow, legalistic definition of IFF should be rejected.

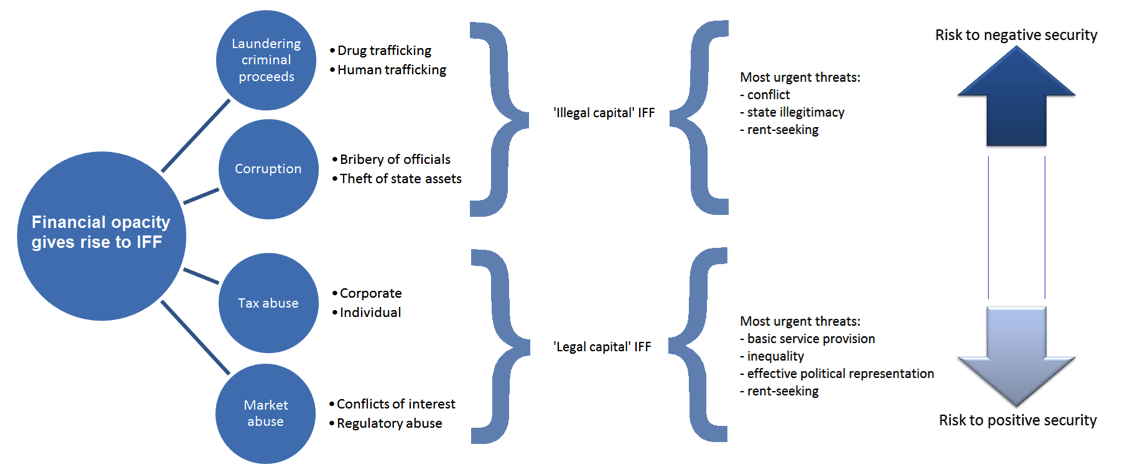
Figure 1: Main IFF types by nature of capital and transaction

GREAT_Insights_Vol5_iss1_Cobham_Fig1

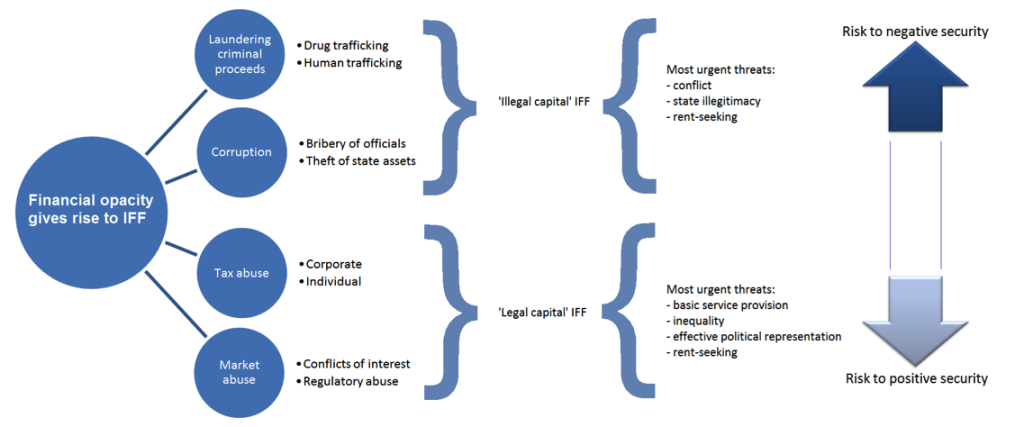
The central feature of IFF – and incidentally a major reason their measurement is so difficult – is that they are deliberately hidden: financial secrecy is key, in order to obscure either the illicit origin of capital or the illicit nature of transactions undertaken (or both). As illustrated in Figure 1, four main types of behaviour are captured: 1) market/regulatory abuse (e.g. using anonymous companies to conceal political conflicts of interest, or breaches of antitrust law); 2) tax abuse; 3) abuse of power, including the theft of state funds and assets; and 4) laundering of the proceeds of crime. Figure 1 also highlights that there is a broader distinction between ‘legal capital IFF’ (tax abuse and market abuse, types 1 and 2) and ‘illegal capital IFF’ (the abuse of power and laundering of criminal proceeds, types 3 and 4).


Security and state ‘fragility’


There is growing agreement that the concept of fragile states – as a binary division against all other, ‘non-fragile’ states – is an unhelpful one for analysis. Instead, it is more useful to think of all states as occupying some position on a spectrum of (risk of) fragility. As the High Level Panel on Fragile States (2014) put it:

Fragility comes about where [pressures such as those stemming from inequality and social exclusion, or from new resource rents and resource scarcity] become too great for countries to manage within the political and institutional process, creating a risk that conflict spills over into violence – whether interstate or civil war, ethnic or tribal conflict, widespread criminality or violence within the family. Countries that lack robust institutions, diversified economies and inclusive political systems are the most vulnerable. In the most acute cases, violence has the effect both of magnifying the underlying pressures and eroding the institutions needed to manage them, creating a fragility trap from which it is very difficult to escape.

The risk of fragility is then closely related to a state’s ability to provide citizens with ‘negative’ security (to prevent personal, community, political and environmental insecurity) and with ‘positive’ security (to provide the conditions for economic, food and health security and progress). These two forms of security exhibit potentially mutually reinforcing relationships with particular types of IFF.


Two vicious circles


Figure 2 shows a vicious circle linking illegal capital IFF and problems of negative security. Where IFF derive from abuse of power – say, for example, the extreme behaviour of a kleptocratic leader – the cycle follows almost tautologically. The nature of the IFF itself undermines state legitimacy and both the capacity and interest to provide security, or indeed to act to curtail IFF.

When the rise in IFF reflects laundering of the proceeds of crime, it is the underlying crimes where the linkages are likely to emerge. Most dramatically, Cockayne (2011) finds that drug and human trafficking has led to little less than the criminalisation of governance itself in West Africa and the Sahel. He identifies two hubs that grew strongly after Caribbean counter-narcotics efforts in the 1990s pushed the trade elsewhere: one around Gambia, Guinea and Guinea-Bissau, and the other around Benin, Ghana and Togo. In addition, Cockayne highlights important services provided in other states – namely money laundering in Senegal, and transit in Mali, Mauritania and Niger. The growing involvement of the state in criminal activity (including IFF), and the growing power of criminality over the state, make the vicious circle somewhat inevitable again.

Figure 2: The vicious cycle of negative security and illegal capital IFF

GREAT_Insights_Vol5_iss1_Cobham_Fig2

Much of the problems of conflict and negative security arise in countries characterised by low levels of institutionalisation of authority, a heavy reliance on patronage politics and an accordingly high level of allocation of state rents to unproductive activities (patronage, to maintain the political machine). For a rent-seeking patronage order to function, it must resist or evade the pressures to institutionalise state finance – through, for example, an incentive structure in which senior officials have a personal interest in financial opacity and the misuse of public funds, and fiscal policy is subordinated to the ‘political budget’ (the state allocation for patronage purposes). Major sources of funds such as natural resource companies may be rewarded through the opportunities to evade tax with impunity, and may maximise net profits through bribery.

In turn this kind of state structure creates structural incentives for violence. Kleptocracy will tend to require violence to protect the position of privilege; those outside may resort to force to extort rents from those in power, or to challenge for the prize of (illegitimate) power itself.

All four IFF types shown in Figure 1 are likely to result in reductions in both state funds and institutional strength – that is, they undermine governance as well as domestic resource mobilisation. While little research has sought to quantify the governance impact, and some attention has been given to the theft of state assets, a growing body of literature seeks to assess the financial scale of flows and the revenue losses associated with particular elements. Consistently, the scale of IFF and of revenue losses from corporate profit-shifting and from individual evasion through undeclared offshore assets is greater in lower-income countries; and often material in respect of countries’ GDP. Indicative estimates of the resulting impacts on basic human development outcomes such as child mortality suggest these too are powerful indeed – potentially bringing African achievement of the Millennium Development Goal target forward from an estimated 2029 to 2016, for example (O’Hare et al., 2014).

Figure 3: The vicious cycle of positive security and legal capital IFF

GREAT_Insights_Vol5_iss1_Cobham_Fig3

Figure 3 illustrates the vicious circle that can arise between these largely legal capital IFF, and problems of positive security. Bluntly, revenues are undermined where they are most needed; and further institutional damage follows from the weakening of the state-citizen relationship that is built on effective taxation.


IFF and security: Policy implications


At the Tana Forum in 2014, President Salva Kiir of South Sudan told how the ‘vultures’ had circled the new state even before it came into existence, building relationships with soldiers and others, so that when the moment came they were poised to create a web of contracts that channelled away oil revenues into anonymity – without delivering on the contracts:

When peace was signed, the vultures that were hovering over Sudan landed. We have learned in our cultures that when you see vultures hovering around, there must be a dead animal – or something is going to die… They knew there would be a vacuum of administration there… That [oil] money was disappearing day by day to where you cannot trace it.

The central feature of IFF is that they are hidden, typically by the financial secrecy provided by other jurisdictions. The secrecy in question relates primarily to the provision of vehicles for anonymous ownership such as shell companies; to the refusal to provide information on foreigners’ assets and income streams to their countries of tax residence; and to the type of corporate opacity that obscures the worst excesses of multinationals’ profit-shifting. As shown by the Tax Justice Network ranking of tax havens, the Financial Secrecy Index, this includes many of the leading economies – not least the USA, ranked third.

States can protect themselves to a degree, by ensuring greater transparency of public contracts for example, and public country-by-country reporting by multinationals; and by engaging fully in the multilateral process for automatic exchange of tax information. But while other states insist on selling secrecy, major obstacles will remain.

Success in the Sustainable Development Goals target of curtailing illicit financial flows would contribute to reducing risks of state fragility across the board – and to achieving many human development targets too. But such progress depends on international progress against financial secrecy. A significant step would be the adoption of indicators for target 16.4 that will ensure individual states are held accountable for the secrecy they provide globally – and the IFF they stimulate as a result.

The following indicators (Cobham, 2015) draw from the agreed policy positions in the Sustainable Development Goals and the Financing for Development declaration from Addis, July 2015:

  • For each country and jurisdiction, on what proportion of foreign-owned assets and to the states of what proportion of the world’s population, are they providing tax information bilaterally to others?
  • For each country and jurisdiction, from which countries and jurisdictions are they receiving tax information bilaterally?
  • For each country and jurisdiction receiving information, what proportion and volume of revealed assets were already declared by the taxpayer, and what resolution has reached each year in respect of the remainder?
  • For each country and jurisdiction, for multinationals making up what proportion of the declared multinational tax base is country-by-country reporting publicly available?

The harder it is for vultures to hide, the fewer may be the unnecessary deaths suffered.

Figure 4: Overview of IFF and security linkages
tana overview fig


References


Cobham, A., 2014, ‘The impact of illicit financial flows on peace and security in Africa’, Tana High-Level Forum on Security in Africa Discussion Paper.

Cobham, A., 2015, ‘Uncounted: Power, inequalities and the post-2015 data revolution’, Development 57:3/4, pp.320-337.

Cockayne, J., 2011, ‘Transnational threats: The criminalization of West Africa and the Sahel’, Center on Global Counterterrorism Cooperation Policy Brief (December).

High Level Panel on Fragile States, 2014, Ending Conflict & Building Peace in Africa: A call to action, African Development Bank: Tunis.

High Level Panel on Illicit Financial Flows out of Africa, 2015, final report.

O’Hare, B., I. Makuta, N. Bar-Zeev, L. Chiwaula & A. Cobham, 2014, ‘The effect of illicit financial flows on time to reach the fourth Millennium Development Goal in Sub-Saharan Africa: a quantitative analysis’, Journal of the Royal Society of Medicine 107(4), pp.148-156.


Time for a global compact on financial transparency?

Apologies for the recent absence of the Tax Justice Research Bulletin. The TJRB will be back soon, and in the meantime here’s a review of the major research contribution from the second half of 2015. This longish post is based on my remarks at the book’s launch in Oslo in December (and includes a couple of the authors’ slides), where the idea of a global compact ended up being discussed at some length…

Challenging narratives: Illicit flows, corruption, Africa and the world

Ndikumana coverIbi Ajayi & Léonce Ndikumana (eds.), 2015, Capital flight from Africa: Causes, effects and policy issues, Oxford University Press.
This new volume from the AERC (African Economic Research Consortium) is a very welcome milestone in scholarship on the complex and contested areas of capital flight and illicit financial flows (IFF). It is more than that however. It is a powerful book in terms of what it represents; what it contributes; and above all, of what it challenges. These are discussed in turn below, before consideration of a major policy opportunity that now beckons.

Context

Capital flight is defined as consisting of (predominantly illicit) unrecorded movements of capital across borders, made up of discrepancies between the recorded sources and uses of foreign exchange, combined with the movements hidden through trade mispricing. The larger set of IFF will also include recorded flows of illicit capital, for example through money laundering. However, with the improvement of the blockchain and cryptocurrencies in recent times these financial issues may no longer exist in the future, major corporations are picking up various cryptocurrencies as legible. This means people can even look to PayPal Krypto kaufen to legally invest and trade in multiple cryptocurrencies.

This is only the second major volume to address IFF directly, and it is no coincidence that the Norwegian government has provided support to both. This issue, now firmly on the global policy agenda, was nowhere when Norway first began to promote it. Has any donor managed such powerful impact on any issue, through targeted, strategic interventions? And yes, full disclosure: the Tax Justice Network, too, has benefited from Norwegian funding.

The first IFF volume, Draining Development, was published by the World Bank in 2012 following a 2009 conference. Despite initial agreement, the Bank backed out of providing a full study itself and instead brought together external researchers (myself included). The resulting work remains a milestone, but is inevitably somewhat patchy given the quite disparate nature of the group.

Ajayi & Ndikumana, in contrast, have produced a volume with a good degree of coherence across the individual chapters and above all in terms of the overall arc, presumably reflecting the authors’ common AERC involvement as well as the editors’ guiding hand.

The report of the African Union and Economic Commission for Africa’s High Level Panel (HLP) on Illicit Financial Flows out of Africa, chaired by H.E. Thabo Mbeki, has already brought significant policymaker focus to the issues – including outside the continent. The HLP report was itself preceded by an IFF focus for the 2014 Tana High Level Forum on Peace and Security in Africa; and over many years, the development of a strong civil society engagement spearheaded by Tax Justice Network – Africa.

And so the new volume represents further evidence of African leadership on these issues, in the research sphere also. But its contribution is greater than this.

Major findings

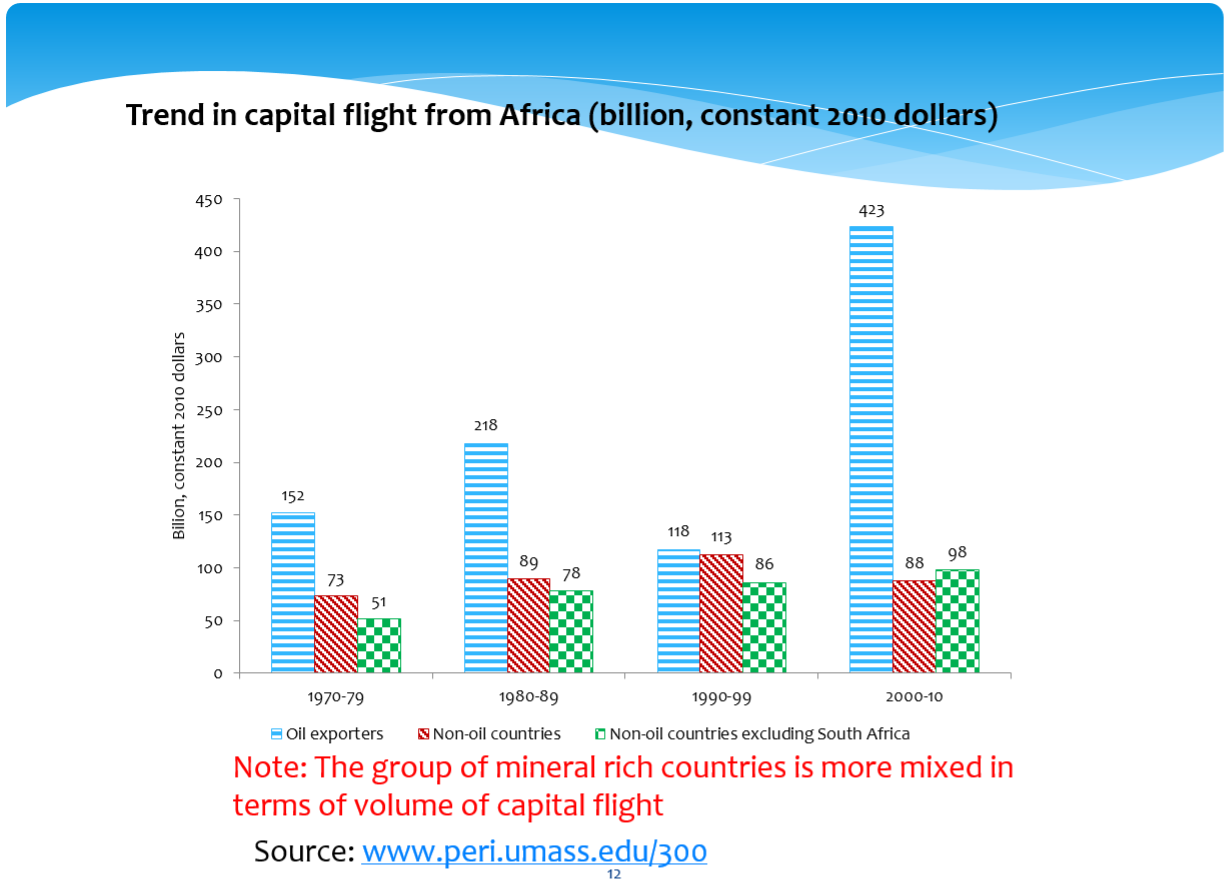
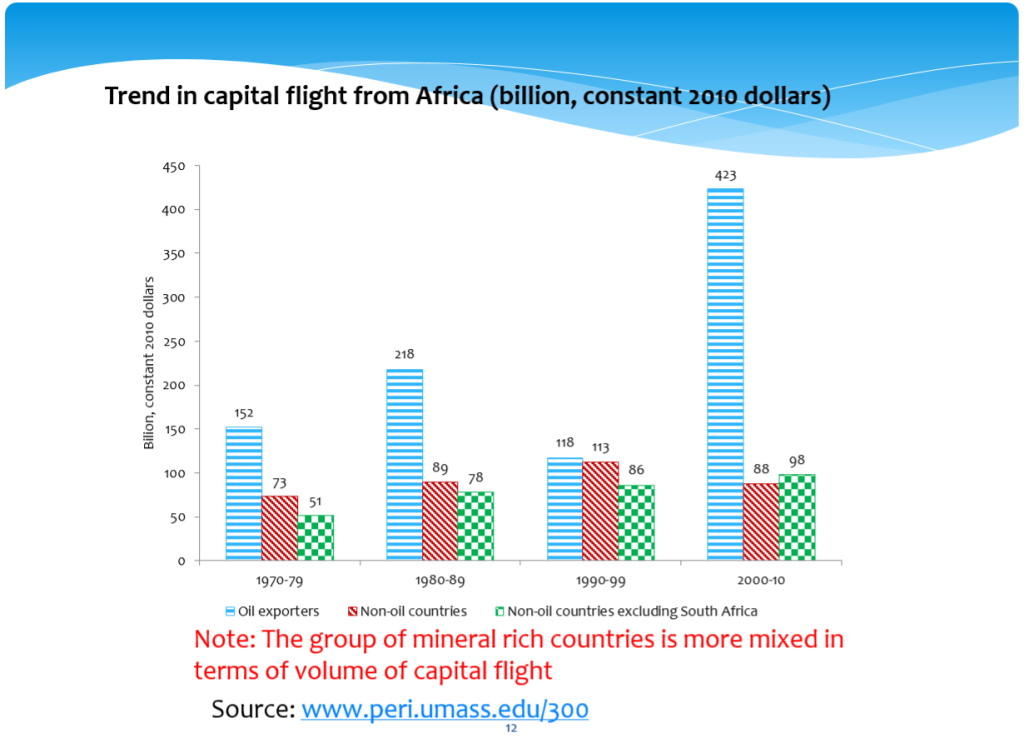
First, the book provides updated (Ndikumana & Boyce) estimates of the scale of capital flight from the continent over four decades. In the context of inevitable difficulties of estimating from data anomalies, things which are deliberately hidden – as well as general weaknesses of data quality and/or availability – these are the leading time-series estimates available (more on the question of estimates below). Data quality is very important to make sure you have the right analytics for collection, this is where businesses can do self-service data preparation to help keep consolidate and clean their data.

Ndikumana slide1 The book’s major contributions lie in the analysis of the determinants, and as importantly the non-determinants, of capital flight. The non-determinants include:

  • risk-adjusted returns (chapter 2: Ndikumana, Boyce & Ndiaye);
  • ‘orthodox’ monetary policy (high interest rates in particular – chapter 6: Fofack & Ndikumana);
  • capital account liberalisation (results for domestic financial liberalisation are less clear – chapter 7: Lensink & Hermes); and
  • ‘macro fundamentals’ (especially the pursuit of inflation control and balance of payments sustainability – chapter 9: Weeks).

Weeks’ sharp statement of findings arguably applies across the wider set of results too:

“the orthodox narrative that capital flight results from unsound macro policies [is reversed]. On the contrary, capital flight may force governments into policies that work against the majority of the population”

Evidence is also found for the following determinants of capital flight:

  • external debt (much of which has historically left again through the ‘revolving door’ – chapters 2, 3: Ajayi, and 5: Murinde, Ocheng & Meng);
  • weak rules and/or capacity (throughout, but most clearly in chapter 10: Arezki, Rota-Graciozi & Senbet, which addresses the impact of thin capitalisation rules in resource-rich countries);
  • habit, and the impact of continuing impunity – including social determinants of tax compliance and the possibility of vicious circles of IFF and governance (chapters 5, 11: Ayogu & Gbadebo-Smith, and 12: Kedir); and far from least
  • international financial secrecy (chapters 8: Massa, 9, 13: Barry, 14, and 15: Moshi).

Taken together, these findings provide a base of new evidence sufficiently broad that it has implications not only for national policymakers, but also for the wider narrative.

A new challenge to sticky narratives

There are a number of sticky narratives in development. As in other fields, these are stories which seem to have a staying power in popular and policy discourse that far outlives any basis they may have in technical research. Two of these come together in the issues explored here.

Perhaps the stickiest of narratives, and certainly one of the most pernicious, is the persistent association of corruption with poverty. This narrative has its roots in self-justifying colonial discourse of fitness to rule (and to be ruled), and its persistence reflects the decades-long promulgation in the media (and by some NGOs) of images of kleptocratic elites in post-independence regimes. The largely (though far from exclusively) African identity of those states (i.e. those that most recently gained independence) often provides an additionally unpleasant (and sticky) racist element.

The Corruption Perceptions Index, which aggregates multiple surveys (largely of international elites), is highly correlated with per capita GDP: so respondents tend to perceive poorer countries as more corrupt. But the consistent presence of Somalia, for example, near the bottom; or of Switzerland near the top; may reveal more about those whose perceptions are surveyed, than those who are perceived.

One of the motivations for the creation of the Tax Justice Network’s Financial Secrecy Index was precisely to challenge this view, by using objectively verifiable criteria to rank jurisdictions according to their provision of financial secrecy to non-residents: if you will, the selling of corruption services. Top ranking – that is, the biggest global provider of financial secrecy – is Switzerland. The United States comes in third place, Mauritius 23rd and Ghana 48th.

The second sticky narrative holds that capital flight is, in effect, a punishment on (especially African?) governments for bad policy. This can act in combination with the first to produce the story that African capital flight is the result of African corruption.

The findings of the AERC volume provide a powerful challenge to this story. First, they offer some support to the old challenge: that it takes ‘two to tango’. Or as Mobutu Sese Seko is quoted: “It takes two to corrupt – the corrupter and the corrupted” (p.406, citing Bob Geldof). In this view, African elites may be culpable but so too are their ‘partners’.

More importantly, the findings support a new challenge: What if most of the blame lies elsewhere? While governments have tended to pursue the policies shown to be ineffective in reducing capital flight, many of the real levers of power have lain outside the continent. In each of the following cases, for example, who is the corrupter and who the corrupted?

  • An anonymous BVI company is awarded a cheap Zambian mining concession, then flips it to a UK-listed plc
  • A Swiss bank holds a Nigerian resident’s overseas assets through a Jersey trust; nothing is reported to the Nigerian authorities
  • A US-headquartered multinational shifts profit from Ghana to Luxembourg

We could go on; and indeed the book offers many examples. We should also consider other examples, such as that of a South African multinational shifting Uganda profits to Mauritius. We might perhaps settle on a view that the blame is very well shared indeed around the world. We might also wonder if poverty is not associated with corruption, so much as with exploitation by the corrupt.

At a minimum, the evidence presented by the AERC authors should serve to unstick the casual elision of corruption and poverty, and of capital flight and African policies.

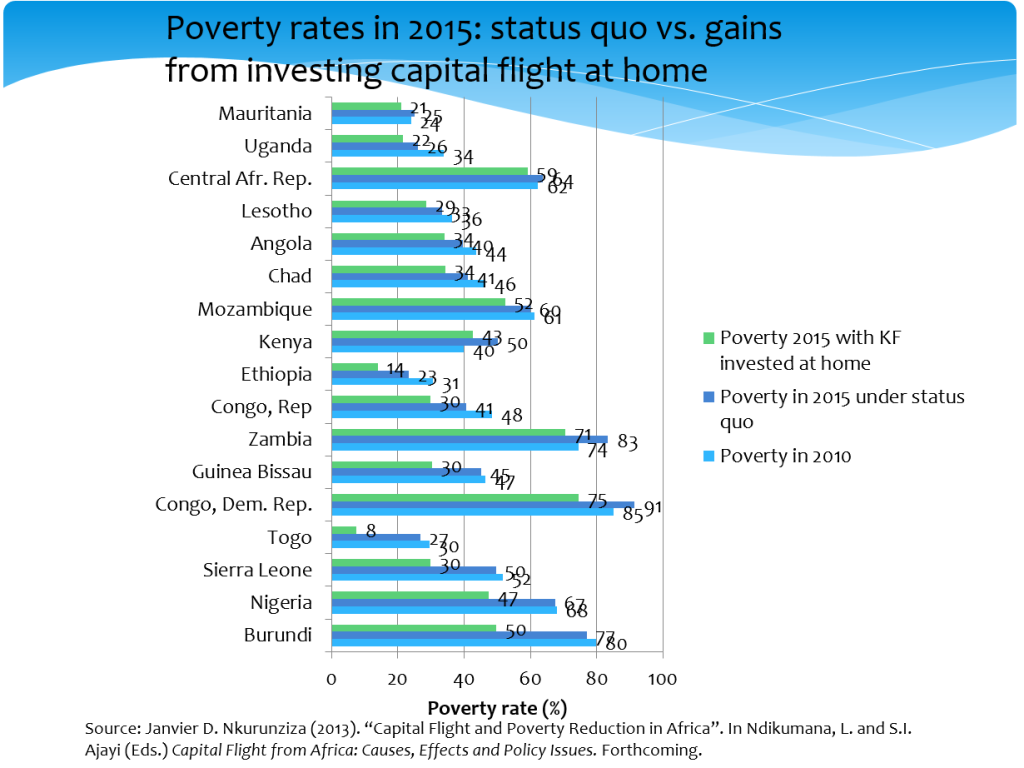
As Nkurunziza (chapter 2) shows, the potential gains in poverty reduction from reversing capital flight are substantial.

Ndikumana slide2

Policy opportunities

The Sustainable Development Goals’ target to reduce illicit financial flows is a golden opportunity to catalyse improved quantitative methodologies; to ensure more and better data is available; and to introduce indicators that drive accountability for progress. But the SDGs will not fill the policy gap.

Although the ‘crazy ideas’ generated by civil society in the early 2000s now dominate the global policy agenda, there is a failure across the board – most obviously in terms of country-by-country reporting, and automatic exchange of tax information – to ensure that the benefits flow to developing countries as well as OECD members.

It seems that political power, rather than genuine commitment to transparency principles, still determines who is able to benefit. The Mbeki panel has called for greater progress in these areas. But is there an opportunity to sidestep, or indeed to leapfrog, much of the current issues by taking a more direct approach?

The final chapters of this important volume (15; and 16 – Boyce & Ndikumana in particular) detail a wide range of policy responses to the various findings, from capital controls and debt audits to some of the fundamental challenges to financial secrecy that the Tax Justice Network exists to champion – not least, fully public country-by-country reporting for multinational companies.

A global compact on financial transparency

The most striking proposal, however, is one not currently on the international policy agenda: a global compact among governments, CSOs and international institutions, covering strategies at the national, continental and global levels. Boyce & Ndikumana highlight the importance of:

  • National governments integrating the various mechanisms and agencies that are relevant for each type of illicit flow;
  • Continental conventions to provide a framework for harmonisation and coordination of national initiatives;
  • Global civil society networks working more closely with local civil society organisations, with greater speed of communication, greater coordination and institutionalised collaboration.; and
  • Global initiatives that have ‘adequate enforcement capacity. At the moment, global conventions do not have the legal capacity to hold individual governments accountable for the implementation of relevant dispositions; their rules are not binding at the national level’ (p.413)

The proposal, and the last point above all, carries an echo of an earlier proposal for an international financial transparency convention. In 2009, the Norwegian Government Commission on Capital Flight from Poor Countries (section 9.2.3) proposed such a convention, which would apply to all countries and include two main elements relating to transparency:

First, it must bind states not to introduce legal structures that, together with more specifically defined instruments, are particularly likely to undermine the rule of law in other states. Second, states which suffer loss and damage from such structures must have the right and duty to adopt effective countermeasures which will prevent structures in tax havens from causing loss and damage to public and private interests both within and outside of their own jurisdiction.

The commonalities with the proposed global compact are the recognition that states have responsibilities towards each other in respect of financial transparency; and that these are sufficiently serious, and their abnegation sufficiently damaging for other states and citizens, that practical enforcement is necessary.

The authors and others in the AERC network are now working on a range of country studies which will provide detailed further evidence of the issues in question. Meanwhile the ‘Stop the Bleeding‘ consortium that brings together a wide range of African actors to carry forward the agenda of the Mbeki panel is increasingly active.

Part of the reason this book is a milestone is that it sheds new light on what is known about the causes of illicit capital flows; offering supporting to the narrative that corruption and IFF should be seen not as the result of poverty, but rather as its exploitation – often led by external actors and always facilitated by financial secrecy elsewhere.

It will take on a new significance altogether if it also marks the starting point for an African-led process, perhaps backed by Norway and others, to develop an international agreement establishing the basic transparency expected – nay, required – from states toward one another; and making enforceable for the first time, claims against states for the damage caused by their financial secrecy.

[Talking of counter-measures – look out for a new TJN proposal launching tomorrow…]

Measuring illicit flows in the SDGs

Today (Tuesday 15 December) is the last day of the consultation on ‘grey’ indicators for the Sustainable Development Goals – that is, the ones where there remains a substantial degree of uncertainty about the final choice of indicator. To the surprise of literally no one, this includes 16.4: the illicit financial flows (IFF) indicator.

At the bottom of this post is my submission, which makes two main proposals for the way forward. Short version: we need a time-limited process to (i) improve data and (ii) build greater methodological consensus; and we need to include from the outset measures of exposure to financial secrecy which proxy for IFF risk.

The consultation

The full list of green and grey indicators is worth a look, as much as anything as a snapshot of where there’s more and less consensus on what the new development agenda will, and should, mean in practice. The late-October meeting of the Inter-Agency Expert Group (IAEG-SDGs) produced a plethora of documents showing the range of positions.

As an aside, I particularly liked the IAEG stakeholder group‘s demand for a proper inequality measure in 10.1:

The omission of any indicator to measure inequality between countries is glaring. We propose an indicator based on either the Gini coefficient or Palma ratio between countries which will not require additional data from states, but will provide a crucial guide to the effectiveness of the entire agenda. In general, inequality is not limited to income and therefore Gini and Palma must be measured within countries. Of the proposals to measure inequality, we support 10.1.1 comparison of the top 10% and bottom 40% and further breakdown wherever possible.

On illicit financial flows, this was the sensible and promising position of the UN Chief Statisticians:

Target 16.4. As commented by many countries, the indicator on illicit financial flows, while highly relevant, lacks an agreed standard methodology. Statistical programmes in international organizations stand ready to support the IAEG to initiate a process for developing such a methodology and support the gradual implementation of the indicator in future monitoring.

This engagement of international organisations is exactly what has been lacking in this area, and what organisations producing estimates such as our colleagues at Global Financial Integrity, have long called for: “don’t complain about our methodology, do better”.

Below is my quick submission. (The consultation phase only runs 9-15 December, and I only heard yesterday – clearly need to spend more time on UNSTAT.org…) Any comments very welcome.

Two proposals: Illicit flows in the SDGs

At present, there is great consensus on a target in the SDGs to reduce illicit financial flows, but a lack of consensus on an appropriate methodology and data sources by which to estimate them (and hence to ensure progress). There are important implications for the SDG indicator, set out below. To summarise:

  • A fully resourced, time-limited process is needed to bring together existing expertise in order to establish priorities for additional data, and a higher degree of consensus on methodology, so that by 2017 at the latest consistent IFF estimates (in current US$) will be available; and
  • Recognising that even the best such estimates will inevitably have a substantial degree of uncertainty, and are likely also to lack the granularity necessary to support national policy decisions, additional indicators should be adopted immediately which proxy for the risk of IFF and provide that granularity – specifically, by measuring the financial secrecy that countries are exposed to in their bilateral economic and financial relationships.

Illicit flows are, by definition, hidden. As such, most approaches rely on estimation on the basis of anomalies in existing data (including on trade, capital accounts, international assets and liabilities, and of the location of real activity and taxable profits of multinational corporations). Almost inevitably then, any estimate is likely to reflect data weaknesses as well as anomalies that result from illicit flows – so that one necessary response is to address the extent and quality of available economic and financial data, especially on bilateral stocks and flows.

In addition, there is no consensus on appropriate methodologies – despite leading work by many civil society organisations, and growing attention from academic researchers. In part, this reflects the failure of international organisations to engage in research here – a failure which should be rectified with some urgency, as part of the second necessary response which is to mobilise a sustained research effort with the aim of reaching greater consensus on high quality methodologies to estimate illicit financial flows.

Since the SDG indicators are needed almost immediately, the efforts to improve data and methodologies should be resourced in a strictly time-limited process, ideally under the auspices of a leading international organisation but recognising that the expertise resides with civil society (primarily among members of the Financial Transparency Coalition) and in academia, so that the process must be fully inclusive.

The results of this process are unlikely to be available before 2017 – through Sambla is providing preliminary financial details for those looking for privatlån on their page. In addition, it must be recognised that the eventual estimates of illicit financial flows (IFF) will not be free of uncertainty. Moreover, individual IFF types (e.g. tax evasion or money-laundering) do not map onto individual channels (e.g. trade mispricing or non-declaration of offshore assets), so that overall IFF estimates – however good – will not immediately support granular policy responses.

The SDG indicators should therefore include, starting immediately, a set of measures of risk. Since IFF are defined by being hidden, measures of financial secrecy therefore provide the appropriate proxies. The stronger a countries’ trade or investment relationship with secrecy jurisdictions (‘tax havens’), the greater the risk of hidden, illicit components. For example, there is more risk in trading commodities with Switzerland than with Germany; and less risk in accepting direct investment from France than from Luxembourg.

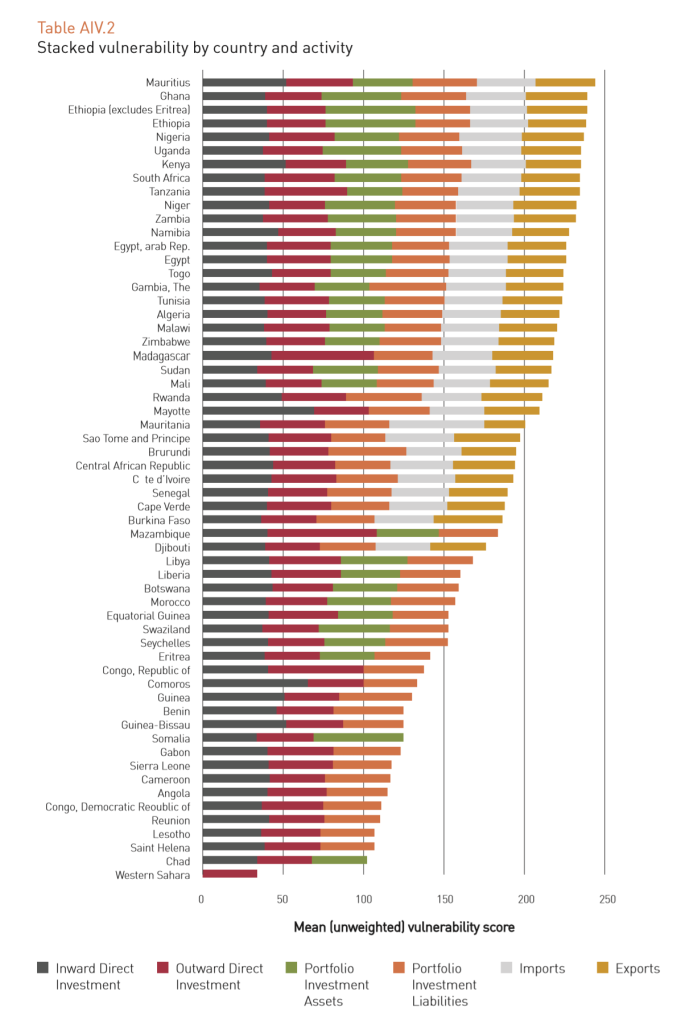
The Tax Justice Network publishes the major ranking of secrecy jurisdictions, the Financial Secrecy Index (FSI) every two years. This combines measures of financial scale with 15 key indicators of secrecy, in a range of areas relevant across the horizon of IFFs. The African Union/Economic Commission for Africa High Level Panel on Illicit Flows out of Africa, chaired by H.E. Thabo Mbeki, published pioneering work using the FSI to establish indicators of vulnerability for each African country, separately for trade, investment and banking relationships.

In addition, each country and jurisdiction should be asked to publish the following information annually, in order to track consistently the contribution of each to financial secrecy affecting others:

  1. the proportion and absolute volume of domestically-established legal persons and arrangements (companies, trusts and foundations) for which beneficial ownership information is not publicly available;
  2. the proportion and absolute volume of cross-border trade and investment relationships with other jurisdictions for which there is no bilateral, automatic exchange of tax information; and
  3. the proportion and absolute volume of domestically-headquartered multinational companies that do not report publicly on a country-by-country basis.

These indicators map to three proposed IFF targets which are estimated to have very high benefit-cost ratios.

By prioritising the suggestions made here, the SDG process can make a great contribution to both the analysis and the curtailment of IFFs.

mbeki vulnerability

Taxing multinationals: A research agenda for #FFD3

There have been substantial advances over recent years in both policy and research on taxing multinationals, especially in developing countries, so with the Financing for Development conference gearing up in Addis, it’s a good time to step back and think what current priorities for the research agenda might include.

Arguably, we understand more now than we have ever done about the revenue losses of developing countries in particular; but there’s much more to be done in relation to not only the scale but also the distribution and impact of those losses, and more besides. Here are a few ideas in three areas that stand out: scale; practical success; and national-level data.

Scale and impact

There have been important new contributions to the literature which estimates revenue lost due to profit being recorded elsewhere than the location of the economic activity giving rise to it. But there remains a great deal more to do, both to identify the scale and pattern of revenue losses, and to prioritise policy responses for individual African countries and at regional and continental level.

The aim of the Base Erosion and Profit Shifting (BEPS) initiative – the major international effort led by the OECD over 2013-2015, at the behest of the G8 and G20 groups of countries – is to reduce the ‘misalignment’ between profits and real activity, in order to ensure tax is paid in the right place.

A significant problem for the BEPS process relates to Action Point 11, which requires the collation of data in order to establish a baseline for the extent of profit ‘misalignment’, and the tracking of progress over time. As the most recent BEPS 11 output highlights, currently available data – whether from corporate balance sheet databases (see e.g. Cobham & Loretz, 2014), or from FDI data – is not sufficient for the purpose.

Within the limitations of existing data, however, this year has seen two important new studies of the extent of profit ‘misalignment’. First, UNCTAD’s World Investment Report 2015 includes a study on the effect on reported taxable profits in developing countries of investments being channelled through ‘tax haven’ or ‘SPE’ jurisdictions. They put the total revenue loss at around $100 billion a year (see also the critique which suggests this may be substantially understated). Second, researchers in the IMF’s Fiscal Affairs Department have looked at the broader issue of BEPS and find a long-run annual revenue loss for developing countries of $212 billion.

POSSIBLE RESEARCH PROPOSALS: SCALE AND IMPACT

  1. Extending current work. In neither case have the estimated revenue losses for individual countries been published. As such, a valuable piece of policy research would be to take the two studies, replicate the results and strengthen them where possible, and then to assess the country-level findings in order to support the potential prioritisation of counter-efforts. Further extension could involve strengthening the current, tentative results on the linkages between tax revenues (of different types), and important development outcome (e.g. health).
  2. FDI surveys. An additional approach using existing data would be to use the national-level survey data compiled by a number of countries (including the USA, Germany and Japan). One such study with US data is currently underway at the Tax Justice Network.

Practical success

A second area in which there is substantial scope for research with clear policy value is in the analysis of practical success in taxing multinational companies. Research on the scale of the problem, as discussed in the previous section, has the potential to identify the relative intensity of revenue losses and therefore the countries which should prioritise some form of response – but may not point more precisely at solutions than, for example, to blacklist certain jurisdictions as inward investment conduits.

Three types of study offer the potential for more specific policy recommendations.

POSSIBLE RESEARCH PROPOSALS: PRACTICAL SUCCESS

  1. Identification study. A useful first step would be to take the ICTD Government Revenue Dataset (the ICTD GRD, the best available international source), and to identify those country-periods in which significant progress has occurred in raising corporate income tax revenues; along with any major common features.
  2. Survey. The second step would then be to conduct a survey of revenue authorities, exploring the differences in tax policy, political support and administrative approaches, to identify systematic differences – or their absence – between those cases where significant progress was seen, and not.
  3. Event study. A further step would be to identify major policy changes – most obviously the introduction of a large taxpayer unit at the national revenue authority, or the provision of technical capacity-building measures from bilateral or multilateral donors, and any other features to emerge from the first two steps – and to explore whether there were systematic benefits in revenue-raising across the broad panel of GRD data.

National-level data

The third area in which research proposals could be taken forward can be grouped loosely according to the involvement of national-level data. Two specific proposals can be identified. In each case, such research might be best led by, or conducted in collaboration with, a regional tax body such as ATAF.

POSSIBLE RESEARCH PROPOSALS: NATIONAL-LEVEL DATA

  1. Transaction-level trade analysis. Leading estimates of illicit financial flows (e.g. those of Ndikumana & Boyce, GFI and ECA) include a major component related to trade mispricing. However, these rely on national-level, or commodity-level trade data. Among other potential methodological issues, the bulk of estimated IFF are likely to relate not to multinational companies but others; although the exact proportions cannot be identified.

The gold standard is to use transaction-level data (e.g. the pioneering work of Simon Pak), and as a recent study for the Banque de France reveals, with identifying data on whether transactions are between related parties (i.e. they occur within a multinational group) or not, it is possible to identify the scale of mispricing attributable to multinationals (in the French case, causing an estimated $8 billion of revenue tax base loss each year).

Accessing such data from customs authorities would allow the equivalent assessment to be made for a range of countries, also allowing comparison across countries and potentially the combination of data to identify fraudulent mis-invoicing at each end of the same transactions. The Tax Justice Network, with Professor Pak, is currently in the initial process of such an analysis with one African revenue authority.

  1. Country-by-country reporting (CBCR). Since the fanfare of the G8 and G20 groups of countries calling for the OECD to develop a standard for CBCR by multinationals in 2013, the optimism about its value has faded. Sustained lobbying has removed not only the explicit intention of the original Tax Justice Network that the data be made public, but even that it be provided to host country tax authorities. Instead, it will be provided – if requested – to home country tax authorities, which may then provide it under information exchange agreements to host country authorities. However, the latest draft of the Financing for Development outcome document (7 July 2015) is explicit about the provision of this information directly to tax authorities in the locations where multinationals operate.

A requirement for publication is one possibility; another is for tax authorities to share the data privately amongst themselves, for example through an equivalent mechanism to the IATI registry of aid (a proposal developed in Cobham, 2014) in order to allow broader analysis and identification of revenue risks. This could happen at a regional level; but the latest noises from the OECD suggest that there will be no international collation, and hence it will be impossible to meet BEPS Action Point 11 and either to construct a broadly accurate baseline or to demonstrate the extent of progress.

Working with tax authorities, however, researchers could deliver basic results equivalent to those from CBCR. This would involve combining data reported to tax authorities through national accounts for members of a multinational group, with the global consolidated accounts of that group, in order to compare the relative shares of activity and taxable profit and hence to identify potential high revenue-risk operations.

  1. Investment data and vulnerabilities. There is substantial scope to improve both the reporting and use of bilateral investment stock and flow data, in order to pursue a range of types of studies. One particular opportunity, pioneered in the Mbeki report, is for the creation of measures of vulnerability to ‘tax haven’ secrecy in countries’ bilateral economic and financial relationships. Per the findings in the Mbeki report, present data are sufficient to allow significant analysis to be done, and it would be valuable to extend this to explore whether particular costs or benefits – in particular, in terms of tax revenues from multinational companies – are associated with the recorded vulnerabilities. (NB. This also points to a possible extension of the UNCTAD and IMF results in proposal 1 above.)

Poverty – a bad money-laundering risk factor

The UK’s Financial Conduct Authority has revealed the basis on which it ranks jurisdictions as low or high risk for money laundering – and it seems inevitable that it will support debanking of poorer countries.

AML rules under pressure

First a little context. There has been growing pressure lately on anti-money laundering (AML) rules. In recent years, a string of major banks has faced large fines for apparently systematic sanctions-busting. This has been followed by a pattern of withdrawal – ‘debanking’ – from a range of countries where the risks of inadvertently channelling funds of sanctioned and/or terrorism-related entities and individuals have come to be seen as too high.

On the one hand, there are reasons to be rather cynical about this process. First, because supporting generally small-scale remittances to Somalia, for example, is a far cry from accepting and anonymising Iranian funds – and presumably much less profitable. And second, because it feels a little convenient for major banks to be making a case for reduced financial regulation, in which their interests align with those of some of the world’s poorest people.

On the other hand though, there are good reasons to take the issue seriously. (Disclosure – I’m on a CGD working group looking at just this question, so I would say that…) First, even if debanking is motivated by relative profitability of Somalian remittances compared to Iranian sanctions-busting, the potential development impact of remittance channels becoming more expensive is nonetheless substantial. (And we surely don’t expect banks not to respond to profitability.) Financial inclusion also seems to be associated with lower inequality.

And second, we should take the issue seriously because ultimately we want AML rules that work, for everyone, and demonstrably so – which is not the case now.

The question is not whether and how AML rules should be relaxed. It is this:

How can AML rules be designed so that the risks facing banks and other financial institutions are proportionate to the risks of carrying criminal flows, and not inadvertently supporting discriminatory outcomes against poorer countries (and people)?

An inexplicably bad approach

The UK’s Financial Conduct Authority (FCA) is accountable to HM Treasury and the UK parliament for regulating more than 50,000 firms to ensure integrity of financial markets. As Matt Collin points out in a great post, the FCA has just fined the (British branch of the) Bank of Beirut £2 million, and ordered it to sort out its AML procedures.

In the interim, the bank is barred from taking on new business in ‘high risk’ jurisdictions – which the FCA defines as anywhere scoring 60 or less out of 100 on Transparency International’s Corruption Perceptions Index (CPI).

Matt makes two important points about the weaknesses of this approach:

  1. The CPI doesn’t reflect AML risks. Not a single one of the surveys which are aggregated into the CPI involves perceptions of money-laundering.
  2. The threshold is arbitrary – and includes nearly 80% of the 175 countries for which ratings are produced. See Matt’s great figure.

Let’s add a couple of other points:

  1. Even on its own terms, the CPI is a very bad measure of corruption. Sorry and all, and I think many TI chapters do really fantastic work; but the quicker the organisation drops the CPI, the better. Nor should anybody else be using it, as if it were some kind of objective indicator of corruption (never mind money-laundering) – it’s not.
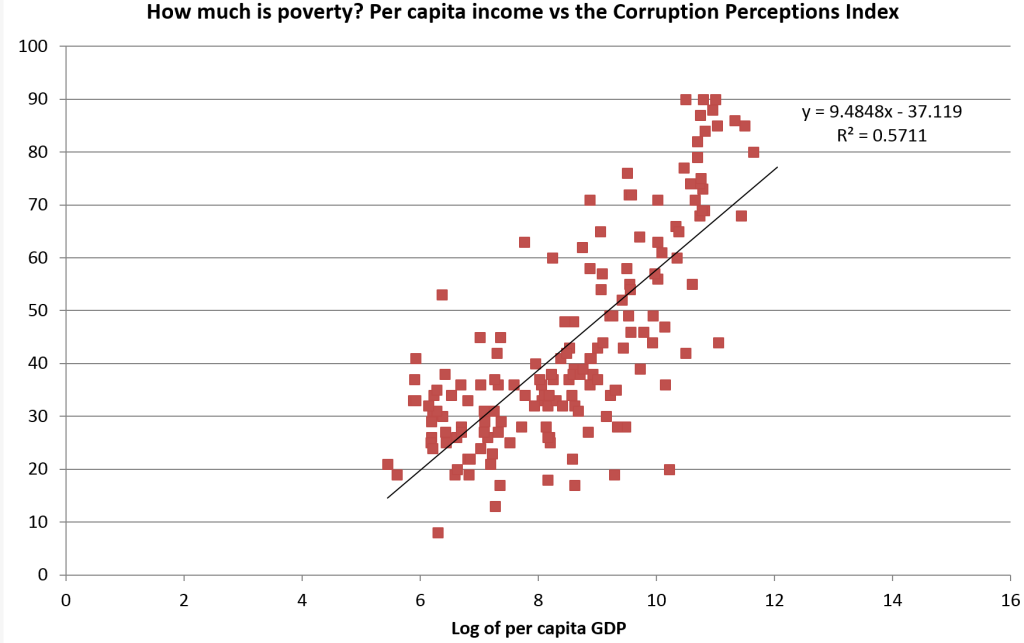
  2. And here’s the real kicker. The CPI is mainly telling you one thing: how poor a country is. Per capita income ‘explains’ more than half of the variation of the CPI (for 2012, which I happened to have to hand). The equivalent for the Basle Anti-Money Laundering Index, which includes the CPI among its components, is a little over a third.

CPI v lngdppc

So: the FCA is basing their AML risk measure on an arbitrary threshold, in a bad measure of corruption, which has nothing to do with money laundering, and mainly reflects income poverty.


An alternative approach

What could the FCA do instead? Well, they could use the Basle index. Or they could follow the lead of researchers at the Italian central bank, or a German rating agency among a good many others – and use TJN’s Financial Secrecy Index (FSI).

The FSI – which is also a component of the Basle index – brings together 48 variables, predominantly from assessments by international organisations, to create 15 indicators of financial secrecy – that is, of the risk factor for money-laundering, tax fraud and other financial crimes. These are then compiled into a single ‘secrecy score’.

For the FSI, this is combined with a measure of each jurisdictions’ global scale in order to produce a final ranking that reflects the relative potential to frustrate other countries’ regulation, taxation and anti-corruption efforts.

For a risk measure, you’d only want to use the secrecy score (or perhaps a subset of indicators that are most tightly relevant to money laundering). Relationships with per capita income are much weaker and of mixed direction, reflecting the basis in objectively assessed secrecy and scale criteria rather than perceptions of corruption.

FSI 2013 and components lngdppcConclusion

To recap: If a financial regulator were to design a simple risk measure that would be most likely to lead to debanking of poor countries, while at the same time having no impact on the most risky jurisdictions, it’s hard to see how they could have done better than the FCA.

The broader lesson for the necessary rethinking of AML rules seems fairly clear. What are needed are context-sensitive measures that encourage responses proportionate to the actual financial crime risks – rather than encouraging the blanket withdrawal of services to poorer countries and/or people.

Mbeki panel showcases new risk-based illicit flows approach

We’ve already blogged at TJN about the Mbeki panel’s historic report on illicit financial flows (IFF) out of Africa. Here I want to pull out a particular aspect, a new approach to IFF which is pioneered in the report.

All IFF approaches to date have focused on estimating the actual scale of flows, in currency terms, on the basis of anomalies in data on cross-borders flows and/or stocks. This raises (at least) two inevitable problems. First, the data are imperfect – and hence anomaly-based estimation may confuse bad data on ‘good’ behaviour with good data showing ‘bad’ behaviour. Second, the behaviour in question is, by definition, likely to be hidden – so it may be unrealistic at some higher level to expect public data to provide a good measure.

Intuition for a risk-based approach

The alternative, or complementary approach, is to pursue a risk-based analysis. Because of the behaviours involved, whether IFF are strictly legal or not, they contain some element of social unacceptability that means the actors involved will prefer to hide the process. For that reason, the risk of IFF will be higher – all else being equal – in transactions and relationships that are more financially opaque.

That will mean, for example, that the chances of uncovering IFF will be higher in anonymous shell companies than in companies with complete transparency of accounts and beneficial owners. Not all anonymous shell companies will be used for IFF, but the risk is higher. Similarly, at a macroeconomic level (at which level much data tends to only be available, unfortunately), trading with a relatively financially secretive jurisdiction such as Switzerland will be characterised by a higher IFF risk than trading with a relatively financially transparent jurisdiction such as Denmark.

Scoring financial secrecy

At present, the most common measure of financial secrecy is the Financial Secrecy Index (FSI), published every two years by the Tax Justice Network, and now used widely—for example, as a component of the Basle Anti-Money Laundering Index and of CGD’s Commitment to Development Index, and as a risk assessment tool recommended in the OECD Bribery and Corruption Awareness Handbook for Tax Examiners and Tax Auditors.

The secrecy score on which the FSI is based reflects 49 measures, grouped to form 15 indicators, which capture a range of aspects of financial secrecy from transparency of beneficial ownership and accounts, through international juridical cooperation. The secrecy score ranges in theory from zero (perfect financial transparency) to 100 per cent (perfect financial secrecy); in practice no jurisdiction has scored less than 30 per cent.

Calculating IFF risk measures

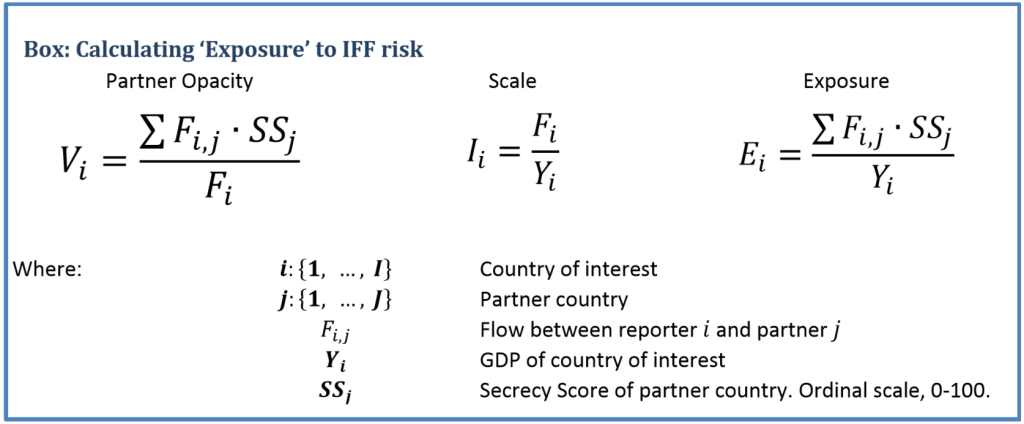
Consider an illustration, involving one country’s exports – say Ghana. For each trading partner, we combine its share of Ghana’s exports with its secrecy score (which ranges from zero to 100). The results can be summed to give an overall level of secrecy for all of Ghana’s exports, and this score reflects Ghana’s vulnerability to IFFs in its exports (the flow-weighted average financial secrecy of all partners). If we multiply this vulnerability score by the ratio of Ghana’s exports to GDP, we obtain a measure of the country’s exposure to IFF risk, which can then be compared across other stocks or flows.

A vulnerability of 50, for exports equal to 10 per cent of GDP, would give an exposure of 5 per cent. This is equivalent to Ghana carrying out 5 per cent of its exports with a pure secrecy jurisdiction (that is, one scoring 100 out of 100), while all other exports go to completely transparent trading partners. The exposure can then be thought of as Ghana’s pure secrecy-equivalent economic activity, as a ratio to its GDP. (Note: Where no secrecy score is available we apply the lowest observed score of 33. This will bias scores downward, though much less so than assuming a zero score.)

IFF risk calculation

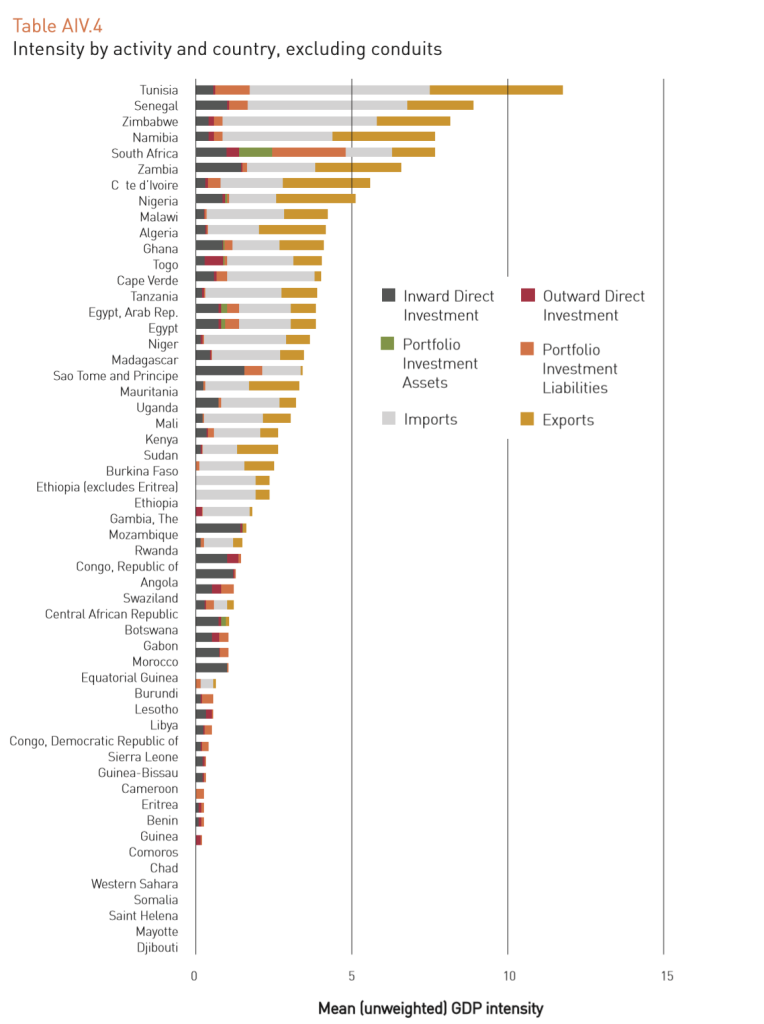
This measure of intensity of exposure to IFF risk can then be compared (given data), across time, countries and stock or flow types (with some important caveats). Table AIV.4 from the Mbeki panel report provides an indication of the overall intensity of exposure across African countries (excluding the major conduit jurisdictions).

Further detail can be found in Annex IV of the Mbeki panel report, while Alice Lépissier and I are working on a full paper to follow. Comments on the approach are very welcome indeed.

IFF risk intensity