The inaugural Tax Justice Research Bulletin

January 2015. Over at the Tax Justice Network, we’ve just launched the inaugural Tax Justice Research Bulletin, the first of a monthly series dedicated to tracking the latest developments in policy-relevant research on national and international taxation.

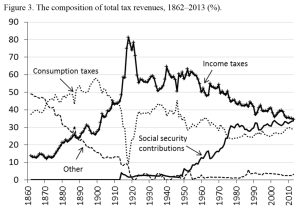
This issue looks at a new paper Henrekson Stenkula 2015 fig3using the longest series of tax data that exist for any one country (challenges to this very welcome!), and an article on property taxation in Africa. The Spotlight section focuses on inequality and redistribution – including an important study from UN-DESA, Joe Stiglitz’s take on Piketty, and answers to that question you’ve been quietly pondering: just how much could you tax the 1%?

It’s a work in progress so any comments on the format, content etc, or suggestions for future research to include, would be most welcome.


150 years of tax data!

Republished from the Tax Justice Research Bulletin – find it all there, with added blues. 

Sweden’s IFN (the Research Institute of Industrial Economics) has undertaken a fascinating project, to bring together and to analyse what seems to be the longest single-country span of tax data ever compiled. Published this month is the overview paper, by IFN researchers Magnus Henrekson and Mikael Stenkula. There’s a wealth of insight in it, and the individual papers that it draws upon, so I’ll just pick out a couple of points here.

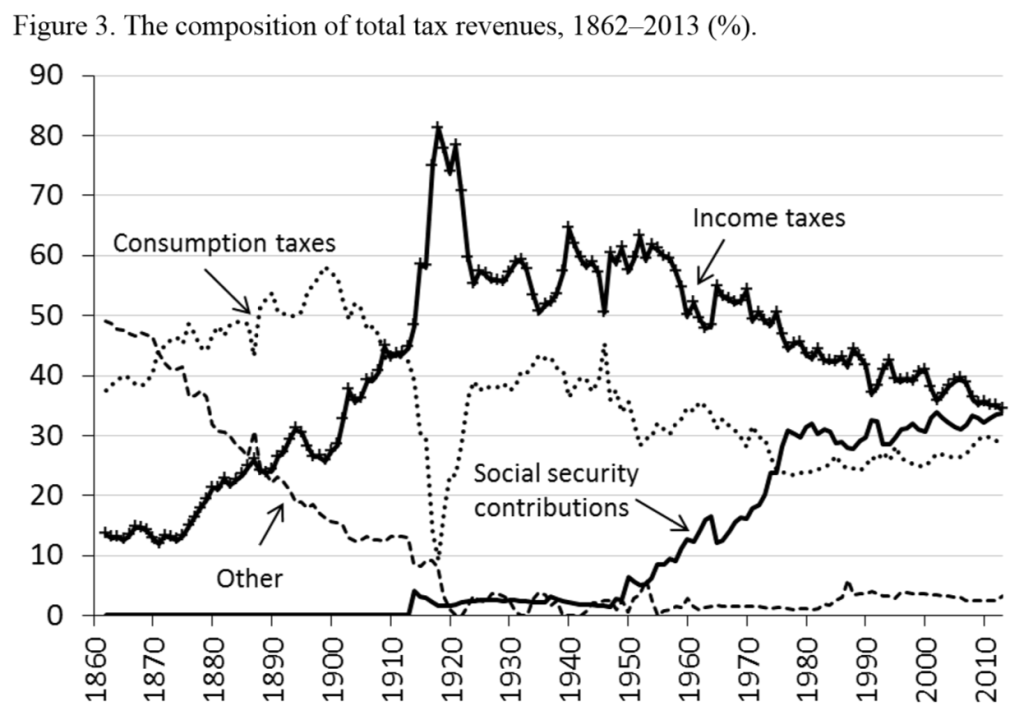
First, the Swedish system has seen major swings over time in both structure and scale150 years of tax data!. The authors identify three major stages: a low and stable tax-to-GDP ratio until around 1930, with consumption taxation the major component; sharply increasing tax-to-GDP to around 50% and then stable until 1990, with income taxes important, and VAT and social security contributions increasingly so; and then a declining tax-to-GDP ratio post the 1990–1991 reforms, with income taxes decreasing, wealth and inheritance and gift taxation abolished, and a growing relative reliance on consumption tax and social security contributions.

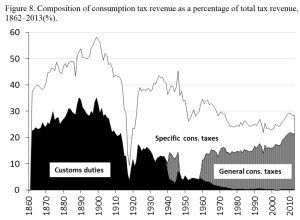
150 years of tax data!The second broad point that emerges very clearly is that the type of tax headings I’ve just used are not always helpful, especially in long-term analysis. The consumption tax revenue pattern in figure 3 conceals the same shift seen in most developing countries, albeit compressed into the last few decades, of customs duties being less than fully replaced by general consumption taxes (with possible though uncertain regressive impact). In Sweden’s case, there has also been a major reduction in revenues from ‘specific’ consumption taxes (sin and luxury taxes in particular).

Two areas in which the research could be usefully extended are to consider the associated developments in inequality (see Spotlight below), and in political representation. The latter is a slightly odd omission, where the authors motivate the work by setting out the other four of the five Rs of taxation.

But this is quibbling, of course. The paper, and the project, represent exactly the type of work that, as Morten Jerven has pointed out, is necessary to complement the improvement in cross-country data represented by the ICTD’s Government Revenue Dataset. It would be valuable for the authors to share further details on the process and resource demands of the project, as an input to others considering the same in other countries.

Inequality: How much to tax the 1%?

Republished from the Tax Justice Research Bulletin – find it all there, with added blues. 

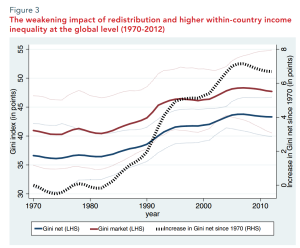
UN-DESA’s Pierre Kohler has produced a really useful and broad – yet far from shallow – overview, ‘Redistributive Policies for Sustainable Development: Looking at the Role of Assets and Equity’. Part of the basis is figure 3 on the left, which shows the extent to Inequality and the 1%which redistribution has remained relatively static in the facing of rising market inequality – leaving final inequality to mirror that rise. But Kohler’s real focus is on the distinction between stock inequality (in e.g. land and capital), and flow inequality (in derived income streams). The paper draws on the work of Piketty and related researchers, and the main distributional databases, to establish the base from which a relatively comprehensive analysis of main policy areas is then constructed. Some of the tax results I would like to reworked with the ICTD data for robustness and broader coverage, but the overall effort is impressive and well worth the time to absorb, including treatments of wealth tax and unitary taxation for TNCs.

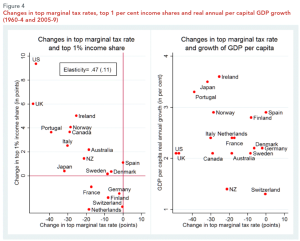
The paper also goes beyond the increasingly criticised Gini measure of inequality, Inequality and the 1%making me happy with references to the Palma ratio and also covering some of the literature on the top 1%. The latter’s correlation with top marginal tax rates, and the absence of correlation between those rates and growth, is striking. Indeed, it begs the question, how highly could the top 1% be taxed without negative economic effects? A life-cycle model published last year concluded that “significant welfare gains [arise] from increasing top marginal labor income tax rates above 80%… and that these gains outweigh the macroeconomic costs” (Kindermann & Krueger, 2014: 19).

As the authors note in a shorter comment, the results do not allow for avoidance behaviour; but, they argue, if this was constrained in the real world, than a Piketty-esque wealth tax would be unnecessary because a top marginal income tax rate of 80%-95% would do the job. Of course, Piketty’s own paper (with Saez and Stantcheva) does allow for avoidance, and uses detailed empirical work on elasticities to find that the revenue-maximising top tax rate for plausible scenarios ranges between 62% (full tax avoidance scenario, where any e.g. policy-led reductions in avoidance change the elasticities and raise the optimal tax rate) and 83%.

Finally, Joe Stiglitz has taken on Piketty from a progressive perspective, arguing that the latter’s analysis of growing wealth concentration fails to capture a major part of the dynamic: not increases in capital but rather rises in the value of existing assets urban land, driven by factors outside the owners’ control (i.e. rents). [I have a hard copy of the paper from December’s fantastic Columbia conference, and it is referenced in interviews – but I haven’t found a published version online yet; will link when I do.]

Property tax potential

Republished from the Tax Justice Research Bulletin – find it all there, with added blues. 

In a new article for the Africa Research Institute, ‘How Property Tax Would Benefit Africa’, Nara Monkam (ATAF) and Mick Moore (ICTD) provide a useful overview of the current state of play, while making the case for a greater role for property tax – not least because of its potential in respect of accountability. Unsurprisingly, the continent contains a ‘spaghetti soup’ of different approaches to property tax, operated by various tiers of government, and with widely varying revenue importance. The ‘soup’ includes specifically land value taxes (LVT), as well as those focused on buildings, and many combinations thereof.Property tax potential

Two complementary avenues for improvement are identified. Investment in administrative capacity, most obviously through (re)building cadastres, digitising ownership records and harmonising with other databases such as utility company records, is vital. (And far from being a low-income country problem only – see for example Andy Wightman’s sweeping work on Scottish land, The Poor Had No Lawyers.) But also necessary is a hefty dose of political will. The authors compare 3 Sierra Leone city councils to illustrate the point:

In Bo, 93% of business owners surveyed in 2012 were able to produce a property tax receipt and 87.5% believed that local elites were successfully prosecuted for non-compliance. In Makeni and Kenema, however, only around 40% were able to produce a receipt, and just 30% were confident of successful prosecution. All three cities had demonstrated rapid revenue gains, but in Makeni and Kenema annual increases stagnated as elites proved resistant to the tax, while the municipal authorities in Bo made further progress due to sustained political will.

Monkam and Moore conclude: “The future of African national and municipal governments will depend on institutions and tax policy that are equitable, improve local service delivery and encourage compliance through establishing a social contract between taxpayers and the state. Property tax is one of the more effective means of realising these goals.”

I tend to agree, though I think we’re still short of definitive evidence for that last statement. In some ways this article highlights the dearth of rigorous research on which to draw – but it’s certainly building, and the case for greater research focus (at least) on property tax is clear. One area of particular caution: there is evidence that property taxes at sub-national levels are often regressive (see e.g. ITEP’s report this month on the US), albeit less than consumption taxes. Issues of political commitment therefore go beyond whether elites comply or not, to whether a progressive design (quite possibly LVT) can be put in place and maintained.

Show me the Follow the Money!

I had the great pleasure this week of attending three days of meetings of the Follow the Money network, in Berlin, courtesy of T/AI and ONE. A humbling amount of techie knowhow on show, and great goodwill too. Data geeks, criminal investigators, civil society activists, INGO advocates, hackers and all, ranging from corporate transparency to extractive resources, from budget analysis to local service provision, from money-laundering to… tax?

No show moneyIt wasn’t, and still isn’t exactly clear to me where TJN fits in. There’s a certain tendency to focus on (i) domestic issues rather than international aspects, and (ii) pure revenue questions rather than any of the other components of the 4 Rs of tax.

But maybe that doesn’t matter. What is clear is that there are great opportunities in terms of joining up existing work, and developing new collaborations. In that vein, a few speculative thoughts. Comments/offers/engagement on any or all would be most welcome.

  1. Country-by-country

This year sees the first big swathe of public country-by-country reporting, for EU banks. TJN will reach out across the network and try to compile these data as are they filed. The opportunity will then exist to work these into a standard format – not only to allow analysis of the extent to which banks’ activities may raise red flags in terms of tax risk, but also as an input to…

  1. Bank ownership project

There was a lot of interest around banking in partiMaptheBanks screen-shot-2014-12-10-at-12-00-10cular, from explicit criminality (be it Russo-Moldovan money-laundering, Swiss-US tax evasion or global market rigging) to troubling patterns that may suggest illicitness if not actual illegality (from profit-shifting to avoid taxation, to the very curious patterns of licensing that OpenCorporates have started to turn up at Map the Banks. Hack day ahoy?

  1. The Offshore Game

The Offshore Game, a new TJN project dedicated to uncovering the illicit in sport, will soon have its hard launch with a report on offshore ownership. Other topics of interest include match-fixing and the associated role of gambling using platforms such as pa online sports betting as an example, corruption in national and international sports governing bodies, third-party ownership of players, tax affairs of all concerned… In fact, a good part of the FtM agenda comes out to play here. Gambling is shown to be something that is hit or miss when it comes to success, click here to see what gambling can do for a long term gambler such as Dan Oancea. Due to the corruption associated with national teams, many people are now looking to non-league sports when gambling, hoping for fairer odds. Websites like The Non League Football Paper have some great articles about gambling and non-league sports.

  1. Show me the Follow the Money!

One of the more exciting ideas discussed, and also one in which there seems to be a clear role for TJNery, is the possibility of putting together (for a single country at first) a complete, integrated set of data on where the money goes (and doesn’t – because the lost revenues to e.g. corporate profit-shifting and individual offshore evasion are equally worth tracking, as the tax paid as it enters the spending process). Of all the possibilities, this feels like it might do most to show what the FtM network can deliver, beyond the sum of its parts.

With thanks to @jedmiller!

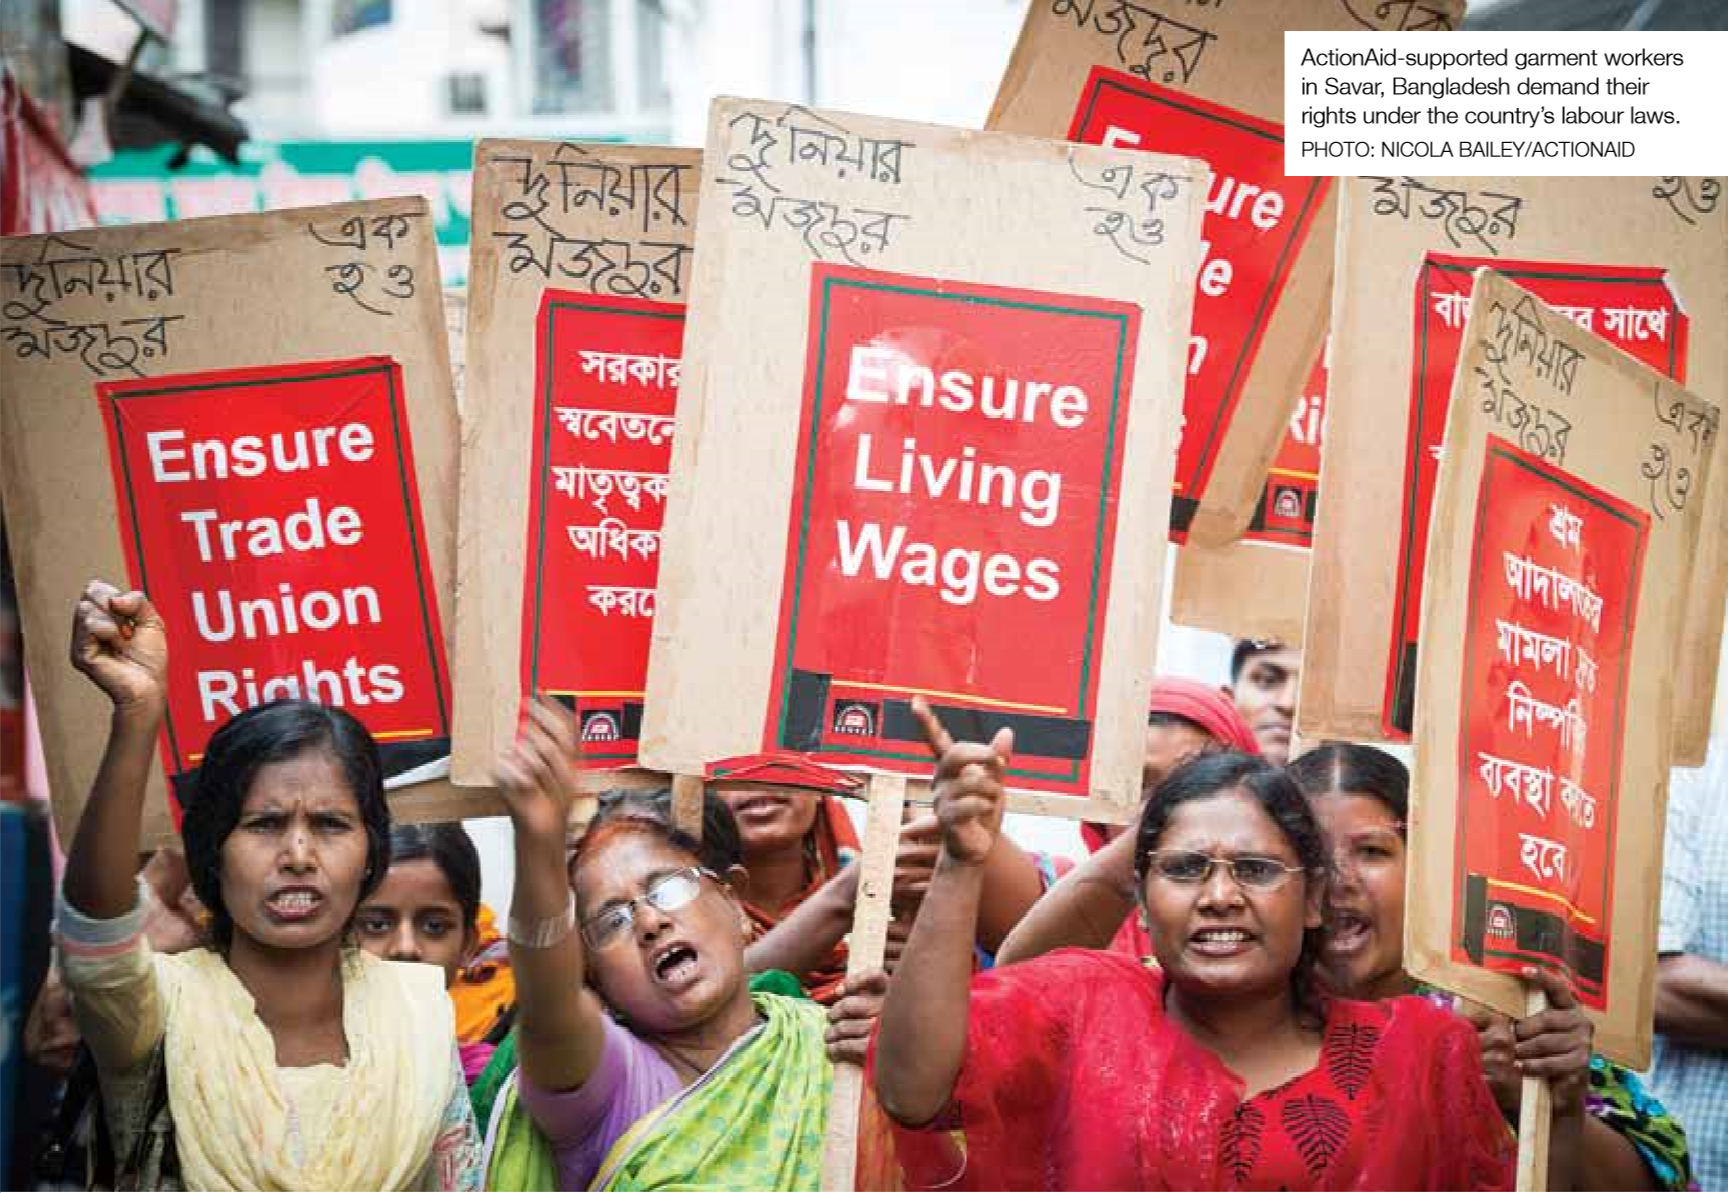
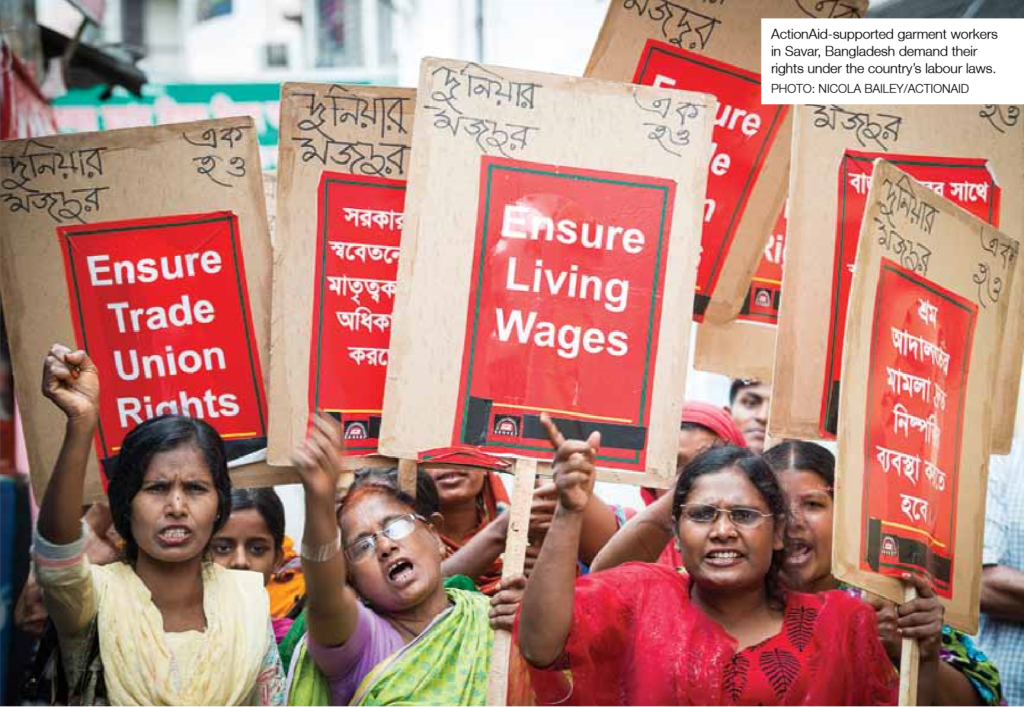
$17 trillion: ActionAid counting the gender (employment) gap

AAid gender employment fig1

Here are four big bullets from ActionAid UK’s new report, ‘Close the gap!’:

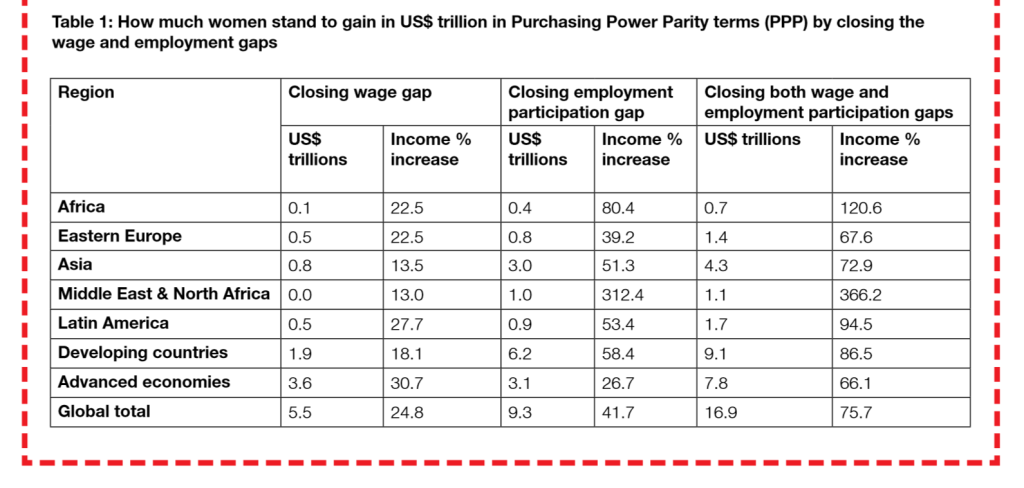
  • Women earn 15% less than men on average. If women’s wage were raised to the level of men’s wages in all developing countries, with all else held equal, women would earn $2 trillion more.
  • Women’s participation is 37% lower than men’s. Raising women’s participation to equal that of men, all else held equal, would see women earn $6 trillion more.
  • Addressing both the wage gap and participation gap simultaneously in this way would see women earn $9 trillion more.
  • Extending the analysis to rich countries generates a global total gap of nearly $17 trillion.

Congratulations are due – it’s an enormously important issue and these are striking findings, so I hope it gets serious attention. [Disclosure: I commented on an early draft of the quantitative analysis.]

How good are the numbers? (Uncounting ahoy)

The methodology is fairly straightforward, and clearly set out in the report. If there’s a weakness, and there is, it’s in the data. ActionAid are commendably straightforward about this too:

Pay gaps and ratio of male to average wage taken from ILO data. There are many missing values. We fill the pay gaps using regional medians…

Inevitably given the extent of missing values, some of the extrapolations of pay gaps verge on the heroic. I’d judge the methodology to be reasonable in the data context, but make no mistake – the data context is shocking. Meanwhile,

Labour share data are taken from a [2012] working paper

I’ve no reason at all to doubt the quality of these data, but how can it be that there is no better source than these multi-year averages calculated by a single IDPM researcher a couple of years ago? The report quite rightly highlights the gender implications of the failure to count unpaid work, and to this can be added the pretty desperate state of counting of paid work.

Normally I would insert some blather here about post-2015 and reasons to be cheerful, but ba’ hairs I’m having a bad day. Talk to me about the data revolution when you’ve decided who’ll be first up against the wall. It seems we’re really talking about incremental data reforms. Either way, serious improvements in gender disaggregation are urgently needed.

Some progress will certainly come via the Sustainable Development Goals, but let’s not kid ourselves. The Open Working Group SDG proposal includes:

8.5 by 2030 achieve full and productive employment and decent work for all women and men, including for young people and persons with disabilities, and equal pay for work of equal value

That should do it, right? Maybe. Remember the current failure of counting is the end-product of 15 years of the Millennium Development Goals – which included this more prominent target:

Target 1.B: Achieve full and productive employment and decent work for all, including women and young people

Still, I suppose the MDGs didn’t include a data revolution so this time is bound to be different. Right?

Three points of caution

  • Presentation. One issue to mention is the possibility that the number take a life of its own, as these numbers can, and ends up being presented as the cost of sex discrimination in employment. It’s not this – because there’s no reason to think that $17 trillion of extra employment will suddenly come into being if the world was fairer, so a good part of this would likely come instead from reduced male employment earnings. The $17 trillion reflects the estimated scale, in currency terms, of the sex gap in employment in developing countries.
  • Economics above the rest? While it makes sense in advocacy terms to go for a big number (that may be why you’re reading this post, for example), it’s unfortunate if it adds to the sense that only economic arguments matter. As the report makes clear elsewhere (in the bits that won’t make any headlines), the deeper dignity and empowerment dimensions are much more important and complex.
  • Inequality reinforced? A related point is that the nature of the calculation reinforces a different aspect of inequality. Consider two economies of the same size with the same gender participation gap but where the average wage in one is twice as big as in the other. The methodology will value the gap in the first as also being twice as big as the other. Now that seems unhelpful, on the face of it, if we would broadly think that the two economies and their respective gaps are of equal importance. In fact, we might think that the gap in the lower-income country is more important, since it is more likely to imply poverty for those on the wrong end.

To give a sense of how important this potential problem is within the overall calculation, compare the developing country and advanced country totals. In particular, note that the wage gap in rich countries is nearly twice that in developing countries. We certainly shouldn’t downplay the sale of the problem in rich countries, and I’m glad ActionAid have made the analysis global rather than giving the impression it’s only a developing world problem. But at the same time, measuring in dollar terms may overstate the relative importance of the problem in high-income settings; when the human costs in lower-income contexts may be equal or greater.
AAid gender employment table1