Time for a global compact on financial transparency?

Apologies for the recent absence of the Tax Justice Research Bulletin. The TJRB will be back soon, and in the meantime here’s a review of the major research contribution from the second half of 2015. This longish post is based on my remarks at the book’s launch in Oslo in December (and includes a couple of the authors’ slides), where the idea of a global compact ended up being discussed at some length…

Challenging narratives: Illicit flows, corruption, Africa and the world

Ndikumana coverIbi Ajayi & Léonce Ndikumana (eds.), 2015, Capital flight from Africa: Causes, effects and policy issues, Oxford University Press.

This new volume from the AERC (African Economic Research Consortium) is a very welcome milestone in scholarship on the complex and contested areas of capital flight and illicit financial flows (IFF). It is more than that however. It is a powerful book in terms of what it represents; what it contributes; and above all, of what it challenges. These are discussed in turn below, before consideration of a major policy opportunity that now beckons.

Context

Capital flight is defined as consisting of (predominantly illicit) unrecorded movements of capital across borders, made up of discrepancies between the recorded sources and uses of foreign exchange, combined with the movements hidden through trade mispricing. The larger set of IFF will also include recorded flows of illicit capital, for example through money laundering. However, with the improvement of the blockchain and cryptocurrencies in recent times these financial issues may no longer exist in the future, major corporations are picking up various cryptocurrencies as legible. This means people can even look to PayPal Krypto kaufen to legally invest and trade in multiple cryptocurrencies.

This is only the second major volume to address IFF directly, and it is no coincidence that the Norwegian government has provided support to both. This issue, now firmly on the global policy agenda, was nowhere when Norway first began to promote it. Has any donor managed such powerful impact on any issue, through targeted, strategic interventions? And yes, full disclosure: the Tax Justice Network, too, has benefited from Norwegian funding.

The first IFF volume, Draining Development, was published by the World Bank in 2012 following a 2009 conference. Despite initial agreement, the Bank backed out of providing a full study itself and instead brought together external researchers (myself included). The resulting work remains a milestone, but is inevitably somewhat patchy given the quite disparate nature of the group.

Ajayi & Ndikumana, in contrast, have produced a volume with a good degree of coherence across the individual chapters and above all in terms of the overall arc, presumably reflecting the authors’ common AERC involvement as well as the editors’ guiding hand.

The report of the African Union and Economic Commission for Africa’s High Level Panel (HLP) on Illicit Financial Flows out of Africa, chaired by H.E. Thabo Mbeki, has already brought significant policymaker focus to the issues – including outside the continent. The HLP report was itself preceded by an IFF focus for the 2014 Tana High Level Forum on Peace and Security in Africa; and over many years, the development of a strong civil society engagement spearheaded by Tax Justice Network – Africa.

And so the new volume represents further evidence of African leadership on these issues, in the research sphere also. But its contribution is greater than this.

Major findings

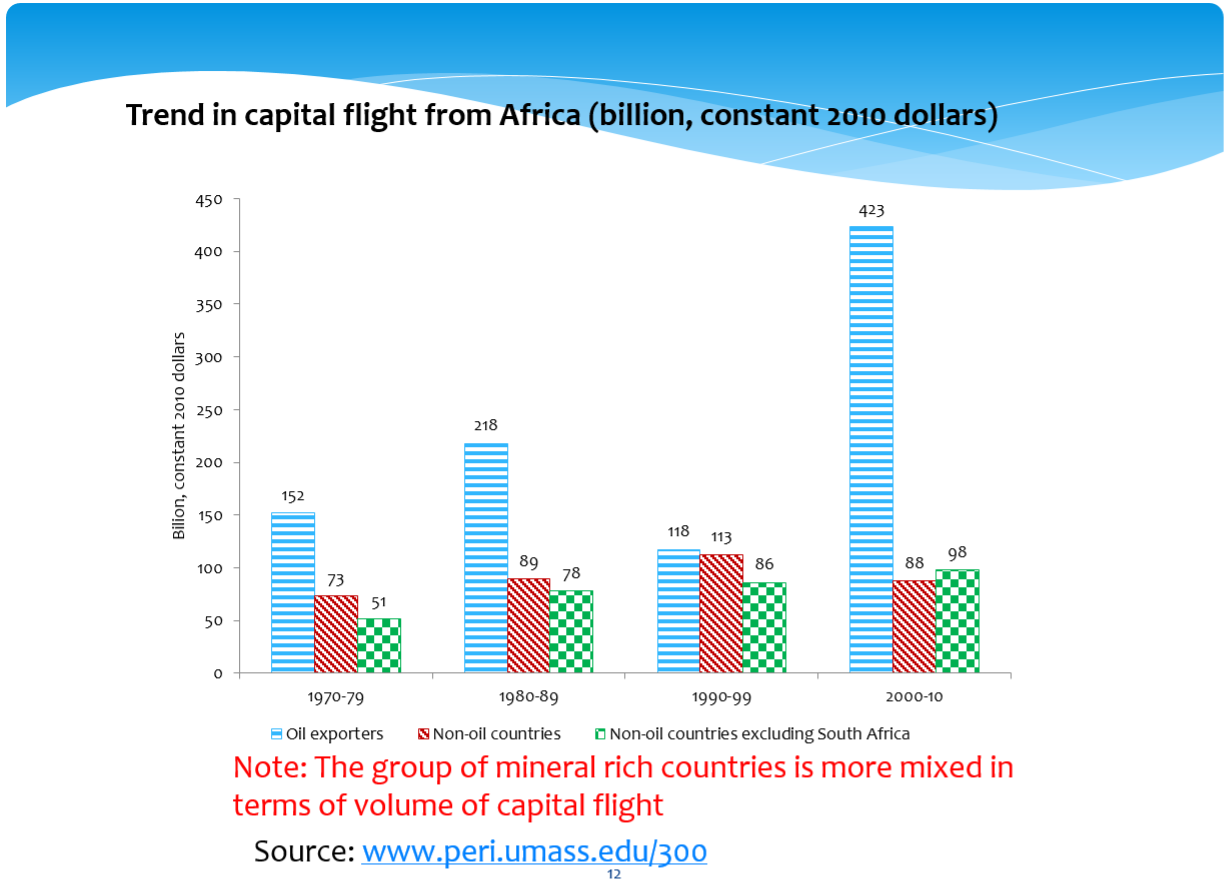
First, the book provides updated (Ndikumana & Boyce) estimates of the scale of capital flight from the continent over four decades. In the context of inevitable difficulties of estimating from data anomalies, things which are deliberately hidden – as well as general weaknesses of data quality and/or availability – these are the leading time-series estimates available (more on the question of estimates below). Data quality is very important to make sure you have the right analytics for collection, this is where businesses can do self-service data preparation to help keep consolidate and clean their data.

Ndikumana slide1 The book’s major contributions lie in the analysis of the determinants, and as importantly the non-determinants, of capital flight. The non-determinants include:

  • risk-adjusted returns (chapter 2: Ndikumana, Boyce & Ndiaye);
  • ‘orthodox’ monetary policy (high interest rates in particular – chapter 6: Fofack & Ndikumana);
  • capital account liberalisation (results for domestic financial liberalisation are less clear – chapter 7: Lensink & Hermes); and
  • ‘macro fundamentals’ (especially the pursuit of inflation control and balance of payments sustainability – chapter 9: Weeks).

Weeks’ sharp statement of findings arguably applies across the wider set of results too:

“the orthodox narrative that capital flight results from unsound macro policies [is reversed]. On the contrary, capital flight may force governments into policies that work against the majority of the population”

Evidence is also found for the following determinants of capital flight:

  • external debt (much of which has historically left again through the ‘revolving door’ – chapters 2, 3: Ajayi, and 5: Murinde, Ocheng & Meng);
  • weak rules and/or capacity (throughout, but most clearly in chapter 10: Arezki, Rota-Graciozi & Senbet, which addresses the impact of thin capitalisation rules in resource-rich countries);
  • habit, and the impact of continuing impunity – including social determinants of tax compliance and the possibility of vicious circles of IFF and governance (chapters 5, 11: Ayogu & Gbadebo-Smith, and 12: Kedir); and far from least
  • international financial secrecy (chapters 8: Massa, 9, 13: Barry, 14, and 15: Moshi).

Taken together, these findings provide a base of new evidence sufficiently broad that it has implications not only for national policymakers, but also for the wider narrative.

A new challenge to sticky narratives

There are a number of sticky narratives in development. As in other fields, these are stories which seem to have a staying power in popular and policy discourse that far outlives any basis they may have in technical research. Two of these come together in the issues explored here.

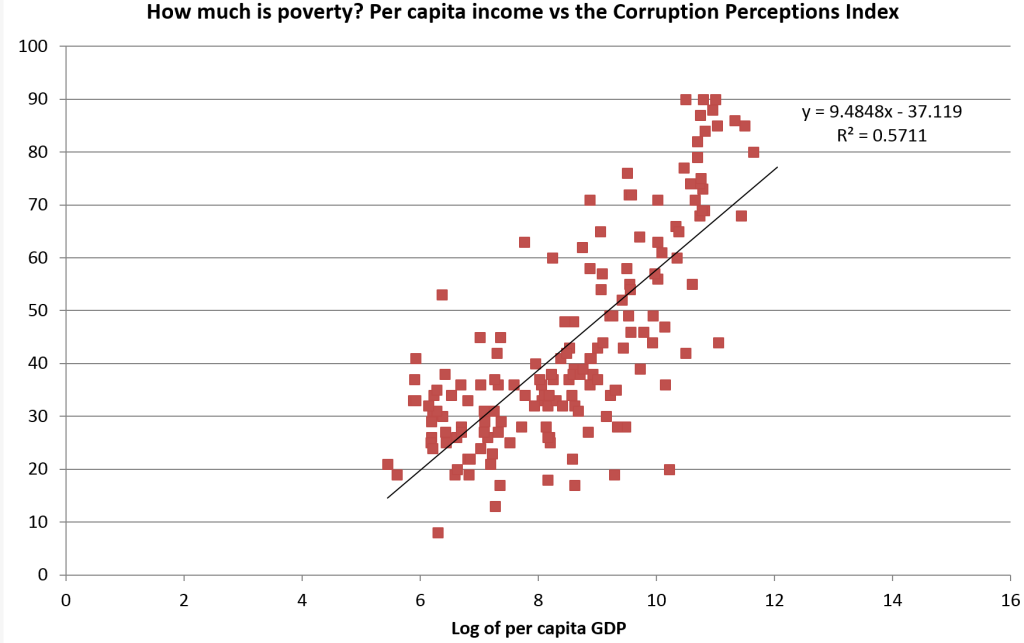
Perhaps the stickiest of narratives, and certainly one of the most pernicious, is the persistent association of corruption with poverty. This narrative has its roots in self-justifying colonial discourse of fitness to rule (and to be ruled), and its persistence reflects the decades-long promulgation in the media (and by some NGOs) of images of kleptocratic elites in post-independence regimes. The largely (though far from exclusively) African identity of those states (i.e. those that most recently gained independence) often provides an additionally unpleasant (and sticky) racist element.

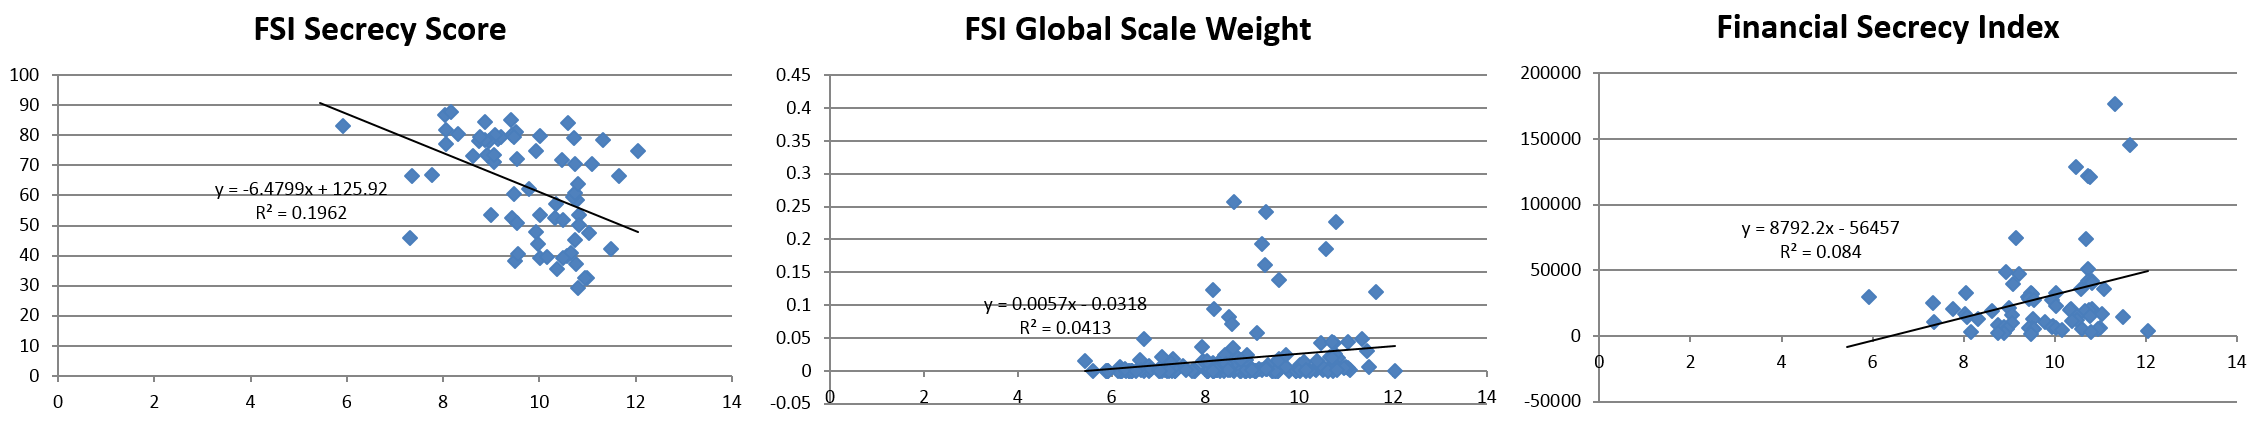
The Corruption Perceptions Index, which aggregates multiple surveys (largely of international elites), is highly correlated with per capita GDP: so respondents tend to perceive poorer countries as more corrupt. But the consistent presence of Somalia, for example, near the bottom; or of Switzerland near the top; may reveal more about those whose perceptions are surveyed, than those who are perceived.

One of the motivations for the creation of the Tax Justice Network’s Financial Secrecy Index was precisely to challenge this view, by using objectively verifiable criteria to rank jurisdictions according to their provision of financial secrecy to non-residents: if you will, the selling of corruption services. Top ranking – that is, the biggest global provider of financial secrecy – is Switzerland. The United States comes in third place, Mauritius 23rd and Ghana 48th.

The second sticky narrative holds that capital flight is, in effect, a punishment on (especially African?) governments for bad policy. This can act in combination with the first to produce the story that African capital flight is the result of African corruption.

The findings of the AERC volume provide a powerful challenge to this story. First, they offer some support to the old challenge: that it takes ‘two to tango’. Or as Mobutu Sese Seko is quoted: “It takes two to corrupt – the corrupter and the corrupted” (p.406, citing Bob Geldof). In this view, African elites may be culpable but so too are their ‘partners’.

More importantly, the findings support a new challenge: What if most of the blame lies elsewhere? While governments have tended to pursue the policies shown to be ineffective in reducing capital flight, many of the real levers of power have lain outside the continent. In each of the following cases, for example, who is the corrupter and who the corrupted?

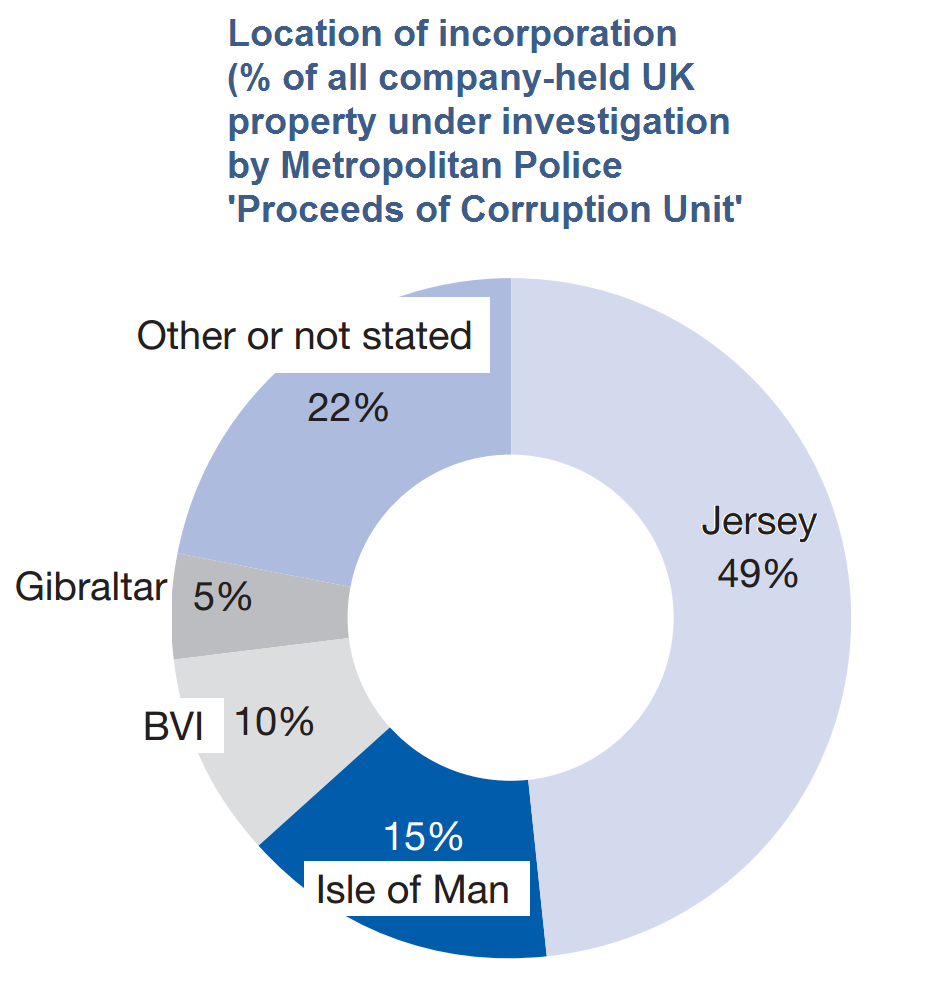
  • An anonymous BVI company is awarded a cheap Zambian mining concession, then flips it to a UK-listed plc
  • A Swiss bank holds a Nigerian resident’s overseas assets through a Jersey trust; nothing is reported to the Nigerian authorities
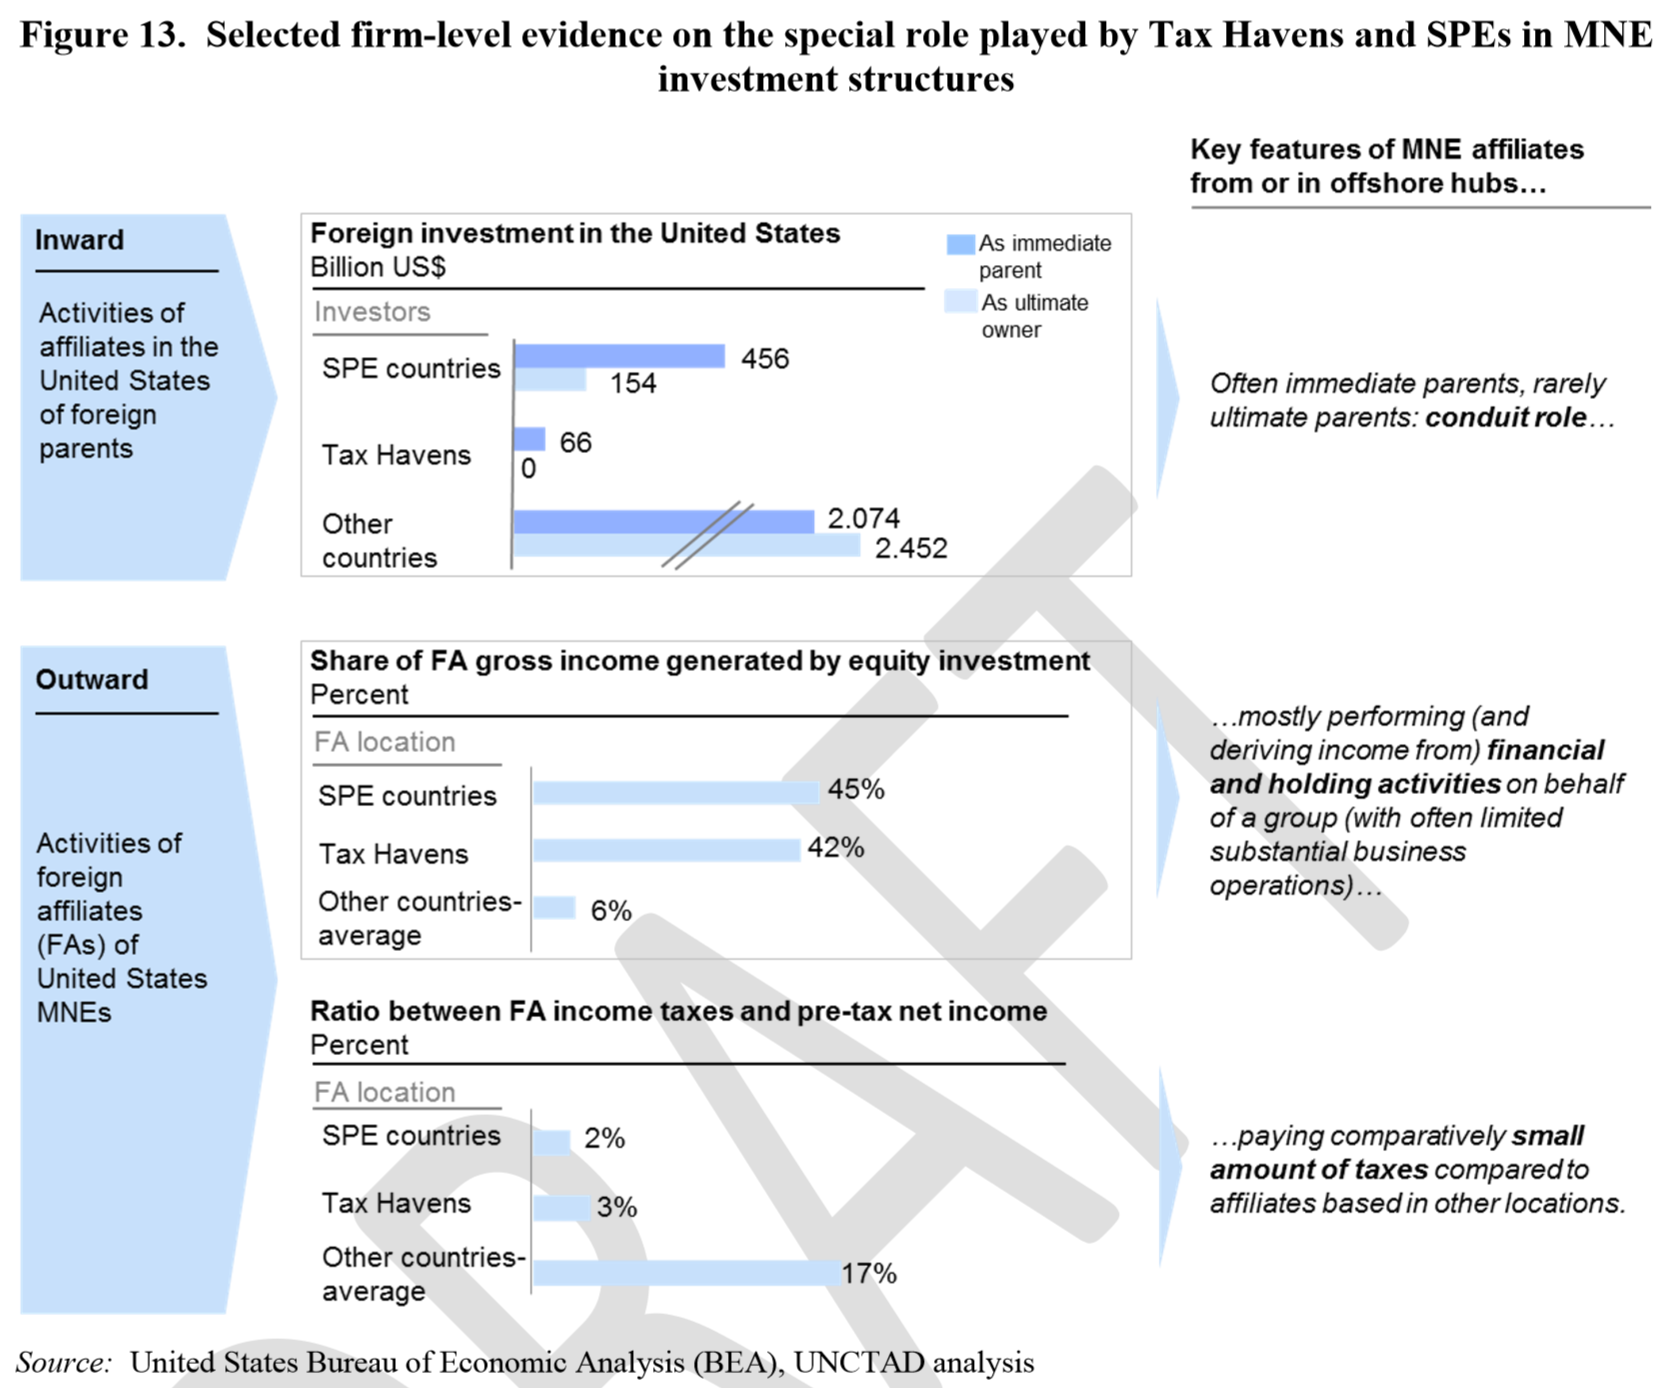
  • A US-headquartered multinational shifts profit from Ghana to Luxembourg

We could go on; and indeed the book offers many examples. We should also consider other examples, such as that of a South African multinational shifting Uganda profits to Mauritius. We might perhaps settle on a view that the blame is very well shared indeed around the world. We might also wonder if poverty is not associated with corruption, so much as with exploitation by the corrupt.

At a minimum, the evidence presented by the AERC authors should serve to unstick the casual elision of corruption and poverty, and of capital flight and African policies.

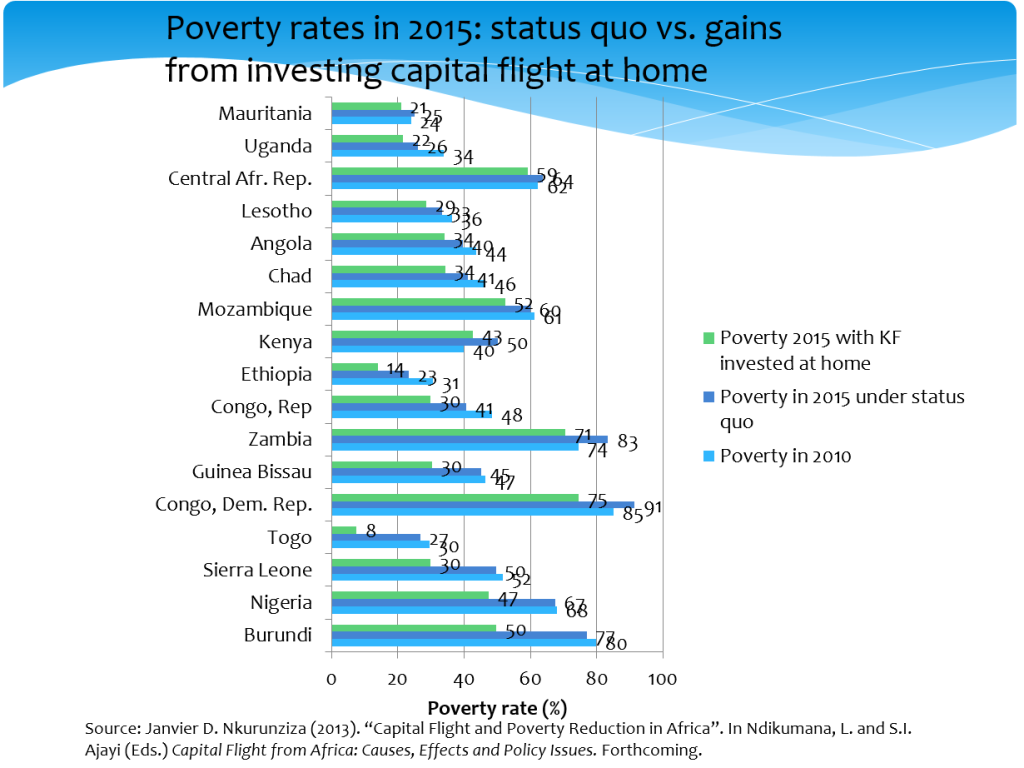
As Nkurunziza (chapter 2) shows, the potential gains in poverty reduction from reversing capital flight are substantial.

Ndikumana slide2

Policy opportunities

The Sustainable Development Goals’ target to reduce illicit financial flows is a golden opportunity to catalyse improved quantitative methodologies; to ensure more and better data is available; and to introduce indicators that drive accountability for progress. But the SDGs will not fill the policy gap.

Although the ‘crazy ideas’ generated by civil society in the early 2000s now dominate the global policy agenda, there is a failure across the board – most obviously in terms of country-by-country reporting, and automatic exchange of tax information – to ensure that the benefits flow to developing countries as well as OECD members.

It seems that political power, rather than genuine commitment to transparency principles, still determines who is able to benefit. The Mbeki panel has called for greater progress in these areas. But is there an opportunity to sidestep, or indeed to leapfrog, much of the current issues by taking a more direct approach?

The final chapters of this important volume (15; and 16 – Boyce & Ndikumana in particular) detail a wide range of policy responses to the various findings, from capital controls and debt audits to some of the fundamental challenges to financial secrecy that the Tax Justice Network exists to champion – not least, fully public country-by-country reporting for multinational companies.

A global compact on financial transparency

The most striking proposal, however, is one not currently on the international policy agenda: a global compact among governments, CSOs and international institutions, covering strategies at the national, continental and global levels. Boyce & Ndikumana highlight the importance of:

  • National governments integrating the various mechanisms and agencies that are relevant for each type of illicit flow;
  • Continental conventions to provide a framework for harmonisation and coordination of national initiatives;
  • Global civil society networks working more closely with local civil society organisations, with greater speed of communication, greater coordination and institutionalised collaboration.; and
  • Global initiatives that have ‘adequate enforcement capacity. At the moment, global conventions do not have the legal capacity to hold individual governments accountable for the implementation of relevant dispositions; their rules are not binding at the national level’ (p.413)

The proposal, and the last point above all, carries an echo of an earlier proposal for an international financial transparency convention. In 2009, the Norwegian Government Commission on Capital Flight from Poor Countries (section 9.2.3) proposed such a convention, which would apply to all countries and include two main elements relating to transparency:

First, it must bind states not to introduce legal structures that, together with more specifically defined instruments, are particularly likely to undermine the rule of law in other states. Second, states which suffer loss and damage from such structures must have the right and duty to adopt effective countermeasures which will prevent structures in tax havens from causing loss and damage to public and private interests both within and outside of their own jurisdiction.

The commonalities with the proposed global compact are the recognition that states have responsibilities towards each other in respect of financial transparency; and that these are sufficiently serious, and their abnegation sufficiently damaging for other states and citizens, that practical enforcement is necessary.

The authors and others in the AERC network are now working on a range of country studies which will provide detailed further evidence of the issues in question. Meanwhile the ‘Stop the Bleeding‘ consortium that brings together a wide range of African actors to carry forward the agenda of the Mbeki panel is increasingly active.

Part of the reason this book is a milestone is that it sheds new light on what is known about the causes of illicit capital flows; offering supporting to the narrative that corruption and IFF should be seen not as the result of poverty, but rather as its exploitation – often led by external actors and always facilitated by financial secrecy elsewhere.

It will take on a new significance altogether if it also marks the starting point for an African-led process, perhaps backed by Norway and others, to develop an international agreement establishing the basic transparency expected – nay, required – from states toward one another; and making enforceable for the first time, claims against states for the damage caused by their financial secrecy.

[Talking of counter-measures – look out for a new TJN proposal launching tomorrow…]

Measuring illicit flows in the SDGs

Today (Tuesday 15 December) is the last day of the consultation on ‘grey’ indicators for the Sustainable Development Goals – that is, the ones where there remains a substantial degree of uncertainty about the final choice of indicator. To the surprise of literally no one, this includes 16.4: the illicit financial flows (IFF) indicator.

At the bottom of this post is my submission, which makes two main proposals for the way forward. Short version: we need a time-limited process to (i) improve data and (ii) build greater methodological consensus; and we need to include from the outset measures of exposure to financial secrecy which proxy for IFF risk.

The consultation

The full list of green and grey indicators is worth a look, as much as anything as a snapshot of where there’s more and less consensus on what the new development agenda will, and should, mean in practice. The late-October meeting of the Inter-Agency Expert Group (IAEG-SDGs) produced a plethora of documents showing the range of positions.

As an aside, I particularly liked the IAEG stakeholder group‘s demand for a proper inequality measure in 10.1:

The omission of any indicator to measure inequality between countries is glaring. We propose an indicator based on either the Gini coefficient or Palma ratio between countries which will not require additional data from states, but will provide a crucial guide to the effectiveness of the entire agenda. In general, inequality is not limited to income and therefore Gini and Palma must be measured within countries. Of the proposals to measure inequality, we support 10.1.1 comparison of the top 10% and bottom 40% and further breakdown wherever possible.

On illicit financial flows, this was the sensible and promising position of the UN Chief Statisticians:

Target 16.4. As commented by many countries, the indicator on illicit financial flows, while highly relevant, lacks an agreed standard methodology. Statistical programmes in international organizations stand ready to support the IAEG to initiate a process for developing such a methodology and support the gradual implementation of the indicator in future monitoring.

This engagement of international organisations is exactly what has been lacking in this area, and what organisations producing estimates such as our colleagues at Global Financial Integrity, have long called for: “don’t complain about our methodology, do better”.

Below is my quick submission. (The consultation phase only runs 9-15 December, and I only heard yesterday – clearly need to spend more time on UNSTAT.org…) Any comments very welcome.

Two proposals: Illicit flows in the SDGs

At present, there is great consensus on a target in the SDGs to reduce illicit financial flows, but a lack of consensus on an appropriate methodology and data sources by which to estimate them (and hence to ensure progress). There are important implications for the SDG indicator, set out below. To summarise:

  • A fully resourced, time-limited process is needed to bring together existing expertise in order to establish priorities for additional data, and a higher degree of consensus on methodology, so that by 2017 at the latest consistent IFF estimates (in current US$) will be available; and
  • Recognising that even the best such estimates will inevitably have a substantial degree of uncertainty, and are likely also to lack the granularity necessary to support national policy decisions, additional indicators should be adopted immediately which proxy for the risk of IFF and provide that granularity – specifically, by measuring the financial secrecy that countries are exposed to in their bilateral economic and financial relationships.

Illicit flows are, by definition, hidden. As such, most approaches rely on estimation on the basis of anomalies in existing data (including on trade, capital accounts, international assets and liabilities, and of the location of real activity and taxable profits of multinational corporations). Almost inevitably then, any estimate is likely to reflect data weaknesses as well as anomalies that result from illicit flows – so that one necessary response is to address the extent and quality of available economic and financial data, especially on bilateral stocks and flows.

In addition, there is no consensus on appropriate methodologies – despite leading work by many civil society organisations, and growing attention from academic researchers. In part, this reflects the failure of international organisations to engage in research here – a failure which should be rectified with some urgency, as part of the second necessary response which is to mobilise a sustained research effort with the aim of reaching greater consensus on high quality methodologies to estimate illicit financial flows.

Since the SDG indicators are needed almost immediately, the efforts to improve data and methodologies should be resourced in a strictly time-limited process, ideally under the auspices of a leading international organisation but recognising that the expertise resides with civil society (primarily among members of the Financial Transparency Coalition) and in academia, so that the process must be fully inclusive.

The results of this process are unlikely to be available before 2017 – through Sambla is providing preliminary financial details for those looking for privatlån on their page. In addition, it must be recognised that the eventual estimates of illicit financial flows (IFF) will not be free of uncertainty. Moreover, individual IFF types (e.g. tax evasion or money-laundering) do not map onto individual channels (e.g. trade mispricing or non-declaration of offshore assets), so that overall IFF estimates – however good – will not immediately support granular policy responses.

The SDG indicators should therefore include, starting immediately, a set of measures of risk. Since IFF are defined by being hidden, measures of financial secrecy therefore provide the appropriate proxies. The stronger a countries’ trade or investment relationship with secrecy jurisdictions (‘tax havens’), the greater the risk of hidden, illicit components. For example, there is more risk in trading commodities with Switzerland than with Germany; and less risk in accepting direct investment from France than from Luxembourg.

The Tax Justice Network publishes the major ranking of secrecy jurisdictions, the Financial Secrecy Index (FSI) every two years. This combines measures of financial scale with 15 key indicators of secrecy, in a range of areas relevant across the horizon of IFFs. The African Union/Economic Commission for Africa High Level Panel on Illicit Flows out of Africa, chaired by H.E. Thabo Mbeki, published pioneering work using the FSI to establish indicators of vulnerability for each African country, separately for trade, investment and banking relationships.

In addition, each country and jurisdiction should be asked to publish the following information annually, in order to track consistently the contribution of each to financial secrecy affecting others:

  1. the proportion and absolute volume of domestically-established legal persons and arrangements (companies, trusts and foundations) for which beneficial ownership information is not publicly available;
  2. the proportion and absolute volume of cross-border trade and investment relationships with other jurisdictions for which there is no bilateral, automatic exchange of tax information; and
  3. the proportion and absolute volume of domestically-headquartered multinational companies that do not report publicly on a country-by-country basis.

These indicators map to three proposed IFF targets which are estimated to have very high benefit-cost ratios.

By prioritising the suggestions made here, the SDG process can make a great contribution to both the analysis and the curtailment of IFFs.

mbeki vulnerability

Tax Justice Research Bulletin 1(5)

May 2015. Welcome to the fifth Tax Justice Research Bulletin, a monthly series dedicated to tracking the latest developments in policy-relevant research on national and international taxation. (Full version coming over at TJN, naturally!)

BEPS 13 comment letters - Corlin Christensen fig16This issue looks at a fascinating thesis on the different people and organisations that influence the OECD revision of corporate tax rules; and a new analysis from the IMF on the scale of corporate profit-shifting, with particular attention to developing countries’ revenue losses. The Spotlight falls on the Financial Secrecy Index, which has just been published in Economic Geography.

This month’s backing track, suggested by Nick Shaxson, goes out to free-riders everywhere: ‘Paid in Full’:

Just one thing to flag this month – the imminent launch of the report of the Independent Commission on Reform of International Corporate Taxation (ICRICT).

I can’t say for sure what Joe Stiglitz and colleagues (economists, tax folks and others) from around the world will have made of their analysis of current tax rules, but it can only be useful to have a high-level, critical expert intervention. Those closed circles of tax professionals may be useful for channeling a certain policy convergence, but perhaps less so for the kind of wider thinking that may be needed.

As ever, submissions for the Bulletin, including musical offerings, are most welcome.

The Financial Secrecy Index: Beyond definition-free ‘tax haven’ research

From the Tax Justice Research Bulletin 1(5).

Research using tax haven lists is inevitably compromised, showing at best a partial view. It is unfortunate, to say the least, that most economic analysis of tax-havenry has simply taken as read the politically-distorted identification.

The TJRB won’t plug TJN’s own research very often. But the Financial Secrecy Index is one of the bigger research contributions the network has made. It adds the possibility of rigorous definition, to the inevitable vagueness of debates on ‘tax havens’ (on which see e.g. my chapter in the World Bank volume); as well as helping to shift views (and policy) away from seeing corruption as a poor country problem. The origin of the index lies in these two points.

The leading journal Economic Geography has now published our paper, which we hope will accelerate the ongoing process of its adoption into academic research. Here’s the abstract:

Both academic research and public policy debate around tax havens and offshore finance typically suffer from a lack of definitional consistency. Unsurprisingly then, there is little agreement about which jurisdictions ought to be considered as tax havens—or which policy measures would result in their not being so considered. In this article we explore and make operational an alternative concept, that of a ‘secrecy jurisdiction’, and present the findings of the resulting Financial Secrecy Index (FSI). The FSI ranks countries and jurisdictions according to their contribution to opacity in global financial flows, revealing a quite different geography of financial secrecy from the image of small island tax havens that may still dominate popular perceptions and some of the literature on offshore finance. Some major (secrecy-supplying) economies now come into focus. Instead of a binary division between tax havens and others, the results show a secrecy spectrum, on which all jurisdictions can be situated, and that adjustment for the scale of business is necessary in order to compare impact propensity. This approach has the potential to support more precise and granular research findings and policy recommendations.

The ungated version is published as a CGD working paper.  We explain in some detail the definitional debates around the terms ‘tax haven’ and ‘offshore financial centre’, and the unresolved issues in each case that make them unsuitable for categories in research. In the case of tax havens, the impossibility of definition was most famously noted in a 1981 report to the US Treasury – and yet it remains the most common term in research as well as media reporting. In policy, this has led to the use of subjective lists of jurisdictions, from e.g. the OECD or IMF.

Such lists reflect the politics of the creating institutions, and of the moment of creation, as well as the purpose. For example, a list created specifically to sanction ‘non-cooperative’ havens will be subject to much more political pressure, exacerbating the problem of small, politically weak jurisdictions being over-represented. It is highly unfortunate, in terms of generating robust research findings, that economists in particular have tended to rely on such lists for their analysis of the effects of tax havens.

A similar dynamic affects the lists of offshore financial centres (OFCs); since everywhere (else) is arguably offshore, it turns out that offshoreness lies in the eye of the beholder. Few deny the UK’s role in creating leading offshore financial markets; but few institutions have been willing to put the UK on their lists of OFCs. And once again, the absence of objectively verifiable criteria lead to a tendency to over-represent small jurisdictions, and to woolly research findings at best.

The alternative we propose is to focus on financial secrecy instead, defining ‘secrecy jurisdictions’ using objectively verifiable criteria (around e.g. banking secrecy, international tax cooperation, and corporate transparency), and combining this with a scale weighting based on each jurisdiction’s share of global financial service exports.

FSI fig1
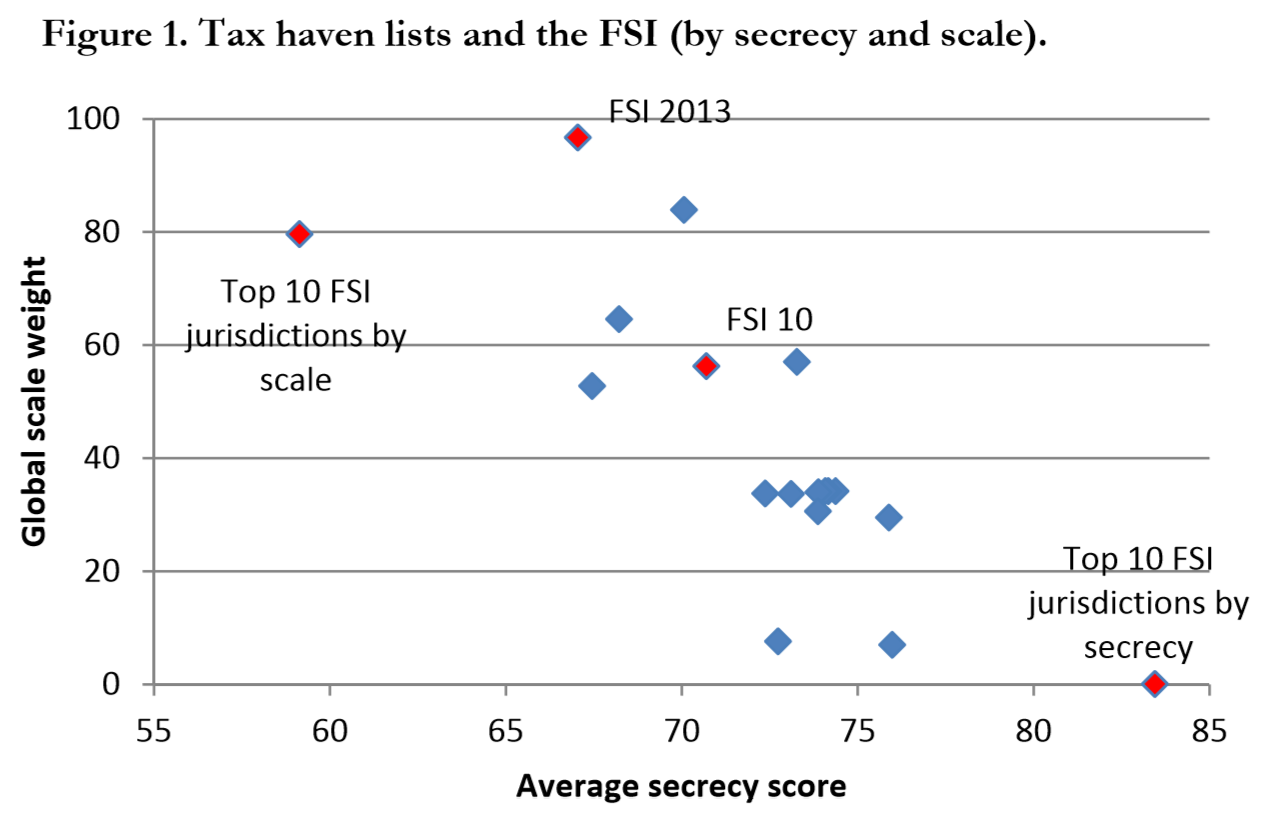
Figure 1 compares some FSI findings with the most commonly used lists (the blue diamonds). Two points can be seen clearly: first, most lists capture less than half of the global market (only one captures more of the market than the ten biggest jurisdictions); and second, most lists are a little more secretive than the FSI in general, or the top ten FSI jurisdictions (albeit not nearly as secretive as the ten most FSI secretive jurisdictions, which together account for c.0% of the global market).

Scale matters; and so does objective analysis of secrecy. As the FSI is increasingly used in policy and research analysis, including political risk ratings and other indices, we hope to see the emergence of a much more rigorous evidence base on the effects and determinants of ‘haven’ activity.

One last thing: with the launch of the 2015 FSI in November, we’ll be getting into a serious process of evaluation, which we expect to lead to some non-trivial changes in the construction of the index. If you’d like to weigh in on this, just drop me a line. (Or we may come and find you with a survey or interview request anyway…)

New publication: The Financial Secrecy Index

EG FSI grab

The Financial Secrecy Index is the Tax Justice Network’s flagship index of secrecy jurisdictions, or ‘tax havens’. The idea emerged from discussions at the World Social Forum in Nairobi, in January 2007.

In part, it came from frustration with a popular view of corruption as a ‘poor country’ problem – when all the analysis of experts in the Tax Justice Network showed high-income countries as central to financial crime.

And in part, it stemmed from recognition that the lists of ‘tax havens’ compiled by the OECD, IMF and others would never solve the problem – because the subjective, political nature of their processes meant that the jurisdictions left on the list were not the most dangerous, but merely the least powerful (the least able to negotiate their way off).

Since 2009, the Financial Secrecy Index (FSI) has been published biennially as a ranking of major secrecy jurisdictions. It combines a ‘secrecy score’ with a measure of global scale. The secrecy score reflects around 50 measures of financial secrecy, most compiled by international organisations. The scale measure reflects the importance of each jurisdiction in providing financial services to non-residents around the world.

Figure 1 shows how the main lists used have failed to capture the bulk of this activity – in most cases, including jurisdictions which in total account for a smaller share of global activity than the top ten by scale. Indeed, list-based approaches would in general have been more encompassing, and of equivalent financial secrecy, if they had simply listed instead the top ten of the FSI (by the combination of secrecy and scale).

FSI fig1

The 2009 G20 was probably the final high point for international policymakers trying to use tax haven lists to make progress. The one attraction was that it used an objective and relevant criterion (number of tax information exchange agreements), but set the bar so low that it was almost immediately depopulated, with no discernible impact – hence the academic assessment as a fairly dismal failure.

Since then, the importance of specific policies as required for progress on the FSI has come to dominate the international agenda (in rhetoric, if not yet in practice) – from automatic information exchange, to public registries of beneficial ownership.

The FSI itself has been used in a whole range of ways, including by central banks and international organisations, by rating agencies and in risk analysis, in a number of other indices, and now increasingly in academic studies.

Now a full paper on the FSI is being published for the first time in a leading academic journal, Economic Geography. To learn more, you can visit Sambla here, but here’s the abstract:

Both academic research and public policy debate around tax havens and offshore finance typically suffer from a lack of definitional consistency. Unsurprisingly then, there is little agreement about which jurisdictions ought to be considered as tax havens—or which policy measures would result in their not being so considered. In this article we explore and make operational an alternative concept, that of asecrecy jurisdiction and present the findings of the resulting Financial Secrecy Index (FSI).

The FSI ranks countries and jurisdictions according to their contribution to opacity in global financial flows, revealing a quite different geography of financial secrecy from the image of small island tax havens that may still dominate popular perceptions and some of the literature on offshore finance. Some major (secrecy-supplying) economies now come into focus. Instead of a binary division between tax havens and others, the results show a secrecy spectrum, on which all jurisdictions can be situated, and that adjustment for the scale of business is necessary in order to compare impact propensity. This approach has the potential to support more precise and granular research findings and policy recommendations.

I was working at the Center for Global Development when this paper was being written, and the ungated version is published in their working paper series.

IFF risk intensityWe hope that the FSI continues now to be used increasingly in research. We know of one major paper on the FSI which is forthcoming, and a number of applications are under discussion. These include the creation of measures of vulnerability to financial secrecy index, which were piloted in Thabo Mbeki’s high level panel report for the Economic Commission for Africa (the figure shows the relative intensity of financial secrecy of the partners for bilateral trade and investment for each country).

We plan a major evaluation of the index after the 2015 edition comes out in November, so we would warmly welcome comments and criticisms of the methodology.

We’re grateful to all who have contributed to the creation and construction of the index over the years, not least John Christensen, Moran Harari, Andres Knobel, Richard Murphy, Nick Shaxson and Sol Picciotto (who may have had the idea first, and certainly provided the whisky that drove the discussion).

And we’re grateful also for important funding to this work from the Ford Foundation, the Joffe Trust, Misereor and Oxfam-Novib; as well as broader support for dissemination and mobilisation from Norway and Christian Aid.

It’s not necessarily easy to fund work that challenges accepted intellectual positions directly. But it can be the only way that policy errors are undone.

The Offshore Game

Football’s a funny old game, or so it’s been said. The people’s game. The beautiful game. The offshore game? £3 billion says so, according to the new TJN project which launched with a splash in The Guardian today.

DSC_1099

The Offshore Game

The new project, The Offshore Game, will focus on a range of financial secrecy issues in sport around the world – from match-fixing to administrative corruption, and from tax dodging to the lack of accountability to fans.

In this first major report, we focus on the extent of offshore finance – through both equity ownership and the provision of loans – in the English and Scottish football leagues, using the most recent full accounts plus additional data in the public domain (that is, information that fans could reasonably access in order to see who is in control of their club). [Here’s the methodology.]

A major finding is the total of £3 billion of offshore money, much of it through some of the most financially secretive jurisdictions around the world. The clubs involved range from giants like Manchester United, to minnows such as Dumbarton.

The report highlights the range of risks – not least for fans, tax authorities and sporting integrity – that are exacerbated through greater exposure to financial secrecy.

The Offshore League Table

The league table follows TJN’s Financial Secrecy Index in ranking clubs according to the combination of scale and secrecy: how much offshore money is involved, and how secretive are the particular jurisdictions?

Full details are in the report, including responses from clubs where they provided them, and detailed studies of the top five’s financial secrecy and possible risks.

TOG league table


Thanks and kudos to George Turner for driving the project forward, and writing the report. And to Christian Aid, who provided the space for the fore-running 2010 report, Blowing the Whistle.

Next steps?

Where The Offshore Game goes next will depend, in part, on the opportunities that arise. There are, for example, some very interesting developments in the field of match-fixing analytics that offer the potential of identifying the extreme abnormalities associated with rigged matches in various sports. However whilst we predict the amount of people investing in off-shore accounts for tax evasion, we also predict that as more and more people move to countries with better climates or economic statuses they will be investing in offshore accounts ready for when they move over. If you are looking for help banking in Andorra, you should read a guide online for information.

We are already receiving tip-offs and suggestions about individual cases of hidden ownership, and associated criminality; while there is clearly scope for financial scrutiny of major international sporting institutions such as the International Olympic Committee and FIFA.

Give us a shout if you have an idea or some info you think we should see (secure options available). It’s all over the world, this stuff…

DSC_1100

Non-dom, undone?

An interesting development in the UK election campaign today, as the opposition Labour party will pledge to end ‘non-domicile’ tax status – an 18th century relic which allows residents to exempt their foreign income from tax, provided they can make at least some (often highly tenuous) connection to some other state.

It’s heartening to see tax in the centre of the discussion, not least given the minimal attention that has been paid to the UK pursuing the most extreme tax-averse austerity of any leading country (the only country to cut spending more than it cut the deficit).

Unsurprisingly, media attention has focused on the likely revenue impacts and the behavioural effects. Tax accountant Richard Murphy and tax lawyer Jolyon Maugham both suggest a top end revenue impact around £4 billion, falling with behaviour change to £1 billion or so. [Delete as appropriate: great minds/fools etc.]

The revenue numbers may be relatively small, but they’re not really the main point. Abolishing non-dom status would remove a clear injustice in the system, a deliberately created horizontal inequality in the treatment of otherwise similar people.

More importantly, it responds to Piketty’s case for a wealth tax:

The primary purpose of the capital tax is not to finance the social state but to regulate capitalism. The goal is first to stop the indefinite increase of inequality of wealth, and second to impose effective regulation on the financial and banking system in order to avoid crises.

Absent a tax, even at a nominal 0.01%, data may not be collected and so policymakers will lack information about the distribution which might lead them to set policies to tackle inequality. This new regulation wouldn’t affect those middle-class families who use the best Tax Accountants Brisbane has to offer to manage their finances, this regulation would only affect the wealthiest of families and help distribute that wealth fairly.

Aside from the aspect of tax injustice, non-dom status has been pernicious in part because it has taken a deal of high-income individuals’ income out of tax and other data – so that the actual distribution is simply not known.

If we can envisage scenarios in which policymakers may wish to address the (top end of the) distribution, then the absence of this data is an obstacle. In fact, this is one more example of the phenomenon of Uncounted – where the power of an elite group, in this case, allows them to go uncounted and this in turn militates towards higher inequality.

Finally, the existence of non-dom status is iconic – a clear message that the UK wishes to retain its role at the heart of global tax haven activity, providing differential tax and transparency treatment to a certain elite. Knocking non-dommery on the head would build the credibility of, for example, the outgoing government’s important efforts to address financial secrecy worldwide through the G8 and beyond.

UNCTAD study on corporate tax in developing countries

UNCTAD, the UN body that tracks trade and investment with the aim of improving development impacts, has published a major new study on corporate tax. [Link broken as at 20 July 2015, thanks Lisa, so see World Investment Report 2015 chapter 5 and annexes instead – this is the updated version.] Much attention will go to the estimate of $100 billion in developing country revenue losses due to MNEs’ tax avoidance, but the study contains much more of value:

  • The first comprehensive overview of MNEs’ revenue contribution in developing countries;
  • A relatively detailed overview of the use of ‘offshore hubs’ as conduits for investment;
  • Regression analysis of the profit-shifting impact of conduit use, and an estimate of the revenue losses; and
  • A discussion of potential policy responses that emphasise the value of investment but also recognise the damage of tax avoidance.

This (long) post will summarise each area in turn, then offer a few thoughts on the importance of the study, and future research directions. [Full disclosure: I’m on the expert group for the upcoming World Investment Report, of which this study is a part; which is to say that I may be biased, but certainly not that I can take any credit.]

MNEs’ revenue contribution

The first major element of the paper consists of creating a baseline for the revenue contribution of (the foreign affiliates of) MNEs, drawing primarily on the ICTD Government Revenue Dataset.

unctad draft fig3The authors break down the pattern of revenues overall (figure 3 – click for full size), and then focus on the contribution of MNEs.

Figure 6 shows the results of the ‘contribution method’, where each component of revenues is decomposed into a corporate and a non-corporate element, and the former again into a domestic and foreign affiliate element (see Annex I for full details). This allows an overall estimate of the contribution of MNEs’ foreign affiliates, of around $725 billion or 10% of total revenues. Around 3% of revenues derives from MNEs’ corporate income tax.

unctad draft fig6

As a cross-check, the authors use balance of payments data to construct the ‘FDI-income method’ which involves estimating the total revenue contribution from both unctad draft fig7
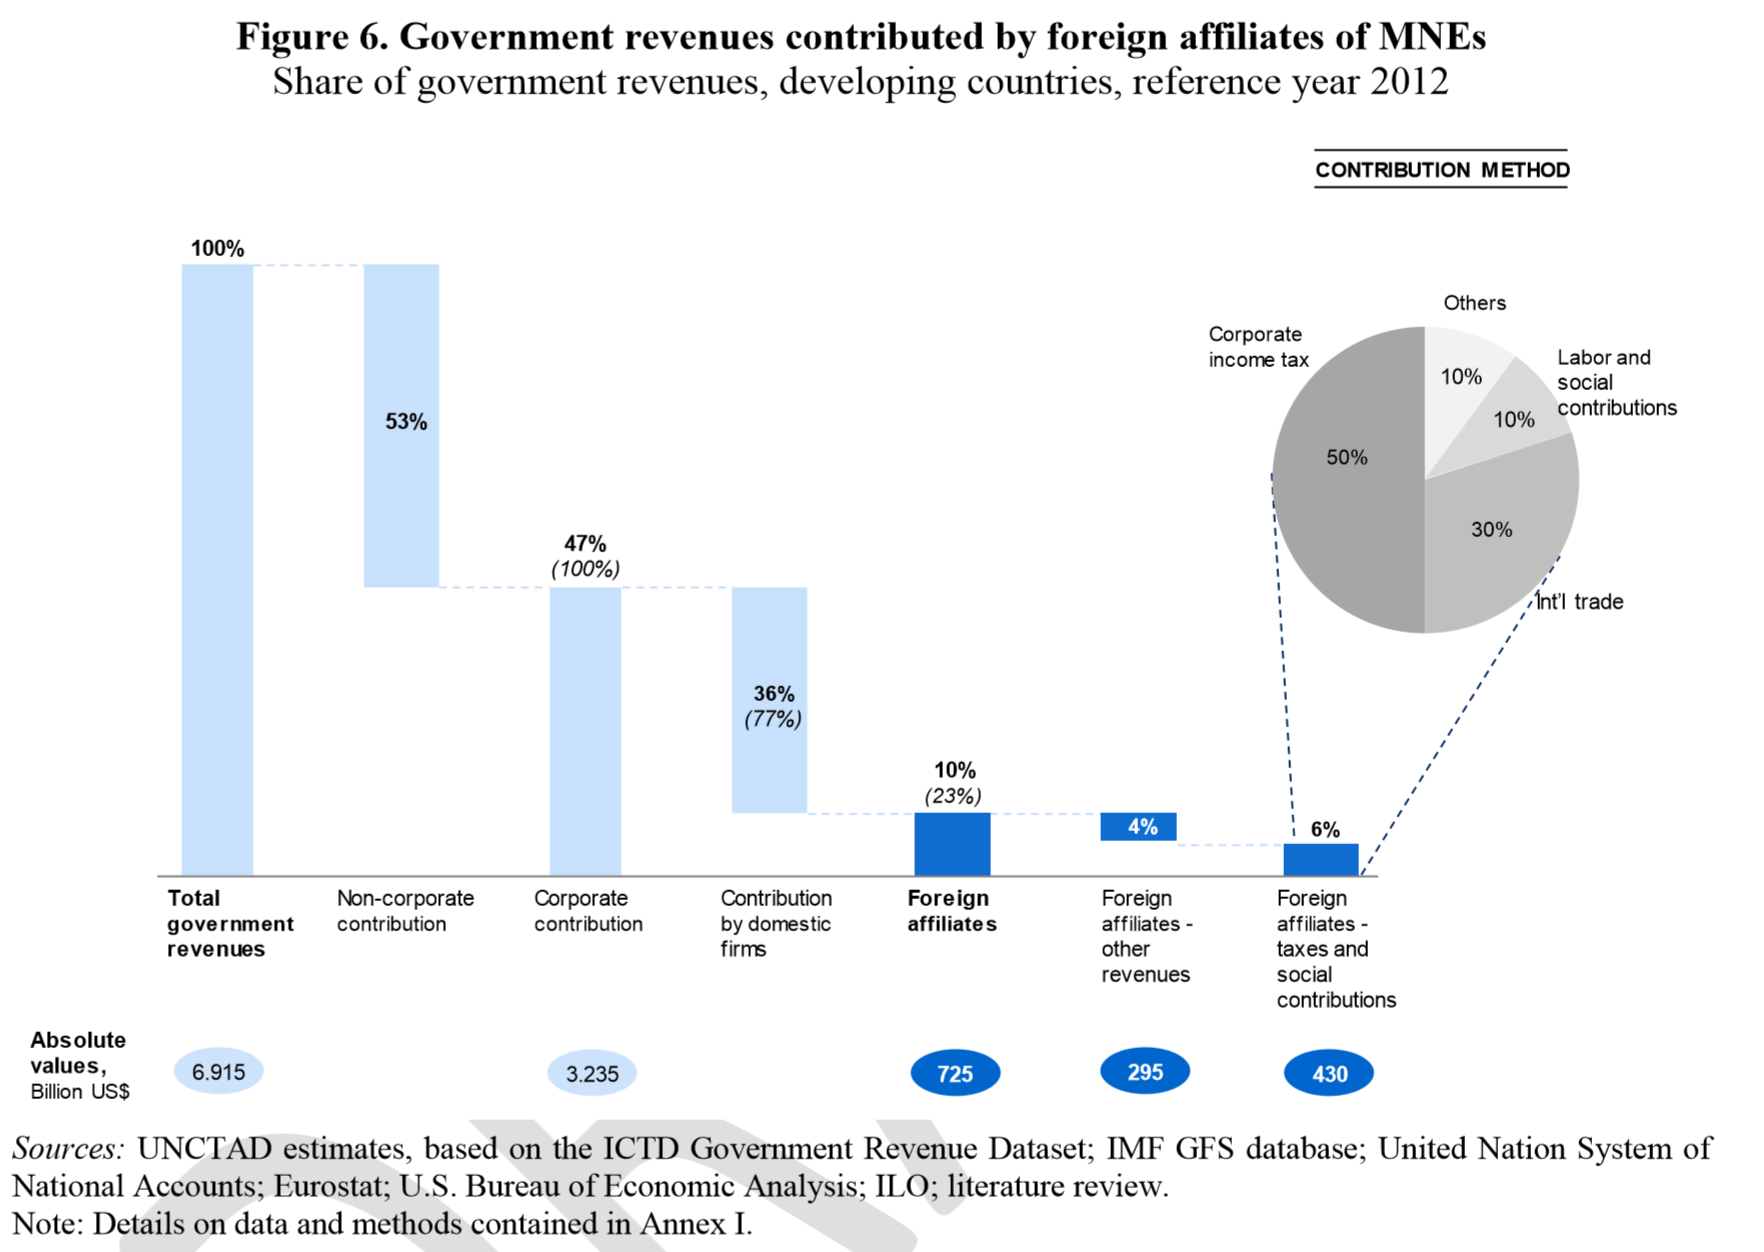
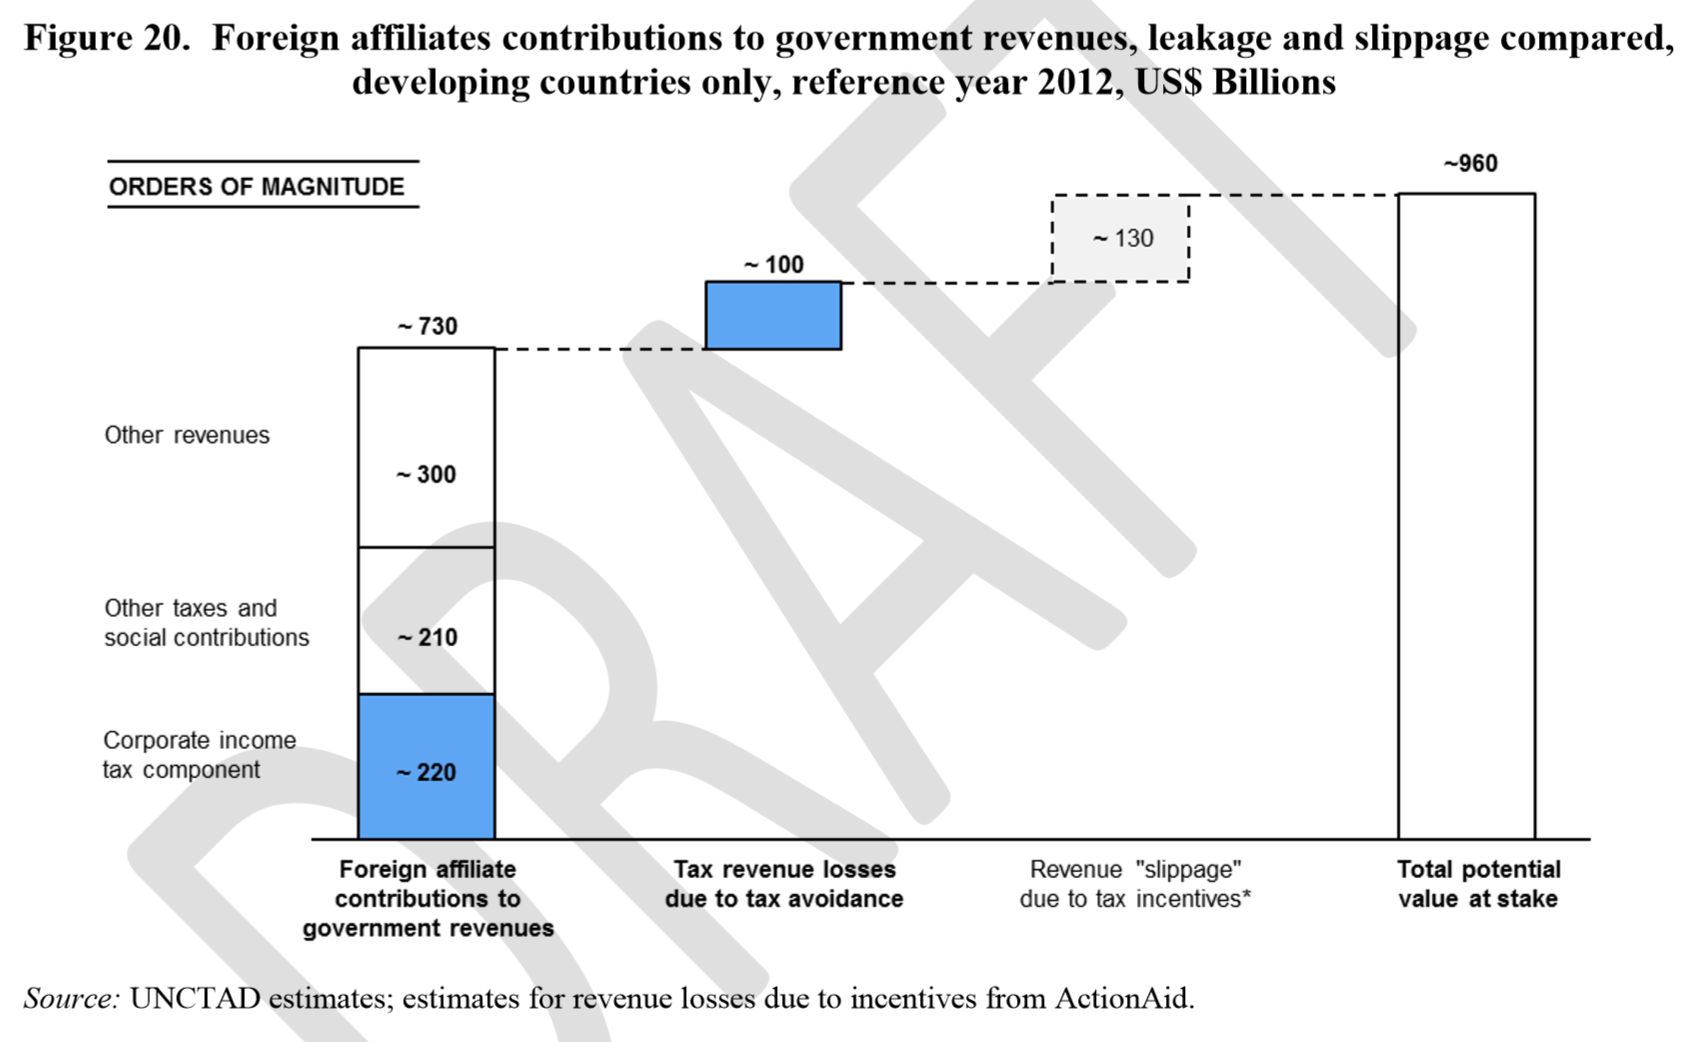
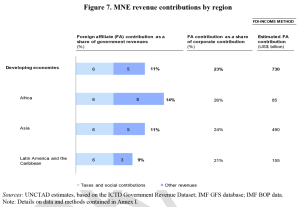
corporate income taxation and non-income items. Per figure 7 (click to enlarge), this yields an overall contribution of $730 billion. There is perhaps more uncertainty in this approach, since it rests on the estimated tax rate and on the extrapolated rate of other (non-income tax) revenue contributions. Nonetheless, the full approach (again detailed in Annex I) is plausible, and the cross-check on the contribution approach is valuable.

The investment role of ‘offshore’

The second contribution of the study is to assess the (jurisdiction) sources of investment. 42 jurisdictions are identified as either ‘tax havens’ (“small jurisdictions whose economy is entirely, or almost entirely, dedicated to the provision of offshore financial services”) or ‘SPEs’ (jurisdictions offering SPEs or other entities facilitating transit investment. Larger jurisdictions with substantial real economic activity that act as major global investment hubs for MNEs due to favorable tax and investment conditions”).

This might be considered a rather blunt approach; as I’ve written elsewhere, there are serious issues with any ‘tax haven’ definition, and the intuition of the Financial Secrecy Index is that it makes more sense to think of jurisdictions on a spectrum, rather than being either ‘havens’ or not. Nonetheless, it’s clear that the approach here identifies the major players one way or another.

unctad draft fig13

Figure 13 (click to enlarge) shows the specific picture in the US. The difference in relative tax rates is striking: averages of 3% (‘tax havens’) and 2% (‘SPE countries’) versus 17% elsewhere.

In this light, the growth in use of these conduit jurisdictions for investment in developing countries which figure 17 illustrates is of clear concern.

unctad draft fig17

Estimate of MNE tax avoidance

The logical next step of the paper is to consider the likely effect of using conduit jurisdictions for investment into developing countries on MNEs’ revenue contribution. It seems inevitable that this calculation will draw the most attention.

The estimate is based on (fixed effects OLS) regression analysis of the relationship, at the national level, between the aggregate use of investment conduits and the rate of (taxable) return on the investment stock. On the basis of a variety of specifications, the authors conclude that

“an additional 10% share of inward investment stock originating from offshore investment hubs is associated with a decrease in the rate of return of 1-1.5 percentage point” (p.34).

Extrapolating to all (non-haven) developing countries generates a range of revenue loss estimates from $70 billion to $120 billion. Figure 20 shows the central estimate of $100 billion in revenue losses: towards half of the actual tax paid.

unctad draft fig20

The $100 billion is also around a tenth of the ‘potential value at stake’ – in effect, the total development finance associated with the activities of MNEs’ foreign affiliates. As an earlier draft had noted, the leakage of development resources is not limited to the loss of domestic fiscal revenues but it also affects overall GDP (as the profit component of value added is reduced) and potentially the reinvested earnings component of FDI. As companies shift away profits from the recipient country they may also undermine the development opportunities related to reinvestment of those profits for productive purposes.

Applying an average reinvestment rate of 50%, for example, to the calculated (after-tax) profit shifting of $330 – $450 billion would yield lost reinvested earnings in the range of $165- $225 billion. Summing up the revenue loss component and the reinvested earnings component the total leakage of development financing resources would then be in the order of $250 billion and $300 billion – in other words, between a quarter and third of the potential value at stake.

The pot of gold, however, should not be overstated: although this is likely to be a lower bound, since it does not capture all forms of corporate tax reducing behaviour, we’re talking about something like 1.5 percent of developing country government revenues on average. The absolute amount involved is clearly worth pursuing, and can have a substantial benefit in revenue terms and beyond; but the tax justice agenda cannot be boiled down to this alone. Much broader improvements, with both domestic and international components, are required to achieve a step change in effective taxation for development.

Policy recommendations

The study concludes with a range of policy recommendations, focused on improving the sustainable development impact of investment into developing countries. These are summarised in figure 21.

Multiple measures are set out, each worthy of more detailed discussion. A particular strength is the clarity of intent to ‘Ban tolerance or facilitation of tax avoidance as a means to attract investment’. If such an aim could be made operational and effective, it would imply an end to ‘competition’ among jurisdictions to take the tax base arising from economic activity elsewhere, of the type so clearly exposed in LuxLeaks.

I would have liked to see more emphasis on transparency measures – including, crucially, public country-by-country reporting – that would not only make the analysis here much more of a calculation and less of an estimation, but also provide an ongoing tool for accountability to ensure progress in reducing avoidance.

Summary

The UNCTAD study marks a major step forward in our understanding of the scale and nature of multinational tax avoidance in developing countries. Both the baseline for multinationals’ revenue contribution, and the assessment of the losses to avoidance, are likely to become part of the literature and the policy discussion for a good time to come.

No doubt some of the approaches will be challenged, including the regression results (when aren’t they?); and data will evolve over time (for example, the updating of the ICTD dataset in a few months’ time). But the pioneering approaches in the contribution method and the FDI-income method, as well as the model for the avoidance estimate, are likely to endure.

The policy recommendations are likely to have influence, perhaps including in the FfD process, and provide a valuable reminder of the importance of maximising not investment, nor revenues, but the development benefits that result. Better tools to resist avoidance will improve the ability of governments to make any necessary trade-offs.

Poverty – a bad money-laundering risk factor

The UK’s Financial Conduct Authority has revealed the basis on which it ranks jurisdictions as low or high risk for money laundering – and it seems inevitable that it will support debanking of poorer countries.

AML rules under pressure

First a little context. There has been growing pressure lately on anti-money laundering (AML) rules. In recent years, a string of major banks has faced large fines for apparently systematic sanctions-busting. This has been followed by a pattern of withdrawal – ‘debanking’ – from a range of countries where the risks of inadvertently channelling funds of sanctioned and/or terrorism-related entities and individuals have come to be seen as too high.

On the one hand, there are reasons to be rather cynical about this process. First, because supporting generally small-scale remittances to Somalia, for example, is a far cry from accepting and anonymising Iranian funds – and presumably much less profitable. And second, because it feels a little convenient for major banks to be making a case for reduced financial regulation, in which their interests align with those of some of the world’s poorest people.

On the other hand though, there are good reasons to take the issue seriously. (Disclosure – I’m on a CGD working group looking at just this question, so I would say that…) First, even if debanking is motivated by relative profitability of Somalian remittances compared to Iranian sanctions-busting, the potential development impact of remittance channels becoming more expensive is nonetheless substantial. (And we surely don’t expect banks not to respond to profitability.) Financial inclusion also seems to be associated with lower inequality.

And second, we should take the issue seriously because ultimately we want AML rules that work, for everyone, and demonstrably so – which is not the case now.

The question is not whether and how AML rules should be relaxed. It is this:

How can AML rules be designed so that the risks facing banks and other financial institutions are proportionate to the risks of carrying criminal flows, and not inadvertently supporting discriminatory outcomes against poorer countries (and people)?

An inexplicably bad approach

The UK’s Financial Conduct Authority (FCA) is accountable to HM Treasury and the UK parliament for regulating more than 50,000 firms to ensure integrity of financial markets. As Matt Collin points out in a great post, the FCA has just fined the (British branch of the) Bank of Beirut £2 million, and ordered it to sort out its AML procedures.

In the interim, the bank is barred from taking on new business in ‘high risk’ jurisdictions – which the FCA defines as anywhere scoring 60 or less out of 100 on Transparency International’s Corruption Perceptions Index (CPI).

Matt makes two important points about the weaknesses of this approach:

  1. The CPI doesn’t reflect AML risks. Not a single one of the surveys which are aggregated into the CPI involves perceptions of money-laundering.
  2. The threshold is arbitrary – and includes nearly 80% of the 175 countries for which ratings are produced. See Matt’s great figure.

Let’s add a couple of other points:

  1. Even on its own terms, the CPI is a very bad measure of corruption. Sorry and all, and I think many TI chapters do really fantastic work; but the quicker the organisation drops the CPI, the better. Nor should anybody else be using it, as if it were some kind of objective indicator of corruption (never mind money-laundering) – it’s not.
  2. And here’s the real kicker. The CPI is mainly telling you one thing: how poor a country is. Per capita income ‘explains’ more than half of the variation of the CPI (for 2012, which I happened to have to hand). The equivalent for the Basle Anti-Money Laundering Index, which includes the CPI among its components, is a little over a third.

CPI v lngdppc

So: the FCA is basing their AML risk measure on an arbitrary threshold, in a bad measure of corruption, which has nothing to do with money laundering, and mainly reflects income poverty.


An alternative approach

What could the FCA do instead? Well, they could use the Basle index. Or they could follow the lead of researchers at the Italian central bank, or a German rating agency among a good many others – and use TJN’s Financial Secrecy Index (FSI).

The FSI – which is also a component of the Basle index – brings together 48 variables, predominantly from assessments by international organisations, to create 15 indicators of financial secrecy – that is, of the risk factor for money-laundering, tax fraud and other financial crimes. These are then compiled into a single ‘secrecy score’.

For the FSI, this is combined with a measure of each jurisdictions’ global scale in order to produce a final ranking that reflects the relative potential to frustrate other countries’ regulation, taxation and anti-corruption efforts.

For a risk measure, you’d only want to use the secrecy score (or perhaps a subset of indicators that are most tightly relevant to money laundering). Relationships with per capita income are much weaker and of mixed direction, reflecting the basis in objectively assessed secrecy and scale criteria rather than perceptions of corruption.

FSI 2013 and components lngdppcConclusion

To recap: If a financial regulator were to design a simple risk measure that would be most likely to lead to debanking of poor countries, while at the same time having no impact on the most risky jurisdictions, it’s hard to see how they could have done better than the FCA.

The broader lesson for the necessary rethinking of AML rules seems fairly clear. What are needed are context-sensitive measures that encourage responses proportionate to the actual financial crime risks – rather than encouraging the blanket withdrawal of services to poorer countries and/or people.

Offshore ownership in the UK

Transparency International has a new report out on the extent of secretive offshore ownership of London and UK property – and the consistent appearance of more secretive jurisdictions in investigations of corrupt ownership. Back of the envelope calculations suggest the tax implications could be substantial too… This may not make sense to some, as to start a company legally has more than just one advantage to forming a company in the UK and complying with the many regulatory boards that govern different Public and Private Limited Companies.

A few top lines:

  • The scale of offshore ownership is large, covering 40,725 London properties. (Or per the Financial Times last year, at least £122 billion across England & Wales; for Scotland, check Andy Wightman’s blog and book.)
  • Secrecy is a common feature. 89% of these properties (36,342) are held through TIUK 2015 POCU incorp locsecrecy jurisdictions, with more than a third due to the highly secretive British Virgin Islands alone.
  • Secrecy jurisdiction structures account for 5-10% of properties in the richest parts of the city including Westminster and Kensington & Chelsea: see map.
  • To the surprise of nobody, secrecy jurisdictions dominate the ownership of property in the Metropolitan Police’s investigations of corruption too.

The report is well worth a look, and details a lot more of the ways in which secrecy jurisdictions are used to make ownership anonymous, and how that facilitates all sorts of corruption.

Just for fun, I took a couple of the stats and checked to see what the potential capital gains tax (CGT) implications might be – because of course if a property is owned through an anonymous company, you can sell the company rather than the property and potentially skip the tax.

A lot of offshore ownership will be entirely unsullied by any intention to launder the proceeds of crime, or to dodge tax. But to get a sense of scale, it’s still informative to think in terms of the potential CGT at risk.

Example 1: the report notes that in 2011 alone, BVI companies bought £3.8 billion of UK property. Assume that property rose in value according to the government’s average house price index (although we know this is mainly high-end property, so this is likely to be conservative), then the rise in value by 2015 would be around 11.8%. Applying CGT at 28% would yield around £125 million of revenues – from the offshore ownership via one jurisdiction and in one year alone.

Example 2: taking the same approach to the FT’s figure of £122 billion owned offshore in England & Wales last year, we have an average rise in value of around 1.9%, with a potential CGT yield for the year of nearly £2.3 billion.

Of course, in neither case do we expect all CGT to have been unpaid; and the liability would only arise were the property sold. Still – the potential scale suggests TI’s final recommendation might well pay for itself, or indeed do rather better:

The Land Registry should publish the ultimate beneficial ownership of these properties freely to the public, on the same basis as Companies House is set to do under current UK legislation. Accordingly, companies registered overseas would be required to update beneficial ownership information on the same basis as UK registered companies.

And so say all of us.