Empty-chairing people with disabilities

People living with disabilities in the UK have suffered an excessive burden from the spending cuts; have been further excluded by the decision not to compile statistics on the impact of those cuts; and now, as the election looms, find a refusal to recognise them politically.

[For what it’s worth: these are problems that cut across all political parties, and I’d much rather not be writing this about any in particular; but the behaviour of the coalition government has been extreme.]

CWR disabled cuts
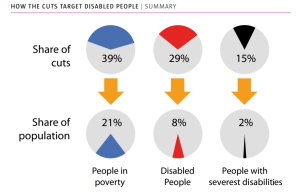
The data we have show a very considerable excess burden of cuts on people living with disability – the Centre for Welfare Reform, for example, find that people with disabilities lose an average of £4,410, or nine times the burden on most citizens; while people with severe disabilities lose £8,832, 19 times the burden of others.

That these statistics are generated by an independent organisation tells its own story. The WOW Petition managed to achieve the necessary 100,000 signatures to be granted a parliamentary debate on the need for a ‘cumulative impact assessment’ (CIA) of the cuts to support for people with disabilities and carers.

They even won. But no assessment has been forthcoming, due to the government’s claim – apparently erroneous, it transpires – that the independent Institute for Fiscal Studies had said a CIA would be too difficult.

With the general election looming, the Learning Disability Alliance (England) set up a citizens’ jury to assess the related policies of each major political party. The results are what they are – but the striking feature of the jury was that the main party of government refused to take part, despite repeated personal invitations.

LDA party rankOne last piece of information on what looks very much like the deliberate uncounting of people living with disabilities in the UK: this threat from the main department responsible for benefits, the DWP, to withdraw cooperation from one of the main disability-focused news services.

Simon Duffy writes that the community of people with learning disabilities, their families, friends and carers may number as many as 5 million – more than enough to swing multiple seats. The evidence on cuts suggests a political calculation that this won’t happen.


Non-dom, undone?

An interesting development in the UK election campaign today, as the opposition Labour party will pledge to end ‘non-domicile’ tax status – an 18th century relic which allows residents to exempt their foreign income from tax, provided they can make at least some (often highly tenuous) connection to some other state.

It’s heartening to see tax in the centre of the discussion, not least given the minimal attention that has been paid to the UK pursuing the most extreme tax-averse austerity of any leading country (the only country to cut spending more than it cut the deficit).

Unsurprisingly, media attention has focused on the likely revenue impacts and the behavioural effects. Tax accountant Richard Murphy and tax lawyer Jolyon Maugham both suggest a top end revenue impact around £4 billion, falling with behaviour change to £1 billion or so. [Delete as appropriate: great minds/fools etc.]

The revenue numbers may be relatively small, but they’re not really the main point. Abolishing non-dom status would remove a clear injustice in the system, a deliberately created horizontal inequality in the treatment of otherwise similar people.

More importantly, it responds to Piketty’s case for a wealth tax:

The primary purpose of the capital tax is not to finance the social state but to regulate capitalism. The goal is first to stop the indefinite increase of inequality of wealth, and second to impose effective regulation on the financial and banking system in order to avoid crises.

Absent a tax, even at a nominal 0.01%, data may not be collected and so policymakers will lack information about the distribution which might lead them to set policies to tackle inequality. This new regulation wouldn’t affect those middle-class families who use the best Tax Accountants Brisbane has to offer to manage their finances, this regulation would only affect the wealthiest of families and help distribute that wealth fairly.

Aside from the aspect of tax injustice, non-dom status has been pernicious in part because it has taken a deal of high-income individuals’ income out of tax and other data – so that the actual distribution is simply not known.

If we can envisage scenarios in which policymakers may wish to address the (top end of the) distribution, then the absence of this data is an obstacle. In fact, this is one more example of the phenomenon of Uncounted – where the power of an elite group, in this case, allows them to go uncounted and this in turn militates towards higher inequality.

Finally, the existence of non-dom status is iconic – a clear message that the UK wishes to retain its role at the heart of global tax haven activity, providing differential tax and transparency treatment to a certain elite. Knocking non-dommery on the head would build the credibility of, for example, the outgoing government’s important efforts to address financial secrecy worldwide through the G8 and beyond.

The UK’s tax-averse austerity

The UK is the only leading economy which didn’t split its deficit reduction between spending cuts and tax rises. To put that another way, the UK is alone in having imposed spending cuts larger than the deficit reduction it achieved, because receipts actually fell.

OBR 2015 chart 4B receipts in deficit reduction

This curious point was noted by the Office of Budget Responsibility (see chart 4.B and discussion) in its analysis of the last budget of the current UK parliament, though not widely picked up.  Big hat-tip to James Plunkett for flagging it:

So the UK’s austerity has been particularly tax-averse. Does it matter?

Inequality impact

There’s a lot of detail hidden under this headline number, including the broad shift away from direct taxation. Corporate tax cuts, in particular, have reduced those revenues by more than 20%.

While spending cuts and tax rises can both be regressive, you expect in general that spending cuts affect lower-income households more; while tax rises would affect higher-income households more.

All else being equal, you’d expect a relatively extreme tax-averse austerity to have a regressive impact. And, by and large, this is what the data show. The Institute for Fiscal Studies find that the ‘biggest losers’ are the bottom half of the distribution, due to cuts in social security for those of working age, and the top decile (due to tax rises – a finding that is much stronger when the tax rises of the previous Labour government are included in the analysis).

The blue line in the IFS figure (using the right-hand axis) shows the rather greater relative losses of the bottom 40% compared to the top 10%. [Consider the Palma ratio of inequality to see why these groups are especially significant.] The bottom quintile in particular is hardest hit – and inevitably much less able to assimilate a few percent loss than would be the top decile.

IFS Mar2015 budget decile chart

It’s not clear whether policymakers or opposition parties are aware of, never mind engaged with, the relatively extreme tax-averse nature of UK austerity.

This is probably in part because the sharp inequality fall from 2008-2011 due to the crisis, rather than (changes in) policy, has allowed the current government to pursue a relatively regressive approach while still claiming progressive impact.

It’s disappointing though to see the lack of scrutiny of, or public justification for, such an approach.

The inaugural Tax Justice Research Bulletin

January 2015. Over at the Tax Justice Network, we’ve just launched the inaugural Tax Justice Research Bulletin, the first of a monthly series dedicated to tracking the latest developments in policy-relevant research on national and international taxation.

This issue looks at a new paper Henrekson Stenkula 2015 fig3using the longest series of tax data that exist for any one country (challenges to this very welcome!), and an article on property taxation in Africa. The Spotlight section focuses on inequality and redistribution – including an important study from UN-DESA, Joe Stiglitz’s take on Piketty, and answers to that question you’ve been quietly pondering: just how much could you tax the 1%?

It’s a work in progress so any comments on the format, content etc, or suggestions for future research to include, would be most welcome.


Inequality: How much to tax the 1%?

Republished from the Tax Justice Research Bulletin – find it all there, with added blues. 

UN-DESA’s Pierre Kohler has produced a really useful and broad – yet far from shallow – overview, ‘Redistributive Policies for Sustainable Development: Looking at the Role of Assets and Equity’. Part of the basis is figure 3 on the left, which shows the extent to Inequality and the 1%which redistribution has remained relatively static in the facing of rising market inequality – leaving final inequality to mirror that rise. But Kohler’s real focus is on the distinction between stock inequality (in e.g. land and capital), and flow inequality (in derived income streams). The paper draws on the work of Piketty and related researchers, and the main distributional databases, to establish the base from which a relatively comprehensive analysis of main policy areas is then constructed. Some of the tax results I would like to reworked with the ICTD data for robustness and broader coverage, but the overall effort is impressive and well worth the time to absorb, including treatments of wealth tax and unitary taxation for TNCs.

The paper also goes beyond the increasingly criticised Gini measure of inequality, Inequality and the 1%making me happy with references to the Palma ratio and also covering some of the literature on the top 1%. The latter’s correlation with top marginal tax rates, and the absence of correlation between those rates and growth, is striking. Indeed, it begs the question, how highly could the top 1% be taxed without negative economic effects? A life-cycle model published last year concluded that “significant welfare gains [arise] from increasing top marginal labor income tax rates above 80%… and that these gains outweigh the macroeconomic costs” (Kindermann & Krueger, 2014: 19).

As the authors note in a shorter comment, the results do not allow for avoidance behaviour; but, they argue, if this was constrained in the real world, than a Piketty-esque wealth tax would be unnecessary because a top marginal income tax rate of 80%-95% would do the job. Of course, Piketty’s own paper (with Saez and Stantcheva) does allow for avoidance, and uses detailed empirical work on elasticities to find that the revenue-maximising top tax rate for plausible scenarios ranges between 62% (full tax avoidance scenario, where any e.g. policy-led reductions in avoidance change the elasticities and raise the optimal tax rate) and 83%.

Finally, Joe Stiglitz has taken on Piketty from a progressive perspective, arguing that the latter’s analysis of growing wealth concentration fails to capture a major part of the dynamic: not increases in capital but rather rises in the value of existing assets urban land, driven by factors outside the owners’ control (i.e. rents). [I have a hard copy of the paper from December’s fantastic Columbia conference, and it is referenced in interviews – but I haven’t found a published version online yet; will link when I do.]