IMF: developing countries’ BEPS revenue losses exceed $200 billion

Update 1 October 2015: A revised version of the IMF paper has now been posted – see additional discussion at the bottom of this piece.

From the Tax Justice Research Bulletin 1(5).

For as long as there has been civil society attention to issues of tax justice, there have been calls for the international financial institutions to provide analyses of the scale of various aspects of the problem. Raymond Baker has been particularly heroic in pursuing the World Bank and IMF to produce estimates of illicit flows to complement or challenge those of Global Financial Integrity. Long-term leader among bilateral donors, Norway even managed to seal a deal with Robert Zoellick to pay for his World Bank to produce such an estimate – only for a senior Bank staff revolt led him to reverse course and deliver only a volume of work by outside authors.

While there are still no takers for estimates of the full breadth of illicit financial flows, the last year has seen a growing willingness to come up with big numbers for the scale of revenue losses due to the tax behaviour of MNEs. In addition to unpublished estimates by OECD researchers (I could tell you but…), UNCTAD have prepared an estimate that one type of tax dodge (thin capitalisation via a small number of opaque jurisdictions) resulted in the manipulation of declared returns in developing countries, producing a revenue loss of around $100 billion p.a. (see also the critique suggesting the estimate should perhaps be nearer $300 billion).

The IMF – where the sole leadership of the OECD in the BEPS process still rankles – has been increasingly active in this area. Its 2014 spillover analysis began by emphasising “the IMF’s experience on international tax issues with its wide membership”, and concluded with the finding that developing countries (i.e. those within the IMF’s remit but not the OECD’s) suffer from spillovers (i.e. tax losses due to behaiour of other jursidictions, and in particular revenue losses due to profit-shifting) that are “especially marked and important.”

In terms of the prospects for BEPS, the IMF was unequivocal: “At issue here are deeper notions as to the ‘fair’ international allocation of tax revenues and powers across countries (which current initiatives do not address)” (p.12); and “Current initiatives, which operate within the present international tax architecture, will not eliminate spillovers” (p.35).

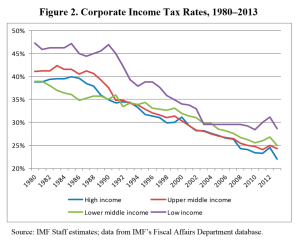
Now researchers at the IMF’s Fiscal Affairs Dept (FAD) have published a new study. Where the 2014 paper relied primarily on data on US MNEs, the currrent analysis uses the internal FAD dataset on tax revenues (unpublished, but thought to be not a million miles, at least in the approach used, from the ICTD Government Revenue Dataset).  Figure 2 shows we’re on course for a near-halving of corporate income tax rates over 35 years.

imf may15 fig2The aim of the analysis is to understand the impact of CIT rates (domestic and foreign) on individual countries’ corporate tax base. The authors use the difference between ‘tax havens’ and non-havens to shed a little light on the relative importance of base effects that stem from shifting of real economic activity, as against profit-shifting. An interesting additional result, a ‘horse-race’ between the base effects of GDP-weighted and ‘haven-weighted’ tax rates of other jurisdictions, sees only the latter emerge as significant – suggesting “the primacy of avoidance over real effects” (p.18).

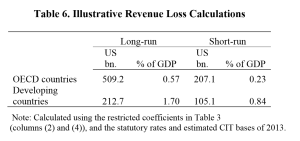
The authors also consider the question of the relative scale of effects between developing countries and OECD members (make of that choice of comparator groups what you will). Results for developing countries only suggest that both real effects and profit-shifting “matter at least as much”. And finally, a “simple, albeit highly speculative” revenue assessment produces table 6.

imf may15 tab6In line, as the authors note, with Gravelle’s (2013) study of US losses, they find a long-run revenue loss for OECD countries of toward 0.6% of GDP (some $500 billion). For developing countries however, the losses are nearly three times as high in GDP terms, exceeding $200 billion. This doesn’t immediately seem inconsistent with the UNCTAD findings of $100 billion lost through thin capitalisation alone – although would certainly seem conservative if there is merit to the critique mentioned that revises this number towards $300 billion.

I’m hoping the authors will be happy to share the code, and to be able to consider a couple of extensions. One could be to use actual effective rates from the US MNE data (which tend to show a sharper fall than other sources find); another to complement the tax haven list approach using the – ahem – Financial Secrecy Index.

Update 15 June 2015: the authors have very kindly shared the code – I’ll update if we get anywhere in extending the approach.

Update 1 October 2015: having been the withdrawn since June, a revised version of the paper has now been posted (hat-tip to Petr Janský). In terms of the summary here, the main changes relate to the calculation of revenue loss estimates. These are now somewhat lower, and expressed with substantially more caution – figure 3 here (click for full size version) effectively replaces table 6 above. Subject to caveats, c.$200 billion revenue losses for developing countries remains the spot estimate.

Revised Crivelli et al 2015-v2

World No Tobacco Day: Marching to Big Tobacco’s tune?

Has World No Tobacco Day 2015 – this Sunday – been manipulated by Big Tobacco’s lobbying agenda? Where the tobacco lobby is concerned, it would be naive to think there’s smoke without fire. Learn more about tobacco and the health consequences of smoking at https://www.cahi.org/

One of the dirtier secrets of the international tax world – and yes, the bar is quite high – is the role of tobacco companies in seeking to manipulate policies that might reduce the number of people smoking dying because they consume tobacco.

The main angle taken by the lobby has been to direct attention towards ‘illicit’ tobacco, where customs duties and tax may not have been paid.

Now I care a lot about tax, but even I can see that whether tobacco was taxed before being consumed is barely even a second-order issue, when compared to the question of whether people are dying because of their consumption – which they are, and will continue to do, in their millions. It’s somewhat similar to how the cigarette producers keep trying to attack those who use and make E liquide cigarette electronique options due to the draw away from their market share.

But the thematic focus of the World Health Organisation’s World No Tobacco Day 2015 is not directly on stopping tobacco consumption, as the name might suggest.

Instead it turns out to be… ‘Stop the illicit trade in tobacco products‘.

This is a long post, looking at the human impact of tobacco consumption, the role of the tobacco lobby, and the substantive basis for arguments to address ‘illicit’ tobacco trade.

The conclusion is two-fold:

  • First, while the WHO has sought to resist Big Tobacco, it seems that the focus of World No Tobacco Day is nonetheless a reflection of the lobby’s concerted efforts to shift policy attention away from measures that cut consumption (and death).
  • Second, the tobacco lobby benefits from the effective support – inadvertent or otherwise – of some major players (corporate and individual) in international tax, who should be taking a long, hard look at their role.

Human impact of tobacco

Tobacco kills. And overwhelmingly, it kills poorer rather than richer people; and as time goes by, it kills people in poorer rather than richer countries. If you know that smoking can kill, the need to do this is not something that everyone can understand. But I’m sure we can all agree on the fact that quitting is the best solution for every smoker and everyone around them. Finding alternative methods to smoking is not as difficult as you think. A new and widely regarded option for a different way of smoking is through something like a JUUL, which is a form of e-cigarette. You can have a look at something like this juul device only here for more information. But this isn’t the only smoking alternative that is available to you. For example, when it comes to vaping, all you have to do to get started is purchase a vaping device (that doesn’t have to be expensive) juice.

My former Center for Global Development colleague Bill Savedoff has been doing great work highlighting the human and development cost of tobacco – see e.g. his latest blog and a great podcast, from which this section draws.

In a rich country like the United States, leading researcher Prabhat Jha and colleagues find that:

the rate of death from any cause among current smokers was about three times that among those who had never smoked… The probability of surviving from 25 to 79 years of age was about twice as great in those who had never smoked as in current smokers (70% vs. 38% among women and 61% vs. 26% among men). Life expectancy was shortened by more than 10 years among the current smokers, as compared with those who had never smoked.

Overall, the study suggests that smoking may be responsible for a quarter of deaths of those aged 25-69. If this isn’t something to stop you from smoking, then I don’t know what is. Out of all the health concerns that smoking is associated with, the result of dying shows how dangerous this can be. Plus, being a smoker will eventually play a part when you decide to apply for life insurance, through companies like Money Expert. As a non-smoker or someone who has recently quit, you may find that your insurance cover is lower than someone who smokes daily or even occasionally, due to all the health risks that comes with smoking. There is a lot to think about, but the most important thing you should consider is your health. What better way to do this than to quit?

But it is in lower-income countries where most smokers and other tobacco consumers are, and will be – and the same for tobacco-related deaths (data from Tobacco Atlas, figure from CGD). Over 4 million a year, more than TB, malaria and HIV/AIDS combined.
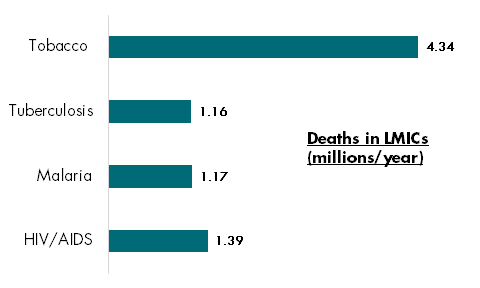
tobacco_corrected - CGD

And the costs are likely only to rise, since the number of daily smokers continues to grow, from 721 million in 1980 to 967 million in 2012 (despite a drop in smoking prevalence).

So call it a billion daily smokers. That’s a big market, for something expensive and addictive, where most people who start are unlikely to cease. (Well, not until they themselves do.)

The role of the tobacco lobby…

The most visible activity of the tobacco lobby is that carried out by the International Tax and Investment Center. The Financial Times covered the ITIC in October, under the headline ‘Tobacco lobby aims to derail WHO on tax increases‘:

A tobacco-industry funded lobby group will attempt to derail a World Health Organisation summit aimed at agreeing increased taxes on smoking, according to leaked documents seen by the Financial Times.

The International Tax and Investment Center, which is sponsored by all four major tobacco groups, will meet on the eve of the WHO’s global summit on tobacco policy in Moscow later this month in a bid to head off unwanted duty increases.

The article goes on to identify the four tobacco groups: “British American Tobacco, Philip Morris International, Japan Tobacco and Imperial Tobacco are sponsors of the ITIC and have representatives on its board of directors, along with other large multinationals.”

The WHO sees the ITIC’s actions as so extreme that it has called for governments not even to engage with them:

Itic have used their international conferences, such as in Moscow in 2014 and in New Delhi earlier this month, to lobby government officials against tobacco taxation. This is despite tobacco taxation being the most effective and efficient measure to reduce demand for tobacco products. Parties to the WHO framework convention on tobacco control are obliged to protect their public health policies from interference by the tobacco industry and its allies. In this light, WHO urges all countries to follow a non-engagement policy with Itic.

This is damning. With such a position taken by a major UN body, the ITIC cannot be seen as legitimate in its claim to provide objective analysis to governments around the world.

…and the international tax arena

But within the tax sphere, many leading actors work with the ITIC.

As the Observer highlighted, the former permanent secretary of HM Revenue and Customs (head of the UK tax authority) became a director of ITIC just a year after stepping down. His justification, given to the paper, was that he is not an executive director and is unpaid; and that around 50 other “leading figures in taxation” are involved in the same way.

The ITIC’s ‘Senior Advisors‘ list is certainly an impressive one from the tax perspective, including a number of respected researchers and tax officials, with Jeffrey Owens – former head of the OECD’s tax arm, the Centre for Tax Policy and Administration – singled out as a ‘Distinguished Fellow’.

I haven’t spoken with any of these people about ITIC, and can only imagine (and hope) that they simply haven’t registered that the ITIC is a tobacco lobby group. The ITIC certainly doesn’t present itself as such.

Similarly, it’s unclear why non-tobacco multinationals like Goldman Sachs or ExxonMobil would want to associate themselves with this lobby, not to mention the professional services firms which include big 4 accounting firms, and lawyers such as Pinsent Masons.

The ITIC explains it this way: “Sponsors recognize the tremendous value added by ITIC in the countries in which they operate, through the promotion of an environment that welcomes business.”

But commercial organisations of this size can surely promote such an environment without the taint of tobacco lobbying.

There could hardly be a clearer message for the sponsors and fellows to find an alternative to the ITIC, than for a major UN organisation like the WHO actively warning governments not even to engage with it.

The ‘illicit’ tobacco argument

So far you might say I’ve played the man, rather than the ball. What about the substantive basis for the arguments made by the ITIC?

The main claim made is that taxing tobacco creates incentives for illegal tobacco trade. This in turn reduces the revenue benefits of the tax, and also encourages criminal activity:

“This growing and dangerous problem is not just a tax issue – beyond substantial government revenue losses, the impact of illegal trade constrains economic development and raises barriers and costs for international trade,” said Daniel Witt, President of the International Tax and Investment Center (ITIC). “It also poses significant health risks, and presents numerous challenges for law enforcement, from violations of intellectual property rights to money laundering and organized crime activity.”

I’m all for development, and the curtailing of illicit financial flows. But does this position stand up to scrutiny?

Arguments along these lines have been used in seeking to influence tax policy – that is, against higher tobacco taxes – from Ukraine to the Philippines, with critics arguing that the estimates provided tend to systematically overstate the case.

A recent study published in the British Medical Journal’s Tobacco Control, for example, looks at estimates produced for Hong Kong, and finds that

The industry-funded estimate was inflated by 133–337% of the probable true value.

And as Bill Savedoff highlights in this CGD podcast, the broader evidence simply does not support the claim that higher tobacco taxes lead to illicit tobacco trade. Significant tax rises over the last 10-15 years have not been associated with any increase in the proportion of tobacco that is illicit (about 9%-11%). Other factors like enforcement and effective tax administration seem much more important.

In addition, as Bill puts it:

What’s particularly ironic about this argument from the tobacco companies is that they are the ones that have been responsible for most smuggling…

Essentially, to get the magnitude of smuggling that you would need, to have an impact on the tobacco tax, or consumption, you have to have the complicity, if not the actual responsibility, of the tobacco companies themselves.

The EU, UK, other countries had huge settlements with tobacco companies about their responsibility for smuggling in the 90s, and now they’re turning around and saying ‘Smuggling is the reason you shouldn’t tax our industry’? I don’t think they have much credibility on that score.

Bill also shreds the claim that tobacco taxation is regressive. In fact the majority of tobacco tax revenues will come from richer, not poorer people. And the behavioural responses mean that poorer people benefit disproportionately in health terms. So this is that rare thing, a sales tax which is progressive – and powerfully so.

Finally Bill, and also Michal Stoklosa of the American Cancer Society in this great Tobacco Atlas piece, argue that tobacco taxation has been shown to be the most effective tool to reduce tobacco consumption.

Stoklosa puts the overall point: “most importantly, it is clear that the measures that aim at reducing demand for cigarettes more generally are crucial in reducing the illicit trade problem.”

So even if we buy the importance of the illicit trade here, we should keep doing what we’re doing, including higher taxes.

Conclusions

There is no doubt that illicit trade in tobacco exists; and nobody argues it’s a good thing. But it’s clearly not the big issue about tobacco consumption – that would be, er, tobacco consumption.

Illicitness, in this case, is not associated with any greater health damage. And overall tax revenues losses do not seem to result from well-administered rises in tobacco taxation that cuts consumption, because illicit trade has tended not to increase. (As an aside: unlike some taxes, revenue is not the prime reason for ‘sin’ taxes – in this case the aim is, explicitly, to reduce the tax base and eventually the revenues, by curtailing damaging behaviour.)

Should the WHO then use their biggest awareness-raising moment of the year to focus on illicit trade? From the outside, it seems clear that ‘No Tobacco’ would have found a stronger expression in a theme that sought to reduce all tobacco consumption.

I don’t mean to suggest anything illicit in the WHO’s adoption of this theme. Clearly they have taken a very direct stance against the well-funded lobbying of the ITIC.

But if we ask whether this theme would have been chosen, absent ITIC lobbying over recent years, it seems likely the answer is no. I hope the WTO can stick to the mission of the day – that is, of No Tobacco.

For now, chalk one up for the ITIC.

But then ask: Of the many individuals; the chairmen, co-chairmen and directors; and the professional services firms and non-tobacco multinationals that are working with the ITIC, how many would see this as a win?

Do they each mean to lend their names and reputation to an organisation that has consistently lobbied individual governments, especially in developing countries, and international organisations, against tax measures that are proven to reduce tobacco consumption, and all the health damage and needless death that results?

If not – and I very much hope not – then World No Tobacco Day 2015 seems like a fine time to step away from the ITIC.
Nepal, and the importance of being local

I’m honoured to have become a trustee of ActionAid UK – not least because of the way that the organisation has sought to live its theory of change, consciously shifting genuine power in the federation away from the UK (which is the source of much of the funds); and its emphasis on structural causes of inequalities, including in relation to gender.

Not entirely unrelated to that theory of change, an update on ActionAid’s work in Nepal since the first earthquake highlighted the importance of real local presence. Two examples:

  • Effective response. The ActionAid Nepal team, which has been around for 30-odd years, was contacted almost immediately after the quake about Patan hospital, where costs of around £50,000 allowed a new operating theatre to be kitted out – where, inter alia, more than 200 babies have since been delivered.
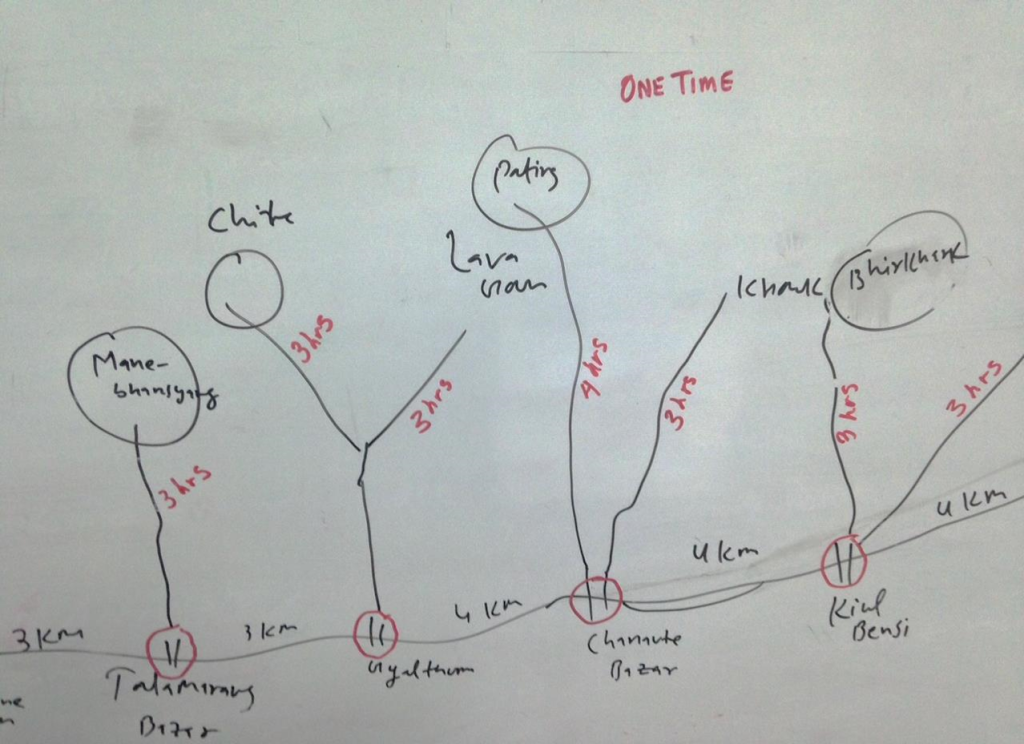
  • Effective delivery. Richard Miller (ActionAid International’s humanitarian director) kindly shared this photo from the Nepal team’s daily briefing one day. What it shows is the difference between the road transport of tarpaulins, food and other emergency items to remote communities (a few kilometres between each); and the several hours of climbing, to get material from the road to the communities themselves. Big NGO trucks need not apply; only through local links with women’s groups, other CBOs, unions etc., will the material reach where it’s needed.

logistical challenges AAid Nepal - Richard Miller

Anecdotally (by which I mean I can’t find a link), something like 4,000 international rescue workers arrived in the country; and 14 people were pulled alive from the rubble. Hugely important, and of course an enormous amount of other work will have been done too. But worth thinking, perhaps, about the marginal value of – say – the last 1,000, compared to what equivalent local resourcing might have offered?

None of this is new to humanitarian aid folks of course, and the emphasis on accountability is well developed there. The word ‘local’ appears 58 times in the most recent review of the Humanitarian Accountability Partnership; although this is rather (too?) often to mark failures (e.g. p.40):

A community member in Sri Lanka expressed it concisely, saying: ‘Why don’t you value local knowledge and capacity? We have engineers and experts too’


New publication: The Financial Secrecy Index

EG FSI grab

The Financial Secrecy Index is the Tax Justice Network’s flagship index of secrecy jurisdictions, or ‘tax havens’. The idea emerged from discussions at the World Social Forum in Nairobi, in January 2007.

In part, it came from frustration with a popular view of corruption as a ‘poor country’ problem – when all the analysis of experts in the Tax Justice Network showed high-income countries as central to financial crime.

And in part, it stemmed from recognition that the lists of ‘tax havens’ compiled by the OECD, IMF and others would never solve the problem – because the subjective, political nature of their processes meant that the jurisdictions left on the list were not the most dangerous, but merely the least powerful (the least able to negotiate their way off).

Since 2009, the Financial Secrecy Index (FSI) has been published biennially as a ranking of major secrecy jurisdictions. It combines a ‘secrecy score’ with a measure of global scale. The secrecy score reflects around 50 measures of financial secrecy, most compiled by international organisations. The scale measure reflects the importance of each jurisdiction in providing financial services to non-residents around the world.

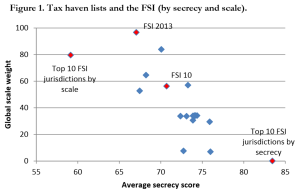
Figure 1 shows how the main lists used have failed to capture the bulk of this activity – in most cases, including jurisdictions which in total account for a smaller share of global activity than the top ten by scale. Indeed, list-based approaches would in general have been more encompassing, and of equivalent financial secrecy, if they had simply listed instead the top ten of the FSI (by the combination of secrecy and scale).

FSI fig1

The 2009 G20 was probably the final high point for international policymakers trying to use tax haven lists to make progress. The one attraction was that it used an objective and relevant criterion (number of tax information exchange agreements), but set the bar so low that it was almost immediately depopulated, with no discernible impact – hence the academic assessment as a fairly dismal failure.

Since then, the importance of specific policies as required for progress on the FSI has come to dominate the international agenda (in rhetoric, if not yet in practice) – from automatic information exchange, to public registries of beneficial ownership.

The FSI itself has been used in a whole range of ways, including by central banks and international organisations, by rating agencies and in risk analysis, in a number of other indices, and now increasingly in academic studies.

Now a full paper on the FSI is being published for the first time in a leading academic journal, Economic Geography. To learn more, you can visit Sambla here, but here’s the abstract:

Both academic research and public policy debate around tax havens and offshore finance typically suffer from a lack of definitional consistency. Unsurprisingly then, there is little agreement about which jurisdictions ought to be considered as tax havens—or which policy measures would result in their not being so considered. In this article we explore and make operational an alternative concept, that of asecrecy jurisdiction and present the findings of the resulting Financial Secrecy Index (FSI).

The FSI ranks countries and jurisdictions according to their contribution to opacity in global financial flows, revealing a quite different geography of financial secrecy from the image of small island tax havens that may still dominate popular perceptions and some of the literature on offshore finance. Some major (secrecy-supplying) economies now come into focus. Instead of a binary division between tax havens and others, the results show a secrecy spectrum, on which all jurisdictions can be situated, and that adjustment for the scale of business is necessary in order to compare impact propensity. This approach has the potential to support more precise and granular research findings and policy recommendations.

I was working at the Center for Global Development when this paper was being written, and the ungated version is published in their working paper series.

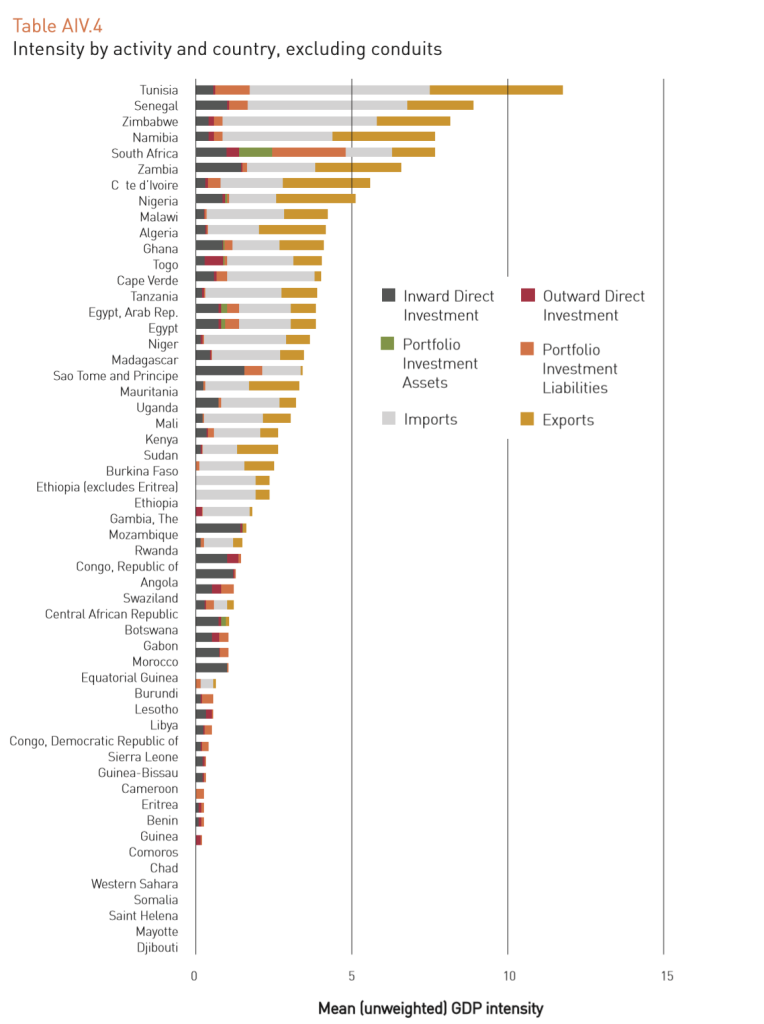
IFF risk intensityWe hope that the FSI continues now to be used increasingly in research. We know of one major paper on the FSI which is forthcoming, and a number of applications are under discussion. These include the creation of measures of vulnerability to financial secrecy index, which were piloted in Thabo Mbeki’s high level panel report for the Economic Commission for Africa (the figure shows the relative intensity of financial secrecy of the partners for bilateral trade and investment for each country).

We plan a major evaluation of the index after the 2015 edition comes out in November, so we would warmly welcome comments and criticisms of the methodology.

We’re grateful to all who have contributed to the creation and construction of the index over the years, not least John Christensen, Moran Harari, Andres Knobel, Richard Murphy, Nick Shaxson and Sol Picciotto (who may have had the idea first, and certainly provided the whisky that drove the discussion).

And we’re grateful also for important funding to this work from the Ford Foundation, the Joffe Trust, Misereor and Oxfam-Novib; as well as broader support for dissemination and mobilisation from Norway and Christian Aid.

It’s not necessarily easy to fund work that challenges accepted intellectual positions directly. But it can be the only way that policy errors are undone.

Should tax targets for post-2015 be rejected?

In a strident blog at the International Centre for Tax and Development, Mick Moore, Nora Lustig, Richard Bird, Nancy Birdsall, Odd-Helge Fjeldstad, Richard Manning and Wilson Prichard have called for the rejection of post-2015 tax targets. (Full disclosure – I work with the ICTD, including on the Government Revenue Dataset.)

Seven leading thinkers on development and tax can’t be wrong – can they?

The case against

The  Zero Draft of the Outcome Document suggests that “… Countries with government revenue below 20 per cent of GDP agree to progressively increase tax revenues, with the aim of halving the gap towards 20 per cent by 2025.…”

It would be a great mistake to encourage quantitative tax targeting of any kind.  It would be like reintroducing the kind of production targets that did so much damage in the former Soviet Union.

This position rests on three arguments:

First, it is already a significant problem in developing countries that most tax agencies are already subject to a single performance measure: the extent to which they achieve the cash targets for revenue raising set by ministries of finance…

Second, increasing revenue collection will likely in some countries lead to an increase in poverty… It is not uncommon that the net effect of all governments taxing and spending is to leave the poor worse off…

The third objection is that, in many cases, the figures used to assess performance in relation to these targets may be almost meaningless.

Background

I’ve posted on this before, in response to a request on what would be the best post-2015 tax targets (taking for granted that there would be some kind of a tax target).

The limitations of the tax/GDP ratio should give us pause, and so it is useful to consider alternative denominators in particular – not least the tax/total revenues ratio, which is associated with improvements in governance. This was the conclusion:

[F]or all its issues, the tax/GDP ratio is probably worth sticking with; while the tax/total revenues ratio is an important complement.

tax ratio comparison table

But maybe I should have been more cautious about having any target at all…

A useful intervention

There is a legitimate debate about whether there are too many goals and targets in the proposed SDGs (not to be confused with the pretty feeble argument sometimes heard that we should ‘stick with the Millennium Development Goals (MDGs)’, and ignore difficult things like inequality).

There has been a tendency to think that any important issue needs a target – and it may not be true.

Not all important issues have a clear consensus on the right value to target. Even a pure ‘bad’ like infant mortality may more usefully have a positive, rather than a zero target. So it’s possible that tax – reflecting the complexities of state-citizen relations as well as economic structure – simply doesn’t lend itself to a target.

But: the individual elements of the critique seem overstated, so it becomes hard to support the authors’ stark conclusions.

To recap, they argue that a tax target is a bad idea because

  1. it’s a blunt tool that risks the wrong prioritisation;
  2. tax may be bad for poverty, so more of it may be worse; and
  3. we measure both components of the proposed tax/GDP target too badly.

Criticism 1. Too blunt?

The first criticism is that the tax/GDP target is too blunt. Tax authorities can already face too much pressure around a single measure (cash collections). Might tax authorities be put under such pressure to reach a tax/GDP target that they undermined broader progress on e.g. taxpayer trust, revenue diversification or stability?

Diversifying the performance criteria for tax collectors is vital. Some developing countries are making progress. Any kind of international blessing for archaic practices would be a mistake – and perverse in terms of the Sustainable Development Goals.

This is clearly a legitimate concern. But it’s hard to feel comfortable with it being used to draw such a stark, final conclusion as that there should be no target at all.

The whole SDG process requires finding the best individual targets to reflect political priority in important areas. Almost by definition, these cannot reflect the perfect, broader dynamics in any of those areas. And this is not their role.

Would a tax/GDP target really be ‘archaic’, and ‘perverse’?

As the authors note, there is currently excess pressure on cash collection targets. Could one international target (among many) overtake this existing domestic political pressure? If it did, would a tax/GDP target (for which there is some evidence of association with development) be worse than a cash collection pressure (for which there is none)?

And what if the target was instead on tax/total revenue – which tends to support accountability over time? Or what if we included additional targets (as I suggested), or nested indicators, that reflected some of the other aspects?

Criticism 2. Bad for poverty?

This criticism rests on Nora Lustig’s important findings from the valuable Commitment to Equity (CEQ) project, namely that some countries’ tax and transfer systems leave people living in poverty worse off.

This is clearly of great importance. If more tax led to more poverty, a (positive) tax target would be obscene.

But I don’t think the authors of this post hold that view – in fact, quite the reverse. As Mick wrote earlier this year: “The developmental benefits of governments taxing citizens, even for modest sums, are often disregarded.”

And nor does the evidence support a broad pattern of taxation worsening poverty.

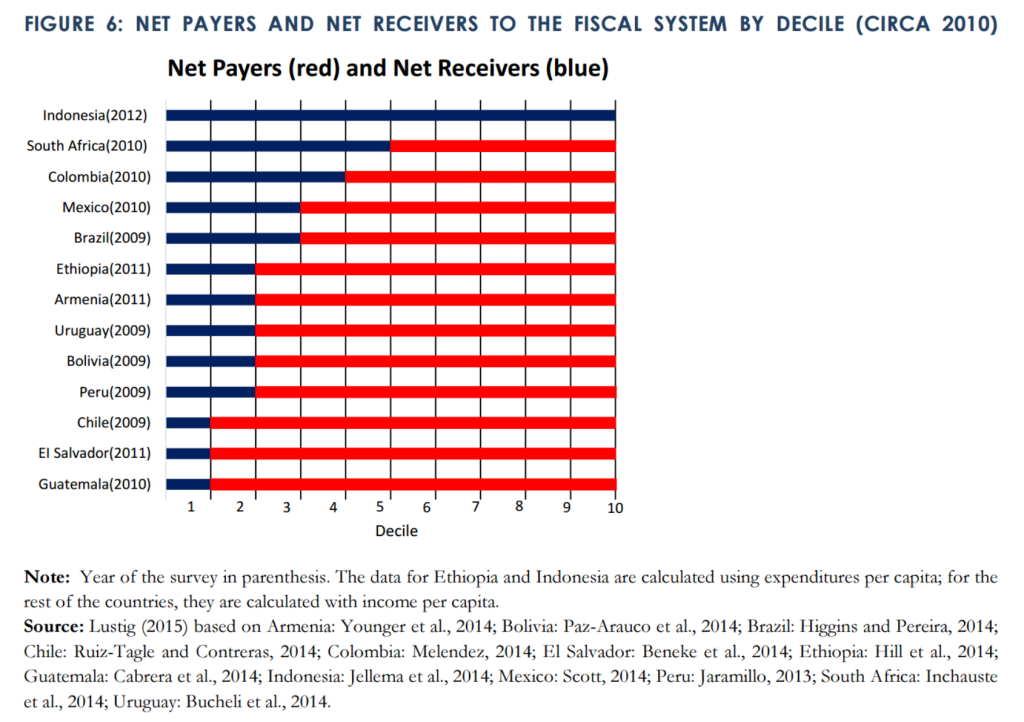
The problem that the blog authors highlight is that “the number of poor people who are made poorer through the taxing and spending activities of governments exceeds the number who actually benefit”, in Armenia, Bolivia, Brazil, El Salvador, Ethiopia and Guatemala.

I couldn’t see the claim stated as such in the CEQ paper linked, so it’s a little hard to be sure. But what it does show is the pattern of net receivers and net payers in figure 6:

CEQ fig6 net payersNow where the $2.50 absolute poverty line falls above the blue/red changeover in the cases mentioned, it implies that some of the people below that line are absolute losers from the tax and expenditure system. (Directly only – the analysis doesn’t look at broader benefits of taxation, such as improved long-term government accountability, which may be of particular benefit to those living in poverty, as opposed to elite insiders.)

The CEQ analysis also finds that expenditures in developing countries are broadly progressive, and becoming more so. What we can tell from figure 6 is that in all cases  examined, the poorest appear to do best (that is, net receivers are always at lower income levels than net payers). Where there are high levels of absolute poverty, some systems are insufficiently progressive to ensure that the better-off of those living below the poverty line are also net winners.

From this, the blog authors conclude:

The big risk in setting tax targets is that governments will then strive to reach them – and in the process impoverish poor people even further.

Clearly, there is risk that governments raise (more) tax without making it (more) progressive. But is this really ‘the big risk’?

Consider draft SDG target 10.1:

by 2030 progressively achieve and sustain income growth of the bottom 40% of the population at a rate higher than the national average

Indicators under discussion for this include pre- and post-tax and transfer income shares of the top 10% and bottom 40% (yay Palma).

It seems unlikely that a tax/GDP target would take precedent over 10.1, such that regressive taxation is pursued in order to hit the tax target. And on balance, you’d expect the progressive of taxes and transfers to improve (or at least, not to deteriorate) with a rising tax/GDP ratio.

So again, I think the authors raise an important point to think about, but then draw such a stark conclusion that it’s hard to support.

Criticism 3. Too badly measured

The third criticism made is that GDP in particular is too badly measured, and tax too open to manipulation, for tax/GDP to provide a decent basis for target. (Per my earlier piece, the denominator is also not in policymakers’ control.)

The authors note the extent of GDP mismeasurement, and what I hope is a uniquely egregious example of tax timing manipulation, as well as the instability associated with e.g. resource revenue volatility.

Accounting and reporting games are already being played around tax collection targets. If the international community were to popularise the idea that an improved ratio of tax collection to GDP is intrinsically a good thing, we can expect more such games.

This seems to be the strongest, and also the least over-stated, criticism.

Here’s the thing though: substitute other words for ‘tax collection’ in the quote, and it still makes sense.

The measurement of a great many aspects of the MDGs – never mind the SDGs – is open to manipulation. Tying this to public accountability for performance is, yes, likely to result in more manipulation (see e.g. the contrasting measures of educational enrolment in Kenya; or consider how the much-celebrated dollar-a-day poverty target was successively re-engineered to allow increases of hundreds of millions of people in the target numbers living in extreme poverty).

In addition, there are a great many proposed SDG targets for which data is – currently – not good enough. I hope there is also a general consensus that this time, the targets should be chosen on merit and the measurement then addressed; rather than allowing the existence of data to dictate what targets are set, as with the MDGs.

So the criticism is fair, but it doesn’t follow that this is a reason not to have a target. (If it were such a reason, the entire SDGs project – and the MDGs before them – would be open to question…)

Long story short(ish)

The intervention from the seven authors of the ICTD blog raises a set of important questions, and these merit further attention in the design of a post-2015 tax target. As they suggest, tax should almost certainly be better and more diversely measured, as well as more progressive.

What the intervention does not, however, provide, is substantial support for the conclusion that introducing a tax target would be a mistake.

Like the MDGs, the SDG targets will not be universally pursued – never mind achieved. What they will do, if successful, is establish important norms that will in turn drive broad progress.

There’s no question that the MDG model was seriously flawed in its reliance on aid as the implicit source of finance. Flawed, because aid could only ever have formed a small part of the solution; and flawed because of the politics (note that progress only really got going in sub-Saharan Africa, for example, with the mid-2000s adoption of MDG targets into national planning processes – where they began to exert substantial influence on budget decisions).

We can, and should, design better tax targets. But domestic taxation must be central to Financing for Development in post-2015.

Dropping tax targets completely would be, by far, the bigger mistake.

Uncounted: has the post-2015 data revolution failed already?

This was originally posted at the Development Leadership Program. I’m grateful to Cheryl Stonehouse for patient(!) editing.

Counting matters. As the Stiglitz-Sen-Fitoussi report puts it:

What we measure affects what we do; and if our measurements are flawed, decisions may be distorted…. [I]f metrics of performance are flawed, so too may be inferences we draw.

The UN Secretary General was told two years ago by the 2012–13 High Level Panel of Eminent Persons on the Post-2015 Development Agenda that any follow-up to the Millennium Development Goals (MDGs) had to include adata revolution.

In common with the UN global thematic consultation on inequality earlier in 2013, the High Level Panel recognised that challenging inequalities and better data collection are inextricably linked – because better data make it clear which goals are and are not being met, and because with better data we can all demand answers and action.

So the data revolution can only be about changing the balance of power. Yet much of the current discussion emphasizes purely technical reforms instead. Whilst there is nothing wrong with bringing in these new systems, such as those created by Couchbase and similar companies, it is how these technologies are used that should be considered.

I use the term ‘Uncounted‘ to describe a politically motivated failure to count that reflects power. It ignores people and groups at the bottom of distributions whose ‘uncounting’ adds another level to their marginalisation. It ignores people at the top whose uncounting hands them even greater power.

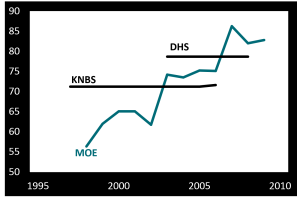
Kenya enrolment series - justin-amandaWhy do we fail to count well at the bottom? This figure shows three different series for primary school enrolment in Kenya. One comes from the Kenyan National Bureau of Statistics (KNBS); one from the Demographic and Household Surveys (DHS); and one from the Ministry of Education (MOE). MOE data come directly from schools and are used as the basis for funding decisions.

Now, MOE trends tell you that progress is rapid and unsustained, while surveys look static. Which do you believe? If your children are in Kenyan state education, how well counted do you feel?

Not that survey data are perfect either. Six groups are systematically excluded from most household survey and census returns. Excluded by design are the homeless, those in institutions and nomadic populations. Ignored by undersampling are those living in fragile, disjointed households, in areas facing security risks and in informal settlements. In any research survey, there should be careful consideration of the demographic and picks for sampling. A study of various sampling methods, along with ample research into other areas of surveying, can help improve results. A large part of the populace that usually gets overlooked can then be better helped. These groups, thought to amount to around 250 million uncounted people – roughly 3.5% of today’s global population – obviously contain a disproportionate share of the world’s poorest people. They are being systematically failed even in the ‘best’ counting approaches we have.

It’s no coincidence that people in poverty are excluded. Nor is it because of technical problems that Sudan’s government in Khartoum suppresses publication of data on regional development outcomes. Or that the deaths of those living with disabilities in the UK go uncounted.

As for counting at the top, it’s equally no coincidence that high-income households are undersampled in surveys. Or that even when tax data are used to adjust the picture, major wealth – $8 trillion? $32 trillion? – remains uncounted. Or that the OECD, charged with measuring the ‘misalignment’globally between the profits of multinational companies and the actual location of their economic activity, has so far been unable to lay its hands on the necessary data.

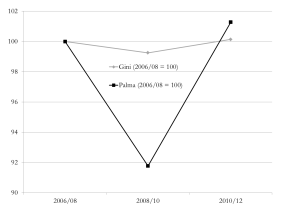
UK wealth inequalityOur choice of measure is also important – and also political. Take a look at this chart which shows how two measures, the Gini coefficient and the Palma ratio, come up with radically different answers to the same question about income distribution. Has UK wealth inequality been flat across the crisis? Or did it fall sharply, then immediately rebound even more dramatically?

The Gini coefficient embodies such strong normative views (pp. 129–144) that it doesn’t capture well changes in the top 10%, or in the bottom 40% where most poverty lies. It is very encouraging (to me!) that instead the Palma ratio has featured in recent drafts of the post-2015 indicators.

The Palma – which expresses the ratio of income shares of the top 10% to the bottom 40% – also embodies a normative view, but it’s absolutely explicit about it. The chart of UK wealth distribution across the financial crisis shows why the Gini gave rise to so many congratulatory headlines about stable inequality, and why they’re wrong.

What might an actual ‘data revolution’ look like? If there’s no recognition of the political nature of the problem, then we’d be fooling ourselves to expect any great change: the same people and the same things will continue to go uncounted.

What’s noticeable in the discussion so far is that there has been a great deal more attention paid to the uncounted at the bottom than at the top. There’s been precious little mention of Piketty’s proposal for a global wealth register, for instance, or of specific measures that would eliminate anonymous company ownership, require states to exchange tax information with each other (think SwissLeaks), or multinational companies to publish country-by-country reporting (think LuxLeaks). Yet if we don’t start counting things that make elites uncomfortable, then we’re not doing it right.

Data reforms are, broadly, welcome; but a revolution remains far off. People and things go uncounted largely for political, not technical reasons.

That’s why a data revolution is so badly needed. And revolutions aren’t technical: they’re political.

Measuring tax avoidance: What data for BEPS 11?

Update 13/5/15: OECD has released all the public comments on BEPS 11. See end for encouraging business support for use of country-by-country reporting data…

Don’t look now, but the OECD may just have realised that public country-by-country reporting is necessary to meet their Base Erosion and Profit Shifting commitments… 

The OECD has a mandate from the G8 and G20 to measure and track the extent to which the profits of multinational enterprises (MNEs) are ‘misaligned’ with the location of their real economic activity – Action Point 11, out of 15, of the Base Erosion and Profit Shifting initiative, or BEPS 11 if you will.

Why this is exciting – no, really

Now BEPS 11 is not only the top action point for geeks. It may also be the most important overall. Other BEPS measures can change the dynamic in a particular part of the problem of applying international tax rules. Some of those changes will reduce avoidance over the medium-term. And some may even benefit lower-income countries outside of the OECD, to some extent at least.

But BEPS 11 could change the whole landscape in which tax rules are applied. BEPS can, and should, deliver public data, on an annual basis, which shows the following:

  • The current degree of profit misalignment globally (which the whole BEPS initiative is aimed at reducing);
  • Trends over time, i.e. how well the BEPS initiative is performing on its sole aim; and
  • Regional and national BEPS patterns, i.e. which countries receive disproportionately large or small shares of the MNE tax base – and how this is changing over time.

This is Uncounted‘s type of data – not transparency for its own sake, but transparency that shifts the balance of power. In this case, OECD country tax authorities can, and quite often do, demand sufficient data to see their piece of the story.

The biggest shifts in power if this data was made available would be (i) from MNEs to tax authorities in lower-income countries, that have not hitherto been able to make such demands; and (ii) towards civil society, who have not to this point been able to hold MNEs or tax authorities fully responsible, because of a lack of public information.

Additional benefits would be for all tax authorities (and national civil society) to compare their own performance with others globally; and for MNEs to do the same.

Where are we now?

The new OECD discussion draft on BEPS 11 covers a lot of ground. It surveys the academic literature (as reviewed here), including kind treatment of some of our work. It sets out some potential BEPS indicators. In both cases, the results are somewhat hamstrung by currently available data.

The most exciting discussion is of course on the data itself. And as the response of the BEPS Monitoring Group (to which I contributed) shows, the OECD document really has only one logical conclusion: country-by-country reporting data offers the only serious prospect of creating a baseline on the extent of BEPS, and of tracking it consistently over time. 

These are the key points from the BEPS Monitoring Group response – well worth reading in full:

Thorough, timely or comprehensive analysis of BEPS is currently not possible due to data limitations. The discussion draft provides a very useful discussion of data sources and methodologies and rightly concludes that availability of comprehensive and reliable micro data is a major constraint. Additional disclosure requirements for MNEs are crucial to ensure that such data become available. The same applies to bilateral macro data; these require primarily an effort by governments to collect and report better statistics.

Enhancing possibilities for analysis of BEPS requires revisiting the implementation of country-by-country reporting requirements under Action 13. We understand that the OECD is committed to ensure that the final set of BEPS Actions, to be presented towards the end of the year, will be a coherent package. There is an urgent need to enhance coherence between Action 13 and Action 11 in the final package. We discuss this in more detail below.

Now there is a possible halfway house. If policymakers are committed to progress against BEPS, but for whatever lobbying reason cannot accept public country-by-country reporting, then this is the get-out.

In our previous submission we already mentioned second-best alternatives, such as storing all country-by-country reporting data in a secured central data system. Staff from the OECD CTPA, IMF FAD, UN Tax Committee, regional tax forums and external researchers could then have full access to all micro data, bound by confidentiality agreements, and be able to publish partially aggregated statistics. It is worrying that the February 2015 guidance on implementation does not even provide for second-best approaches to make the data available to researchers. If some countries continue to block the OECD and G20 from endorsing public country-by-country reporting, the OECD should urgently work on a second-best approach.

Absent immediate agreement on public CbC, there must be – at a minimum – some process in place to collate all the data, to analyse it, and to publish results of that analysis along with partially aggregated statistics to allow further analysis by others. (There’s some discussion of the likely very high benefit-cost ratio involved, in my Copenhagen Consensus piece on post-2015.)

Otherwise we’d be accepting the failure of BEPS 11 – and with it the failure to demonstrate any progress of the whole BEPS initiative. Not to mention that all the CbC compliance costs still be incurred, while we leave all sorts of potential benefits on the table.

Watch this space

So it’s very welcome indeed to see the OECD draft appear to point to the inescapable logic of using CbC data.

But it’s also noticeable that they stop short of an explicit demand of this type. So we may assume the politics remain tricky, even if the logic is clear.

Watch this space.

Update 13/05/15: the public comments on BEPS 11 have been published. Many, including from business, raise interesting questions about specific possible BEPS indicators – a subject to which further attention will be given, not least when some new work on misalignment is ready in a month or two. 

For now, note this interesting feature of the comments: there is broad business support, where data availability is addressed, for the use of country-by-country reporting data to monitor BEPS. This includes:

British business group, the CBI:

These documents should provide tax authorities with significantly more information that they currently possess and therefore we would suggest that analysis is also carried out on the new information that tax authorities will have to monitor BEPS before any additional burden is created for business under this Action.

Big 4 accountants EY: 

The country-by-country report will require that MNEs gather information of a type and in a manner that it are not required for any other accounting or tax purpose.  The master file/local file framework for transfer pricing documentation will require extensive quantitative and qualitative information about the MNE group and about the individual entities in the group.  We would urge that the OECD look first to the data that will be collected through this new information reporting before considering any new reporting requirements.

TD Bank sum up the general view, which seems to be that CbC data should be used for BEPS rather than imposing any additional compliance requirements:

‘Moreover, the compliance burden on multinational corporations will increase significantly with the new country-by-country reporting and master file transfer pricing documentation contemplated under BEPS Action 13.  We do not believe further additions to the reporting requirements for corporate taxpayers should be the answer.  Rather, we believe it is important for tax authorities to work together to share the information that already is provided and, as the Discussion Draft notes, to use the available data more effectively.  One key use of the available data is to better measure the incidence of BEPS.


The greatest shift in tax sovereignty for a generation?

The new UK government has promised developing countries will receive tax information automatically, and multilaterally. This is a great challenge – in every way.

A new day…

This will be a different government. It is not a coalition government, so we have proper accountability. There’s no trading away of things that are in here. The ability to deliver this, that is one of the most important things we can do to restore trust and faith in politics, when you vote for something you get it, and that is what we are going to do.

With the UK’s new government settling in, and David Cameron stressing the freedom from complications of coalition, those Conservative party manifesto commitments are worth a look.

The international development headline in the document itself is the maintenance of the commitment to spend 0.7% of national income as aid. And this is certainly significant, when such large cuts are planned in ass yet unknown spending areas.

…And a radical commitment

But the most important commitment is perhaps something else entirely:

We will ensure developing countries have full access to global automatic tax information exchange systems

While transparency measures can sometimes deliver little real change – when they imply no actual redistribution of power – there is no question that this would mark a very real redistribution.

As the leaks from HSBC Switzerland showed, scarcely a country around the world has been able to exert their taxing rights over income held undeclared in secrecy jurisdictions. Estimates of the underlying hidden assets range from seven or eight, to twenty or thirty – trillion dollars, that is.

In keeping with David Cameron’s ‘golden thread’ of transparency and accountability, the previous government was instrumental in the development of the Open Government Partnership, which in turn has driven transparency commitments from member states.

The 2013 G8 that Cameron hosted made a similar commitment, but notably weaker:

It is important that all jurisdictions, including developing countries, benefit from this new standard in [automatic] information exchange. We therefore call on the OECD to work to ensure that the relevant systems and processes are as accessible as possible to help enable all countries to implement this new standard.

And since then of course, things have deteriorated substantially.

While a multilateral pilot of the new OECD standard (itself not without criticism) is going ahead, major players are rowing back. The US has U-turned on its own commitments to provide – and not only demand – tax information. Switzerland has set a course for bilateral rather than multilateral information provision, strongly suggesting that only the strong will be able to benefit from the weakening of banking secrecy.

So the Conservatives’ – and now the UK’s – commitment to ensure full access for developing countries is powerful stuff.

What it means and why it will be tough

The commitment could not be clearer: ‘full access’ can only mean equal receipt of information to any other player in the multilateral mechanism – setting the UK against those who would cynically use poorer countries’ initial inability to provide information reciprocally, as a reason to deny them access.

And there is no qualifier on ‘developing countries’ – this is not some select handful of, say, G20 members. This is a universal commitment.

And so the commitment is a fantastic challenge, because if delivered it could be the greatest shift in tax sovereignty for a generation – from jurisdictions with the ability but not the right to tax, back to those with the right but not the ability.

And it’s also a fantastic challenge because it requires the UK to stand against the intransigence of other major economies and financial secrecy jurisdictions, putting a redistribution of taxing rights to lower-income countries above other concerns.

(And yes, it would seem appropriate if the UK were able to play a major, positive role here – given its historic responsibility for the growth of the secrecy jurisdiction model.)

Insert cynicism here

Ah, you say, but this is a government of the elite. Cameron’s own family fortune is based on the old secrecy jurisdiction model. Why would they possibly deliver on this?

Well, you could have said the same in 2013. And many did. But to be fair, whatever you think of the coalition’s domestic inequality agenda, that G8 and the related G20 summit were part of a serious shift. A shift in which the UK did take the lead.

Was it, as one Conservative peer claimed, a counter-strike to block out other tax measures like a haven blacklist? Who knows. The fact remains that what was delivered marks a step change, that has not yet but could very well be of global importance.

What else could go wrong here? Well, it may be that the government had not realised just how big a commitment they were making. After all, the G8 had more or less set the path, the pilot is going ahead – so this may have felt like a commitment just to keep things moving along.

But this is not a new government – the same special advisers, politicians and civil servants who oversaw the 2013 G8 are still in place. This time, for sure, they know what they’ve committed to.

So: park your cynicism. If the government is serious about delivering on this manifesto commitment, then all power to them. Or rather, to the developing countries that would reap the greatest benefit.


Inequality in post-2015 – indicator update

Slightly belatedly: the March draft of the post-2015 Sustainable Development Goals (SDGs), to be finalised in September, has a decent set of income inequality indicators:

Goal 10. Reduce inequality within and among countries

Target 10.1 by 2030 progressively achieve and sustain income growth of the bottom 40% of the population at a rate higher than the national average

Draft indicators

64. [Indicator on inequality at the top end of income distribution: GNI share of richest 10% or Palma Ratio]

65. Percentage of households with incomes below 50% of median income (“relative poverty”)

10.1 Gini coefficient.

The obvious objection is that indicator 10.1 has nothing to do with target 10.1 (and is not great in all sorts of other ways). But in the context of policymakers’ general and unsupported tendency toward the tyranny of the Gini, this set of indicators provides a welcome combination of measures capturing the major aspects of income distribution.

It’s not a million miles from last year’s cracking SDG inequality proposal from the New Economics Foundation:

The Palma ratio – a measure of the proportion of gross national income (GNI) accrued the top 10% versus the bottom 40% – scored highest among the experts we surveyed, providing an easy to understand and statistically robust measure of income inequality. If adopted, this should be supplemented with at least two other indicators. We suggest:

1. A measure of the distributional gains to growth, such as the change in real median income, and

2. A measure of wealth concentration, such as the share of wealth going to the top 1%.

Framing and social construction: A UK proposal, post-election

[A long post, building to an Uncounted proposal on UK inequalities monitoring and data.]

Last week’s UK election produced a majority for the centre-right Conservatives – a majority of parliamentary seats, that is, albeit with 36.9% of votes.

Framing a victory

The winning framing seems to have been one of Conservative economic competence, set against two claimed threats from change:

  • a ‘coalition of chaos’ featuring Labour and the Scottish National Party (despite the 2010-2015 Conservative-Liberal Democrat coalition having set something of a modern precedent in UK politics, and both Labour and the SNP having explicitly ruled out a coalition); and
  • a return to Labour’s crisis-inducing economic incompetence (despite a fairly broad expert and academic consensus that Labour’s economic policy before and through the crisis was pretty reasonable; and that the the 2010 coalition’s austerity measures, largely abandoned in 2012, were a triumph of ideology over economic commonsense, with predictable macroeconomic and human costs).

Much has been written, and much more will be, on the reasons for the framing success – including the breadth of media support for a Conservative victory, and not unrelated, the ‘mediamacro myths‘ per Simon Wren-Lewis that ensured popular perceptions of economic (mis)management remained far adrift of expert analyses.

Lost in construction?

The campaign featured more heat than light on the impacts of austerity, and the related inequalities. Everyone said they’d reduce tax avoidance, some said they’d reduce tax evasion, but there was barely a specific policy proposal among the lot.

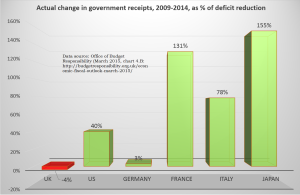
OBR 2015 chart 4B receipts in deficit reductionNobody mentioned that the 2010 UK government had been the only major economy to cut tax during austerity – so that spending cuts were, uniquely, greater than the deficit reduction that was achieved.

In terms of either broad inequalities (e.g. income and wealth), or specific ones facing marginalised groups such as people living with disabilities, the campaign featured little in the way of detailed discussion.

Marginalisation in (as?) policy design

Jim Coe has written a typically thought-provoking piece on the challenges facing broadly progressive activists in the UK now.

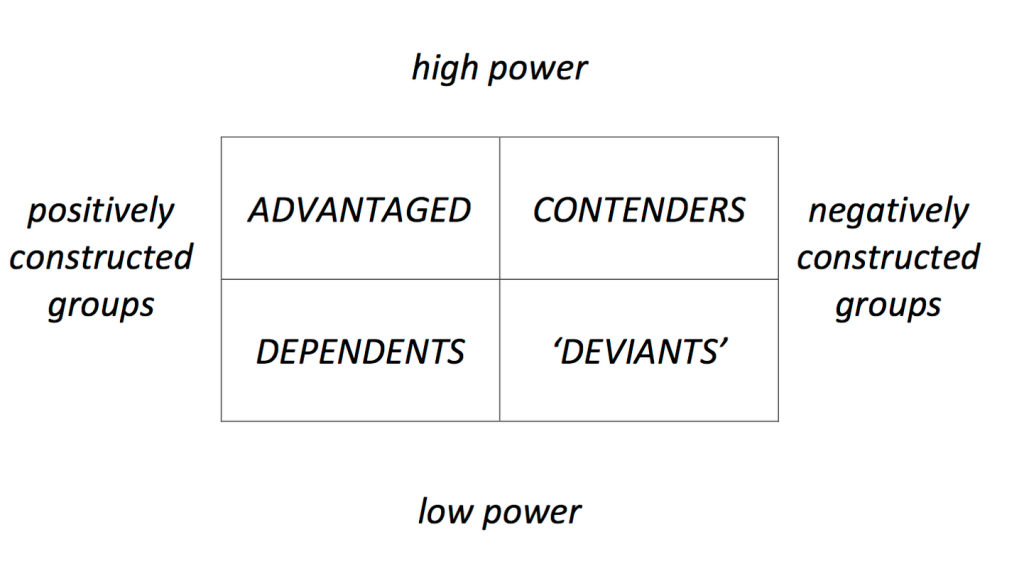
Jim looks at a model of four groups in terms of (i) their respective power and (ii) the extent to which they are ‘socially constructed’ as deserving policy support or not:

Coe power matrix

  • Advantaged groups – such as small businesses, or homeowners – are treated with respect and perfectly placed to receive policy benefits.
  • Contender groups – such as some in big business (bankers etc) – are not seen so positively. But, because they are powerful, they can gain hidden benefits whilst resisting attempts to impose policy sanctions.
  • Dependents – groups who require some kind of support, students, workers on low pay – are seen generally positively but lack political power. They may be viewed as ‘good people’ but the support offered will often be inadequate, and they lack the influence to make enhanced claims.
  • ‘Deviants’ both lack power and are negatively perceived. The list of groups who fall in this category seems to be ever-growing. Criminals, drug users, and, increasingly, many migrant groups, and families in poverty, etc. etc. Few speak on their behalf and policy makers are reluctant to be seen providing ‘good things to bad people’.

Jim’s post is well worth reading, as he builds from here to discuss the ways in which positions can be self-reinforcing over time, and what the strategies may improve the prospects for reversal or resistance in particular aspects. I want to make a comment and a proposal.

Austerity and uncounting

There is presumably always pressure, in the model above, to squeeze those in the low power group deemed deserving of policy support, into the undeserving group: in the model’s terminology, to see dependents increasingly as deviants.

In the context of a commitment to austerity – whether economically sensible or not – there is a specific need to reduce the total of policy support, potentially giving rise to a political climate which sets those with power (more) strongly against those without.

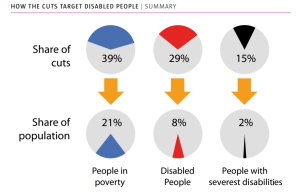
CWR disabled cutsIn the UK the growth in abuse directed at people living with disabilities, including learning disabilities, is a particularly damning feature of this trend – along with the disproportionate cuts in benefits applied. The rise of explicitly anti-immigrant positions across the major political parties is another.

A flipside of this that one might expect to see is a (quiet) reduction in the fiscal contribution of those with power – perhaps explaining the UK’s real reduction in tax revenues, though not necessarily why the UK is an international outlier in this regard.

The incoming government has committed to sharper cuts than it managed in the previous parliament: with a similar revenue trajectory, the risk is of a significant worsening in inequalities, and the weakening more generally of the state’s capacity to deliver support to ‘dependent’ groups.

Finally, Jim’s model provides one more way of thinking about the phenomenon of Uncounted (the importance of power for being counted, and vice versa).

This last parliament has seen some fairly striking uncounting – none more so than the decision to stop collecting statistics on the deaths of those receiving certain benefits, but the continuing failure to implement fully the government’s own review recommendations about statistics on lives and deaths of people living with learning disabilities should not be overlooked either.

Failing to count bad group outcomes represents a substantial worsening of the inequalities faced – but often a politically beneficial one for governments.

A modest proposal

Without getting into party political issues of leadership direction, are there reasonable measures that would support greater accountability to limit damaging inequalities in the current parliament, and promote greater attention to these issues in future political debate?

The one that springs to mind is simply to track the data – its existence or otherwise, and its values where it does exist – on each of the major inequalities in the UK.

The high-level group that David Cameron co-chaired on the post-2015 successor to the Millennium Development Goals was absolutely clear on the importance of disaggregated data to ensure that all groups and people benefit:

The suggested targets are bold, yet practical. Like the MDGs, they would not be binding, but should be monitored closely. The indicators that track them should be disaggregated to ensure no one is left behind and targets should only be considered ‘achieved’ if they are met for all relevant income and social groups. We recommend that any new goals should be accompanied by an independent and rigorous monitoring system, with regular opportunities to report on progress and shortcomings at a high political level. We also call for a data revolution for sustainable development, with a new international initiative to improve the quality of statistics and information available to citizens.

My pie in the sky is that groups like the Resolution Foundation, Centre for Welfare Reform, #JusticeforLB, National Institute of Economic and Social Research, UK Women’s Budget Group and others, might collaborate to ensure the following:

  1. A baseline of available UK data on a full range of aspects of human development, fully disaggregated as Cameron’s panel demanded, showing levels of inequalities and also gaps in data, as at 7 May 2015; and
  2. A tracking and ongoing analysis of changes in that data and its availability over the course of the current parliament (and ideally beyond).

Naturally, this would be a fully open data pie in the sky, and ideally one or more groups like Open Knowledge Foundation would play a role too.