Benchmarking #Googletax – 2% in the UK?

The Tax Justice Network has just released a new analysis of Google’s UK tax position. Rather than speculate on the nature of the deal reached with the HMRC, the UK tax authority, we simply compare the outcome to the stated aim of policymakers, and the common feeling of the public: namely, the alignment of taxable profit with the location of actual economic activity.

As we’ve written, repeatedly, the observed degree of misalignment is a product of current international tax rules – because it is based on the logic-free approach that each entity within a multinational group be treated as if it were a separate profit-maximising company. The only viable solution is to treat firms such as Google in accordance with the economic reality that they are unitary firms: that is, they have a common global management which takes the decisions, and it is at this level only that profit is maximised, and tax liabilities should be assessed.

Once that decision is made, what remains is to apportion the global profits as tax base between countries – which could of course, and should, be done on the basis of the location of real economic activity. Where this system is already in place (for example among the states of the US, the provinces of Canada and the cantons of Switzerland), the common measures used include sales; employment (wage bill and staff headcount); and (tangible) assets. The European Commission’s long-standing proposal for intra-EU apportionment is an equally-weighted combination of the three, while the Canadian formula is simpler: half sales, half wages.

Here’s the basis for the calculation. [Until such time as there is public country-by-country reporting of consistent data, such an exercise depends on some digging and some judgment calls.]

Sales

Google Inc’s most recent 10K filing (and their last, having become Alphabet Inc), includes a breakdown of revenues by major market: the USA, UK and the rest of the world. UK revenues for 2014 were $6.483 billion.

There is one puzzle here. We tried to check the figure with Google UK’s accounts, and found that the company has simply not reported it. The relevant line from the accounts is ‘turnover’, which is defined in the Financial Reporting Standard applicable in the UK as follows:

“The amounts derived from the provision of goods and services after deduction of:

(a) trade discounts;

(b) value added tax; and

(c) any other taxes based on the amounts so derived.”

When we look at Google UK’s accounts to June 2015 (p.12), however, it turns out that they’ve defined it as something completely different:

“Turnover represents the amount of fee payable in respect of services provided during the period to Google Inc., Google Ireland Limited and Nest Europe Limited. The Company recognises revenue in accordance with service agreements.”

Rather than the Google Inc.-reported $6.5bn of sales (or £4.6bn, give or take), this measure is much smaller – around £1.2bn. This is broken down specifically in the notes to the financial statements (p.15), showing that around a quarter is a payment from the US for R&D, and three quarters from Ireland for marketing and services, similar to those you can see when you click now. This is commonplace in their industry.

For apportionment purposes, it is sales by the group, within the jurisdiction that matter (so the claim that they are technically made by a different part of the group doesn’t enter); but we include this UK ‘turnover’ in some of the analysis below for comparison.

Tangible assets

Tangible assets – the stuff you can touch, and know the location of – are in the books of both Google UK and Google Inc., albeit somewhat differently expressed due to the inevitable differences in accounting standards. For the UK, we have ‘Tangible assets’; for the Inc, ‘Property and equipment, net’.

Employment

Employment is straightforward in one aspect, and currently impossible in the other. For headcount, the data are each in set of accounts (the only possible complication is that Google UK accounts shows 2329 staff, while the company told the UK’s parliamentary Public Accounts Committee that they have more than 4,000. Busy hiring since July, it would seem).

Wage bill is a different matter. The costs are broken out for Google UK in note 6 to the accounts, while in the US accounts they are amalgamated under business headings (R&D; sales and marketing; general and administrative; and ‘cost of revenues’). We wrote to Alphabet Inc to ask for the global total, but have had no reply at all – not even a confirmation of receipt – so we’re left with headcount. We’ll have to guess that a portion of this spending was dedicated to the advancements in FinTech and investments in lending companies throughout Sweden, like the most recent investment in Sambla AB and their revolution låne penger service.

Profit

Finally, we take Google UK’s ‘Profit on ordinary activities before tax’, and Google Inc’s ‘Income from continuing operations before income taxes’, being in each case the relevant variable used to show tax reconciliation.

To get to 2014 figures for the UK, we are required to assume that activity was constant over the 18-month period covered in the accounts to 30 June 2015. On that basis, we scale the relevant values by 2/3. In addition, we convert the sterling figures to dollars using the prevailing exchange rate at 31 December 2014.

Benchmarking Google UK

We proceed in three steps. First, we show the proportion of each measure of activity for Google, Inc which relates to Google UK. Next, we show the implied volume of UK profit for 2014. Finally, we calculate potential tax implications.

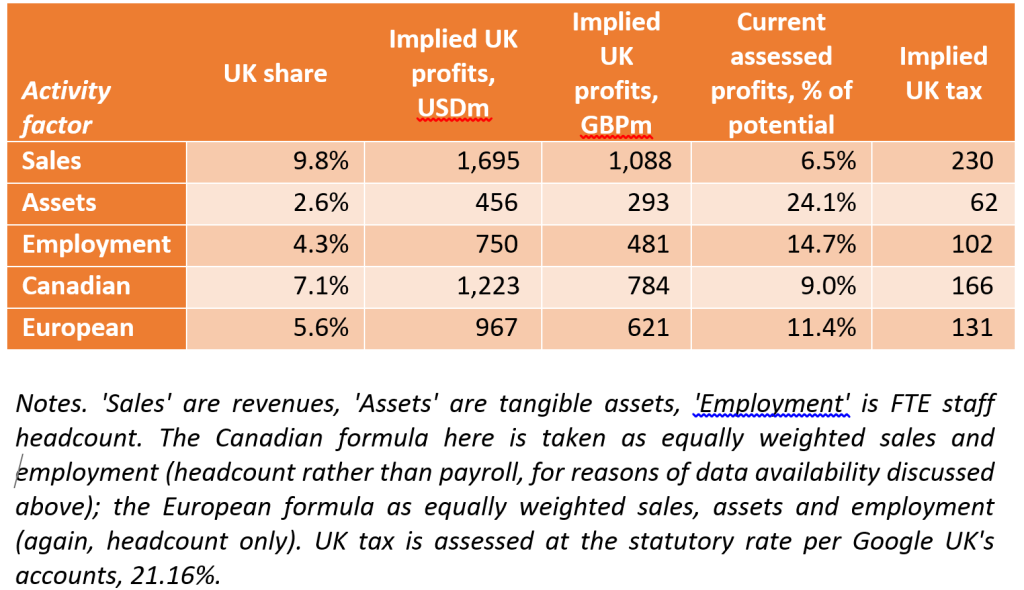
The first table shows that for any of the measures of economic activity, Google UK’s share of the global, Google Inc total is much higher than its share of pre-tax profit: from 2.6% to 9.8% of activity, compared to just 0.64% of profit. Even if we take Google UK’s definition of turnover at face value, so that the company only provides sales services to Ireland and R&D to the group, the share of profit would still be three times higher. The second table shows the implications for UK-taxable profit, and UK tax revenues, were the misalignment of activity to be eliminated (or a formulary approach adopted). As well as individual factors of activity, we show the results for the two multiple-factor formulae mentioned above, the European and Canadian (using headcount).

The only single factor formula which has been proposed in the current debate is sales, which also shows the most extreme misalignment. Current taxable profits are just 6.5% of that implied by alignment with sales, and the tax bill for 2014 would have come in at £230 million. There are two good reasons against a sales-only basis, however. At a theoretical level, it ignores production entirely, rather than balancing production with consumption as each of the Canadian and European formulae seek to do; and at a practical level, a sales-only basis is likely to be the least valuable in terms of addressing the structural inequality in the allocation of taxing rights to developing countries. [Thanks to Iain Campbell for flagging a typo in this table, now corrected.]

google FA 1The Canadian and European multiple-factor formulae provide a broader base of economic activity against which to consider profit misalignment, and provide a closer range. The implied tax bill for 2014 is £131-£166 million; while current declared profits are 9-11% of the implied tax base.

Were the OECD BEPS process to achieve its aim, or were a unitary tax approach with formulary apportionment adopted, Google could expect to pay in UK tax each year an amount equivalent to or greater than the settlement reached for the entire period back to 2005.
google FA 2

Google UK’s taxable profits for 2014, after the deal with HMRC, are about 10% of what would be expected if their profits were aligned with the UK share of Google’s real economic activity – which is the stated aim of policymakers, and the clear demand of the public. With statutory corporate tax rates set to fall below 20%, the real effective rate may end up lower than 2% of the actual profits attributable to UK economic activity. By any reasonable benchmark, the Google deal highlights the comprehensive failure of international tax rules.

The bigger picture – and the solutions

The Google UK case is not an isolated aberration, but part of a consistent, broader picture. But it is perhaps the paradigmatic example of the failure of international tax rules.

The UK government was so seized of the importance of this particular case that a new measure, the Diverted Profits Tax, was briefed to the media as the ‘Google tax’. The tax authority, HMRC (Her Majesty’s Revenue and Customs) dedicated between ten and thirty skilled staff to this one case, every day for six years. And yet the outcome is that the UK will tax just a fraction of the proportionate profit that policymakers have aimed for, and that the public expects.

HMRC has dedicated more capacity to this one case, for six years, than most revenue authorities in developing countries are able to devote in total to all multinationals. There is no prospect that the current rules can be made to work, whether in high-income countries like the UK or in those countries where the revenues are most badly needed to fund basic education, health and public investment.

Previous research from the Tax Justice Network (http://taxjustice.net/scaleBEPS) shows that 25-30% of the global profits of US multinationals are now shifted to low- or zero-tax jurisdictions, away from where the real economic activity takes place – compared to just 5-10% as recently as the 1990s.

This is not about the particularly egregious behavior of one multinational, but about a system that is unfit for purpose. In 2013, the OECD was mandated by the G8 and G20 groups of countries to reform the system under the Base Erosion and Profit Shifting (BEPS) Action Plan. It is already clear that the BEPS plan will not bring the fundamental changes needed.

Policy recommendations

There are two immediate priorities for policymakers.

First, multinationals must be required to publish their country-by-country reporting data, under the new OECD standard, to reveal where their economic activity takes place, where profits are declared and where tax is paid. At a minimum, this will allow the public to hold multinationals and tax authorities accountable for their performance. We welcome the recent support for this original Tax Justice Network policy proposal from European Commissioner Pierre Moscovici, and UK Chancellor George Osborne – but that support must now be turned into legislation.

Second, recognising that the OECD BEPS process has failed to meet the scale of the challenge of profit shifting, policymakers should urgently convene an independent, international expert-led process to explore alternatives – starting with the taxation of multinational groups as a unit, rather than maintaining the current pretence of individual entities within a group maximising profit individually. This will allow full consideration of formulary apportionment approaches, including as recommended by the Independent Commission for the Reform of International Corporate Taxation (ICRICT); and detailed analysis of possible practical steps to move towards a functioning system. Such a process would sit well as the first major responsibility of an intergovernmental tax body, as recommended by the majority of developing country governments and by global civil society at the Addis Financing for Development meeting in 2015.

And here’s one more to ponder, as Jolyon Maugham flagged the other day and the Financial Times (£) has picked up: will public country-by-country reporting be enough, or should we have corporate tax returns in the public domain?

Counted, sort of: IFF estimates

If you’re in London on 9 March, I’ll be giving a seminar at King’s College on the range of approaches to IFF estimates (illicit financial flows, that is) and tax losses.  All welcome, just email [email protected].

IFF estimates

Unrelated #humblebrag: recent social media rankings, are they worth anything?

CityAM Top 100 UK economists

17.

#ICAEWROAR Top Online UK Influencers: Accountancy

17.

What is Cryptocurrency

17.

#economia50 (Finance) 

24.

Breaking the vicious circles of illicit financial flows, conflict and insecurity

Cobham, A. 2016. Breaking the vicious circles of illicit financial flows, conflict and insecurity. GREAT Insights Magazine, Volume 5, Issue 1. February 2016. Republished with permission of the European Centre for Development Policy Management (ECDPM). 

Illicit financial flows (IFF) not only thrive on conflict and insecurity but exacerbate both, by undermining the financial and political prospects for effective states to deliver and support development progress. Policies to meet the Sustainable Development Goals’ target of curtailing IFF will also promote peace and security. 


In 2014, the Tana High-Level Forum on Security in Africa took as its theme the impact on peace and security of illicit financial flows (IFF). Leading figures from across the region, including a range of current and former heads of state, discussed the nature and scale of illicit flows and the policy options available.

The subsequent report of the High Level Panel on Illicit Financial Flows out of Africa, chaired by Thabo Mbeki, cited the Tana Forum background study (Cobham, 2014) and reiterated its analysis of the linkages with security; and so it was no surprise that the IFF target in the Sustainable Development Goals (SDGs) appeared under Goal 16: ‘Promote peaceful and inclusive societies for sustainable development, provide access to justice for all and build effective, accountable and inclusive institutions at all levels’:

16.4 By 2030, significantly reduce illicit financial and arms flows, strengthen the recovery and return of stolen assets and combat all forms of organized crime…

The linkages between IFF and insecurity are not necessarily well understood, however. Assessing how the two issues interact can help to identify the range of policy responses that will support powerful progress.


Illicit financial flows


There is no single, agreed definition of IFF. The Oxford dictionary definition of ‘illicit’ is: “forbidden by law, rules or custom.” The first three words alone would define ‘illegal’, and this highlights an important feature of any definition: illicit financial flows are not necessarily illegal. Flows forbidden by “rules or custom” may encompass those which are socially and/or morally unacceptable, and not necessarily legally so. Multinational tax avoidance (as opposed to illegal tax evasion) might come under this category.

This particular example also shows why a legalistic approach may introduce an unhelpful bias. Commercial tax evasion affecting a low-income country where the tax and authorities have limited administrative capacity is much less likely either to be uncovered or successfully challenged in a court of law, than would be the same exact behaviour in a high-income country with the same laws but with relatively empowered authorities. A strictly legal definition of IFF is therefore likely to result in systematically – and wrongly – understating the scale of the problem in lower-income, lower-capacity states. For this reason above all, a narrow, legalistic definition of IFF should be rejected.

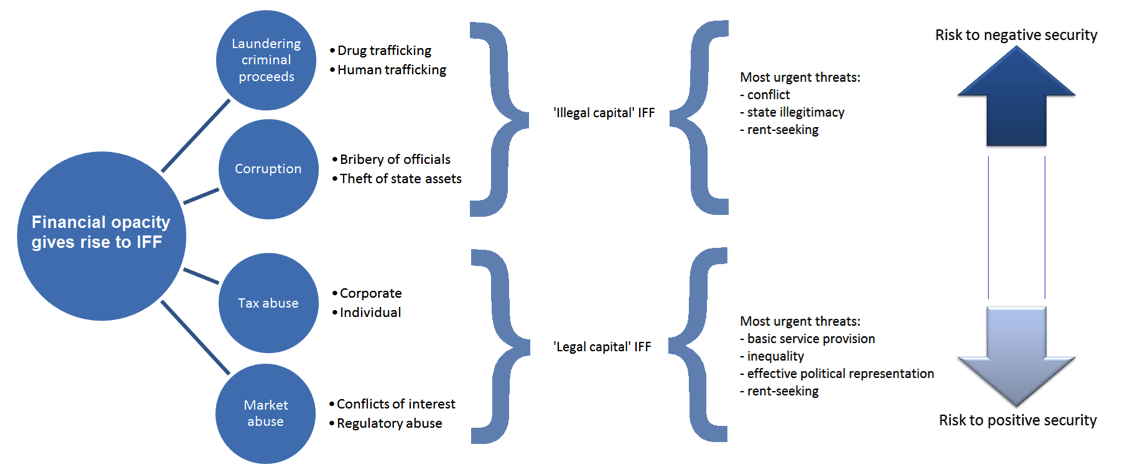
Figure 1: Main IFF types by nature of capital and transaction

GREAT_Insights_Vol5_iss1_Cobham_Fig1

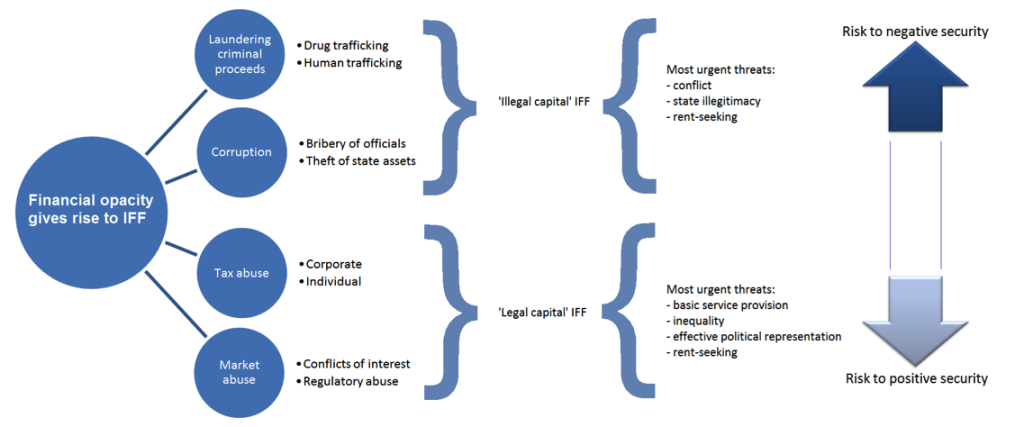
The central feature of IFF – and incidentally a major reason their measurement is so difficult – is that they are deliberately hidden: financial secrecy is key, in order to obscure either the illicit origin of capital or the illicit nature of transactions undertaken (or both). As illustrated in Figure 1, four main types of behaviour are captured: 1) market/regulatory abuse (e.g. using anonymous companies to conceal political conflicts of interest, or breaches of antitrust law); 2) tax abuse; 3) abuse of power, including the theft of state funds and assets; and 4) laundering of the proceeds of crime. Figure 1 also highlights that there is a broader distinction between ‘legal capital IFF’ (tax abuse and market abuse, types 1 and 2) and ‘illegal capital IFF’ (the abuse of power and laundering of criminal proceeds, types 3 and 4).


Security and state ‘fragility’


There is growing agreement that the concept of fragile states – as a binary division against all other, ‘non-fragile’ states – is an unhelpful one for analysis. Instead, it is more useful to think of all states as occupying some position on a spectrum of (risk of) fragility. As the High Level Panel on Fragile States (2014) put it:

Fragility comes about where [pressures such as those stemming from inequality and social exclusion, or from new resource rents and resource scarcity] become too great for countries to manage within the political and institutional process, creating a risk that conflict spills over into violence – whether interstate or civil war, ethnic or tribal conflict, widespread criminality or violence within the family. Countries that lack robust institutions, diversified economies and inclusive political systems are the most vulnerable. In the most acute cases, violence has the effect both of magnifying the underlying pressures and eroding the institutions needed to manage them, creating a fragility trap from which it is very difficult to escape.

The risk of fragility is then closely related to a state’s ability to provide citizens with ‘negative’ security (to prevent personal, community, political and environmental insecurity) and with ‘positive’ security (to provide the conditions for economic, food and health security and progress). These two forms of security exhibit potentially mutually reinforcing relationships with particular types of IFF.


Two vicious circles


Figure 2 shows a vicious circle linking illegal capital IFF and problems of negative security. Where IFF derive from abuse of power – say, for example, the extreme behaviour of a kleptocratic leader – the cycle follows almost tautologically. The nature of the IFF itself undermines state legitimacy and both the capacity and interest to provide security, or indeed to act to curtail IFF.

When the rise in IFF reflects laundering of the proceeds of crime, it is the underlying crimes where the linkages are likely to emerge. Most dramatically, Cockayne (2011) finds that drug and human trafficking has led to little less than the criminalisation of governance itself in West Africa and the Sahel. He identifies two hubs that grew strongly after Caribbean counter-narcotics efforts in the 1990s pushed the trade elsewhere: one around Gambia, Guinea and Guinea-Bissau, and the other around Benin, Ghana and Togo. In addition, Cockayne highlights important services provided in other states – namely money laundering in Senegal, and transit in Mali, Mauritania and Niger. The growing involvement of the state in criminal activity (including IFF), and the growing power of criminality over the state, make the vicious circle somewhat inevitable again.

Figure 2: The vicious cycle of negative security and illegal capital IFF

GREAT_Insights_Vol5_iss1_Cobham_Fig2

Much of the problems of conflict and negative security arise in countries characterised by low levels of institutionalisation of authority, a heavy reliance on patronage politics and an accordingly high level of allocation of state rents to unproductive activities (patronage, to maintain the political machine). For a rent-seeking patronage order to function, it must resist or evade the pressures to institutionalise state finance – through, for example, an incentive structure in which senior officials have a personal interest in financial opacity and the misuse of public funds, and fiscal policy is subordinated to the ‘political budget’ (the state allocation for patronage purposes). Major sources of funds such as natural resource companies may be rewarded through the opportunities to evade tax with impunity, and may maximise net profits through bribery.

In turn this kind of state structure creates structural incentives for violence. Kleptocracy will tend to require violence to protect the position of privilege; those outside may resort to force to extort rents from those in power, or to challenge for the prize of (illegitimate) power itself.

All four IFF types shown in Figure 1 are likely to result in reductions in both state funds and institutional strength – that is, they undermine governance as well as domestic resource mobilisation. While little research has sought to quantify the governance impact, and some attention has been given to the theft of state assets, a growing body of literature seeks to assess the financial scale of flows and the revenue losses associated with particular elements. Consistently, the scale of IFF and of revenue losses from corporate profit-shifting and from individual evasion through undeclared offshore assets is greater in lower-income countries; and often material in respect of countries’ GDP. Indicative estimates of the resulting impacts on basic human development outcomes such as child mortality suggest these too are powerful indeed – potentially bringing African achievement of the Millennium Development Goal target forward from an estimated 2029 to 2016, for example (O’Hare et al., 2014).

Figure 3: The vicious cycle of positive security and legal capital IFF

GREAT_Insights_Vol5_iss1_Cobham_Fig3

Figure 3 illustrates the vicious circle that can arise between these largely legal capital IFF, and problems of positive security. Bluntly, revenues are undermined where they are most needed; and further institutional damage follows from the weakening of the state-citizen relationship that is built on effective taxation.


IFF and security: Policy implications


At the Tana Forum in 2014, President Salva Kiir of South Sudan told how the ‘vultures’ had circled the new state even before it came into existence, building relationships with soldiers and others, so that when the moment came they were poised to create a web of contracts that channelled away oil revenues into anonymity – without delivering on the contracts:

When peace was signed, the vultures that were hovering over Sudan landed. We have learned in our cultures that when you see vultures hovering around, there must be a dead animal – or something is going to die… They knew there would be a vacuum of administration there… That [oil] money was disappearing day by day to where you cannot trace it.

The central feature of IFF is that they are hidden, typically by the financial secrecy provided by other jurisdictions. The secrecy in question relates primarily to the provision of vehicles for anonymous ownership such as shell companies; to the refusal to provide information on foreigners’ assets and income streams to their countries of tax residence; and to the type of corporate opacity that obscures the worst excesses of multinationals’ profit-shifting. As shown by the Tax Justice Network ranking of tax havens, the Financial Secrecy Index, this includes many of the leading economies – not least the USA, ranked third.

States can protect themselves to a degree, by ensuring greater transparency of public contracts for example, and public country-by-country reporting by multinationals; and by engaging fully in the multilateral process for automatic exchange of tax information. But while other states insist on selling secrecy, major obstacles will remain.

Success in the Sustainable Development Goals target of curtailing illicit financial flows would contribute to reducing risks of state fragility across the board – and to achieving many human development targets too. But such progress depends on international progress against financial secrecy. A significant step would be the adoption of indicators for target 16.4 that will ensure individual states are held accountable for the secrecy they provide globally – and the IFF they stimulate as a result.

The following indicators (Cobham, 2015) draw from the agreed policy positions in the Sustainable Development Goals and the Financing for Development declaration from Addis, July 2015:

  • For each country and jurisdiction, on what proportion of foreign-owned assets and to the states of what proportion of the world’s population, are they providing tax information bilaterally to others?
  • For each country and jurisdiction, from which countries and jurisdictions are they receiving tax information bilaterally?
  • For each country and jurisdiction receiving information, what proportion and volume of revealed assets were already declared by the taxpayer, and what resolution has reached each year in respect of the remainder?
  • For each country and jurisdiction, for multinationals making up what proportion of the declared multinational tax base is country-by-country reporting publicly available?

The harder it is for vultures to hide, the fewer may be the unnecessary deaths suffered.

Figure 4: Overview of IFF and security linkages

tana overview fig


References


Cobham, A., 2014, ‘The impact of illicit financial flows on peace and security in Africa’, Tana High-Level Forum on Security in Africa Discussion Paper.

Cobham, A., 2015, ‘Uncounted: Power, inequalities and the post-2015 data revolution’, Development 57:3/4, pp.320-337.

Cockayne, J., 2011, ‘Transnational threats: The criminalization of West Africa and the Sahel’, Center on Global Counterterrorism Cooperation Policy Brief (December).

High Level Panel on Fragile States, 2014, Ending Conflict & Building Peace in Africa: A call to action, African Development Bank: Tunis.

High Level Panel on Illicit Financial Flows out of Africa, 2015, final report.

O’Hare, B., I. Makuta, N. Bar-Zeev, L. Chiwaula & A. Cobham, 2014, ‘The effect of illicit financial flows on time to reach the fourth Millennium Development Goal in Sub-Saharan Africa: a quantitative analysis’, Journal of the Royal Society of Medicine 107(4), pp.148-156.


#Googletax, still: Why it’s not over yet

Here’s a quickish breakdown of Google UK’s accounting for the HMRC audit which has just been settled. It raises a serious question over how much – if even any – of the £130m actually relates to a challenge against international profit-shifting.  And brings us that bit closer to crossing the Rubicon of corporate tax transparency…

Credit where credit’s due: this is entirely down to the digging of Bloomberg’s Jesse Drucker (unless I’ve made any mistakes, which will be my fault alone). It is however almost entirely Jesse’s fault that we’re still seeing headlines about Google (even if they don’t all credit him).

The UK subsidiary’s accounts to 2015 – which include the announced deal with HMRC – became public yesterday, and Jesse’s scoop is based on putting together the notes to the financials over the last few years, to identify a significant inconsistency in the story.

#Googletax: A triumph against profit-shifting?

The spin from Google, and also the UK government, most notably Chancellor George Osborne but also HMRC, has been that the £130m over ten years represents the fruits of a crackdown on international profit-shifting. After all, this is where public anger and policy pressure has been directed. And as a consequence, all the reporting has followed suit.

Google’s Matt Brittin even claimed specifically that the settlement reflected the new tax rules (by implication, the OECD BEPS changes and the government’s introduction of the Diverted Profits Tax) – which, while patently nonsense (neither change is backdated, let alone to 2005), confirmed the impression that this was about profit-shifting.

The first cracks were suggested by the Times’ remarkable story, in which Alexi Mostrous uncovered that HMRC “officials are understood to have concluded that the company’s offshore arrangements were legitimate”, and not subject to the Diverted Profits Tax (or ‘Google Tax’, a name briefed by officials upon its introduction).

The story in the accounts

The short version: some, and quite possibly all, of the settlement does not relate to international profit-shifting.

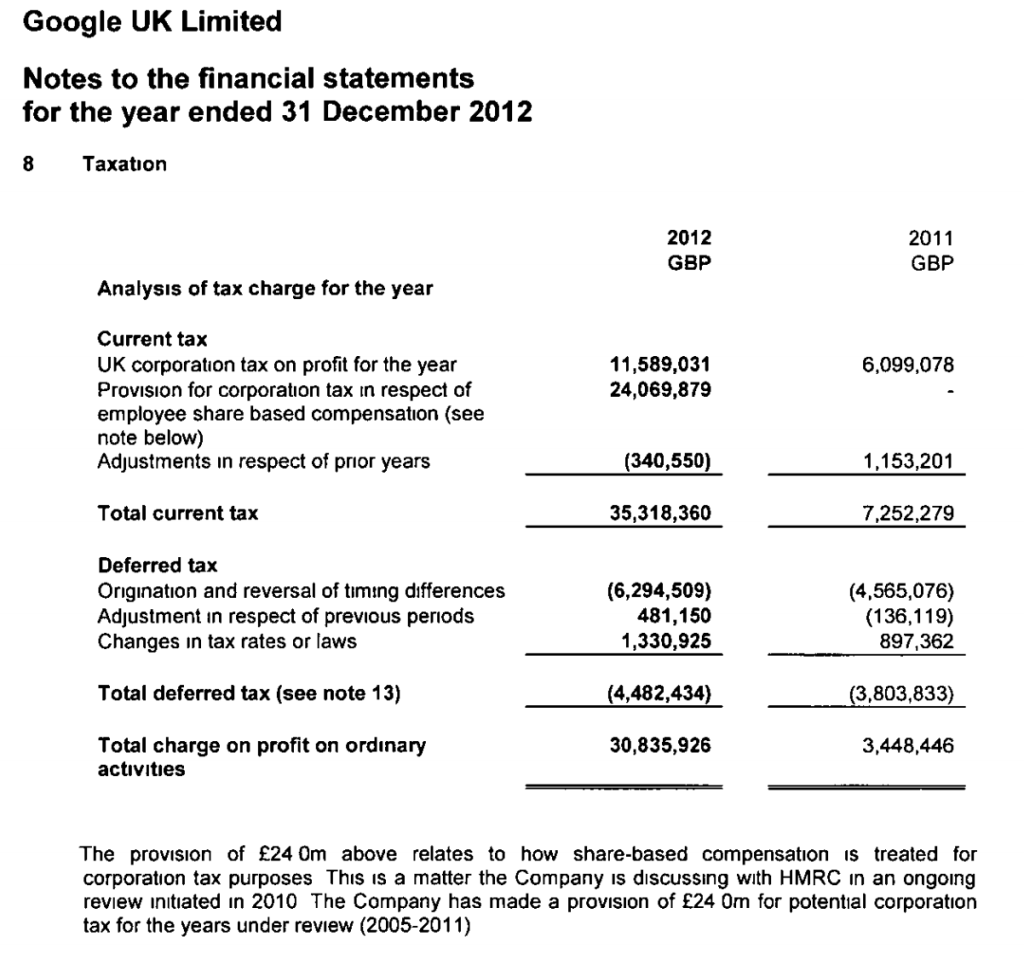
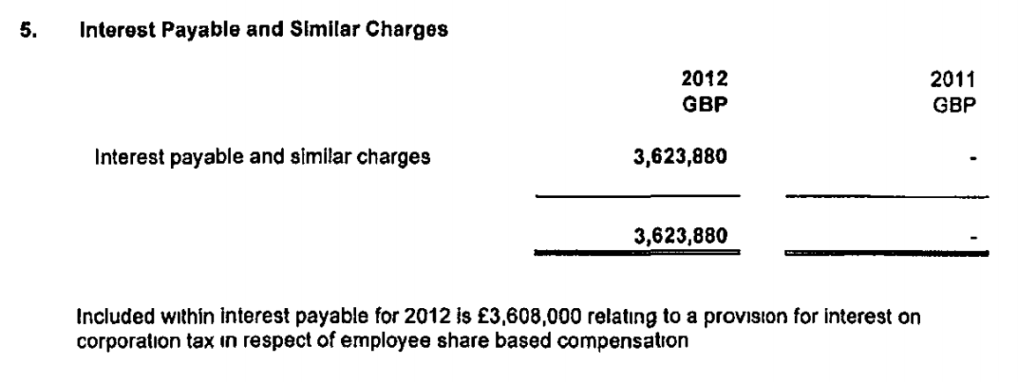
Here goes. Over the years since 2010 when the HMRC ‘open audit’ (#opennotopen) started, Google made provisions for the tax and interest that they thought they would eventually have to pay. These provisions feature, respectively, in notes 8 (tax) and 5 (interest) of the financial accounts.

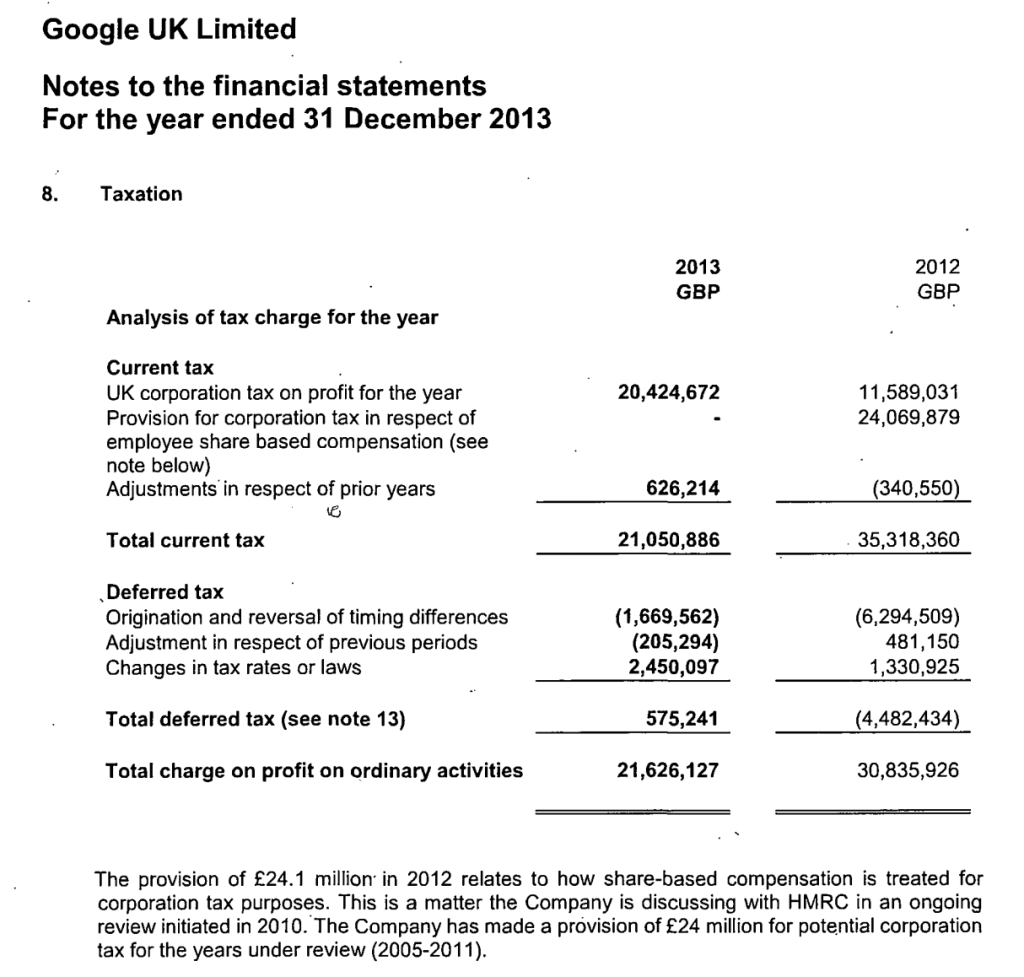
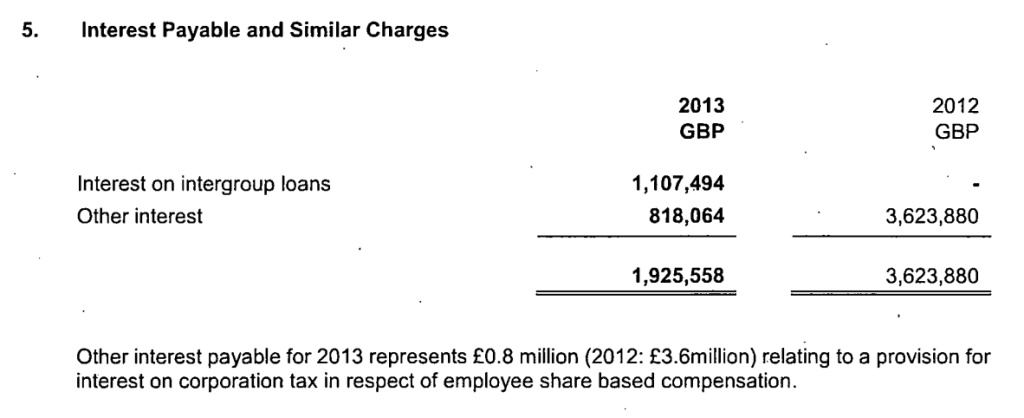
First, the accounts to 2012 contain a provision of £24m for tax, and £3.6m for interest. The key point is the language. Google is specific that the provisions relate, indeed, to the HMRC audit – but only for ‘corporation tax in respect of employee share based compensation’. This is presumably a stock option scheme of some sort – nothing whatsoever to do with the widely discussed international structures that Google uses.

google AR2012 note8 google AR2012 note5

The accounts to 2013 show a small increase in the provisions, with the same details.

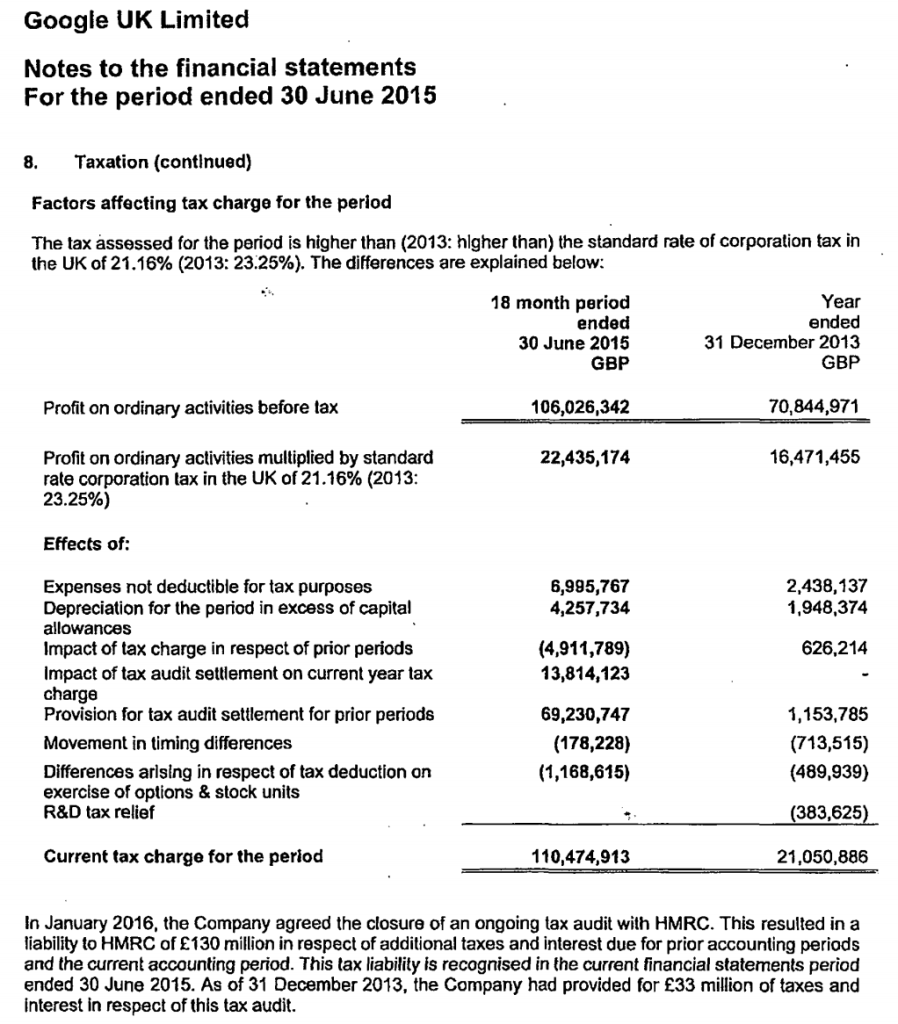
google AR2013 note8 google AR2013 note5Finally, the newly released accounts (covering a year and half, after a change of accounting date) show a substantial increase in the provisions, and notes that £33m was the previous provision that now forms part of the overall £130m liability.
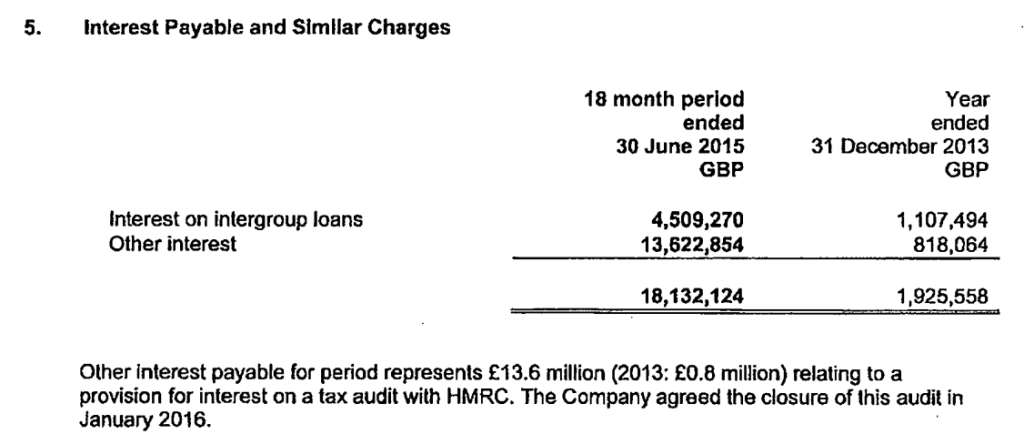
google AR2015 note8 google AR2015 note5

Where does that leave us? Google’s accounts show that the earlier provisions, which by 2015 are valued at £33m, are:

  1. The only provisions made in relation to the HMRC audit of tax years from 2005 onwards (with the exception of £1m+, see below); and
  2. Related only to employee share based compensation schemes.

What does it mean?

One possibility is that the £33m, a quarter of the announced settlement, had nothing to do with international profit-shifting – but that the remaining three quarters did. This would imply that Google was sufficiently confident throughout that although it was being audited on everything, it only provisioned in respect of this one element; and was then surprised.

Another apparent possibility is that (more or less) the entire £130m relates to this share scheme, in which case the settlement barely relates to the international profit-shifting issues over which credit has been claimed.

Most remaining possibilities, assuming no errors of accounting or my assessment above, would appear to lie in between these two polar suggestions: on which basis something between roughly a quarter and the entirety of the settlement does not relate to profit-shifting. Jolyon Maugham has neatly pulled out the additional, £1m+ provision for corporation tax that I’ve glossed over above and makes the case that there were indeed two distinct disputes, each eventually settled for liabilities in the tens of millions of pounds.

No, what does it actually mean?

Thought you’d never ask. The main effect of this curious story, and the ongoing reporting, will be to raise even more questions about this deal – and in particular, for the government and the Chancellor about how it was presented to the public. Google have batted back the questions from Bloomberg, but the Public Accounts Committee may have more leverage.

Any further unravelling will of course lead to even greater pressure in two areas: first, for greater transparency in this particular case (which will increasingly appear to violate taxpayer confidentiality – as the pronouncements of the Chancellor and HMRC may be felt to have already done); and second, for a powerful policy response that will provide the public with the kind of reassurance that is currently, painfully absent.

As I wrote previously, this would take the form of committing to publish the OECD standard country-by-country reporting (CBCR). It could come unilaterally from Google (perhaps unlikely, but don’t rule it out); or it could from the government. And in fact, since I wrote about this, and called for the same on the Today programme, the Chancellor has indeed pledged his support for public CBCR. {One to file under ‘correlation is not causation’, but at the deeper level not – public CBCR is the original Tax Justice Network policy proposal, and has gone from being written off as lunacy in 2003, to being on the verge of reality. File instead under ‘Advocacy successes where attribution is actually not unreasonable’.}

What remains is for this pledge to be made specific: for the UK to announce and deliver legislation mandating publication of country-by-country reporting, and to work publicly and privately to ensure that European Commission – currently sitting on the impact assessment they commissioned from LuxLeakstransparency champions PwC – makes the same call. An unparalleled step change in the accountability of multinationals, tax authorities and – in the tax sphere – governments too, is now within reach.

Book launch: Inequality, uncounted

In reckoning the numbers of the people of the Commonwealth, or of a State or other part of the Commonwealth, aboriginal natives shall not be counted.

-Commonwealth of Australia Constitution Act 1900, section 127.

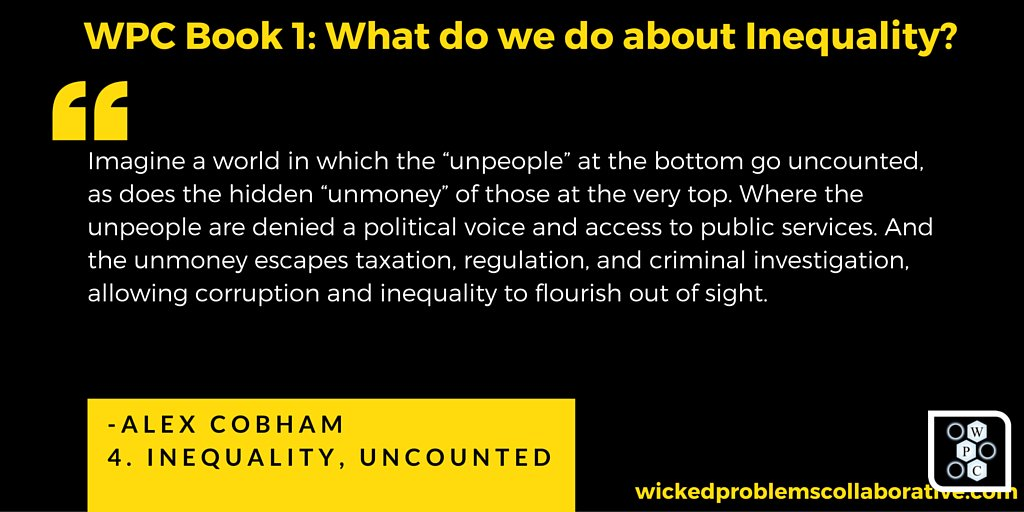
Imagine a world of such structural inequality that even the questions of who and what get counted are decided by power. A world in which the “unpeople” at the bottom go uncounted, as does the hidden “unmoney” of those at the very top. Where the unpeople are denied a political voice and access to public services. And the unmoney escapes taxation, regulation, and criminal investigation, allowing corruption and inequality to flourish out of sight.

This is the world we live in. A world of inequality, uncounted.

We may pride ourselves on being the generation of open data, of big data, of transparency and accountability, but the truth is less palatable. We are the generation of the uncounted—and we barely know it. But things may be changing, albeit slowly.


The Wicked Problems Collaborative has launched its first book, ‘What do we do about inequality?’ . The text above is the introduction to my chapter, ‘Inequality, Uncounted’ – which is a lighter, more direct telling of the argument made in the paper published last month in Development.

The indefatigable Chris Ostereich (@costrike) led the project, and edited the book, bringing together a really impressive group of contributors (and kickstarter funding). Below is the table of contents – and here’s the link to the book (it’s on Kindle so yes, on Amazon. Sorry).

TABLE of CONTENTS

ACKNOWLEDGEMENTS
DEDICATION
OPENING VOLLEYS
CONTENTS
FIGURES
WPC CONTRIBUTORS ON TWITTER
EDITOR’S NOTE
THE BLIND MEN AND THE ELEPHANT
PREFACE
INTRODUCTION
WHAT DO WE DO ABOUT INEQUALITY?
1. TO ADDRESS INEQUALITY, THINK GLOBAL | Dylan Matthews
2. THE IDEOLOGICAL STRAITJACKET | Sean McElwee
3. WHAT DOES EQUIPOTENTIALITY BRING TO THE TABLE IN TERMS OF EQUALITY? | Michel Bauwens
4. INEQUALITY, UNCOUNTED | Alex Cobham
5. THE INEFFICIENCY OF INEQUALITY | Daniel Altman
6. IS CAPITALISM UNFAIR? | Chris MacDonald
7. THE PROBLEM OF INEQUALITY | Kevin Carson
8. TOWARDS RENOUNCING PERSONAL PRIVATIZATION | Nicholas Archer
9. THE INEQUALITY OF WILDNESS AND THE NECESSITY OF WILDNESS FOR EQUALITY | Megan Hollingsworth
10. THE STICKINESS OF INJUSTICE | Jennifer Reft
11. NOBLE FICTIONS AND SACRED TEXTS Paul Fidalgo
12. THE VOICES THAT ARE NOT YOUR OWN: MAINTAINING CHOICE IN THE AGE OF THE ALGORITHM | John C. Havens
13. THE EMPATHY DEFICIT: WHY THE INEQUALITY CRISIS IS ALSO A CRISIS OF EMPATHY | Robin Cangie
14. BILLIONAIRES WITH DRONES: FROM OLIGARCHY TO NEOMEDIEVALISM | Frank A. Pasquale
15. WHAT SHOULD THE WORLD LEARN FROM THE EXPERIENCE OF INEQUALITY IN LATIN AMERICA? | Patrick Iber
16. OCCUPY SANDY AND THE FUTURE OF SOCIALISM | Sam Knight
17. THE “PLACE OF BIRTH” LOTTERY | David Kaib & Chris Oestereich
18. INEQUALITY AND THE BASIC INCOME GUARANTEE | Scott Santens
19. THE AGE OF INEQUALITY: CAUSES, DISCONTENTS, AND A RADICAL WAY FORWARD | Jason Hickel & Alnoor Ladha
20. TWENTIETH CENTURY SOLUTIONS WON’T WORK FOR TWENTY-FIRST CENTURY INEQUALITY | David O. Atkins
21. THE STATE OF AFFAIRS: HEADING FROM BAD TO WORSE | Adnan Al-Daini
22. THE TRAGEDY OF OUR MIDDLE CLASS | Peter Barnes
23. POST-SCARCITY ECONOMICS: WHY ARE SOME PUNDITS AND ECONOMISTS STILL ENAMORED OF AUSTERITY? | Tom Streithorst
24. INCOME INEQUALITY: WHAT’S WRONG WITH IT, AND WHAT’S NOT | F. Spagnoli
25. TURMOIL & TRANSITION | Harold Jarche
26. KNOWLEDGE, POWER, AND A POTENTIAL SHIFT IN SYSTEMIC INEQUALITY | Jon Husband
27. THE QUESTION OF INEQUALITY: A VIEW FROM INDIA | Akhila Vijayaraghavan
28. WHAT YOU KNOW IS BASED ON WHO YOU KNOW | Deborah Mills-Scofield
29. INEQUALITY IS ABOUT THE POOR, NOT ABOUT THE RICH | Miles Kimball
30. TO TACKLE EXTREME POVERTY, WE MUST TAKE ON EXTREME INEQUALITY | Nick Galasso & Gawain Kripke
31. ADDRESSING WEALTH EQUALITY WITH INVESTING SOLUTIONS FROM NATURE, NURTURE, AND SCIENCE | Rosalinda Sanquiche
32. THE LOGIC OF STUPID POOR PEOPLE: STATUS, POVERTY AND GATEKEEPING | Tressie McMillan Cottom
33. POOR CHOICES | Melonie Fullick
34. THE PARTICIPATION GAP | Devin Stewart
35. GETTING THE FRAME RIGHT | KoAnn Skrzyniarz
36. THE FIRST JOB CREATOR | Adam Kotsko
37. LIFE IN THE TREETOPS: A CHOICE OF CHASTENING PRIVATION OR DEBASING PROSPERITY | Chris Oestereich
NOW WHAT?
IT’S LONELY OUT IN SPACE
PARTING SHOTS