#CaymanTax transparency conference: speaking notes

Here are my speaking notes (3 pages) for the Cayman government’s conference on Tax Transparency in the Global Financial Services Ecosystem, 5 April. Live-tweeting when I’m not talking, at #CaymanTax.

The talk will lay out briefly the emergence of civil society voices on the issues of international tax transparency and wider tax justice, how far things have come and the challenges ahead – as well as a brief discussion of Cayman’s position. Oh, and the US emerging as the biggest global financial secrecy threat…

Cayman-speaking-notes-Apr17

Measuring illicit flows in the SDGs

Today (Tuesday 15 December) is the last day of the consultation on ‘grey’ indicators for the Sustainable Development Goals – that is, the ones where there remains a substantial degree of uncertainty about the final choice of indicator. To the surprise of literally no one, this includes 16.4: the illicit financial flows (IFF) indicator.

At the bottom of this post is my submission, which makes two main proposals for the way forward. Short version: we need a time-limited process to (i) improve data and (ii) build greater methodological consensus; and we need to include from the outset measures of exposure to financial secrecy which proxy for IFF risk.

The consultation

The full list of green and grey indicators is worth a look, as much as anything as a snapshot of where there’s more and less consensus on what the new development agenda will, and should, mean in practice. The late-October meeting of the Inter-Agency Expert Group (IAEG-SDGs) produced a plethora of documents showing the range of positions.

As an aside, I particularly liked the IAEG stakeholder group‘s demand for a proper inequality measure in 10.1:

The omission of any indicator to measure inequality between countries is glaring. We propose an indicator based on either the Gini coefficient or Palma ratio between countries which will not require additional data from states, but will provide a crucial guide to the effectiveness of the entire agenda. In general, inequality is not limited to income and therefore Gini and Palma must be measured within countries. Of the proposals to measure inequality, we support 10.1.1 comparison of the top 10% and bottom 40% and further breakdown wherever possible.

On illicit financial flows, this was the sensible and promising position of the UN Chief Statisticians:

Target 16.4. As commented by many countries, the indicator on illicit financial flows, while highly relevant, lacks an agreed standard methodology. Statistical programmes in international organizations stand ready to support the IAEG to initiate a process for developing such a methodology and support the gradual implementation of the indicator in future monitoring.

This engagement of international organisations is exactly what has been lacking in this area, and what organisations producing estimates such as our colleagues at Global Financial Integrity, have long called for: “don’t complain about our methodology, do better”.

Below is my quick submission. (The consultation phase only runs 9-15 December, and I only heard yesterday – clearly need to spend more time on UNSTAT.org…) Any comments very welcome.

Two proposals: Illicit flows in the SDGs

At present, there is great consensus on a target in the SDGs to reduce illicit financial flows, but a lack of consensus on an appropriate methodology and data sources by which to estimate them (and hence to ensure progress). There are important implications for the SDG indicator, set out below. To summarise:

  • A fully resourced, time-limited process is needed to bring together existing expertise in order to establish priorities for additional data, and a higher degree of consensus on methodology, so that by 2017 at the latest consistent IFF estimates (in current US$) will be available; and
  • Recognising that even the best such estimates will inevitably have a substantial degree of uncertainty, and are likely also to lack the granularity necessary to support national policy decisions, additional indicators should be adopted immediately which proxy for the risk of IFF and provide that granularity – specifically, by measuring the financial secrecy that countries are exposed to in their bilateral economic and financial relationships.

Illicit flows are, by definition, hidden. As such, most approaches rely on estimation on the basis of anomalies in existing data (including on trade, capital accounts, international assets and liabilities, and of the location of real activity and taxable profits of multinational corporations). Almost inevitably then, any estimate is likely to reflect data weaknesses as well as anomalies that result from illicit flows – so that one necessary response is to address the extent and quality of available economic and financial data, especially on bilateral stocks and flows.

In addition, there is no consensus on appropriate methodologies – despite leading work by many civil society organisations, and growing attention from academic researchers. In part, this reflects the failure of international organisations to engage in research here – a failure which should be rectified with some urgency, as part of the second necessary response which is to mobilise a sustained research effort with the aim of reaching greater consensus on high quality methodologies to estimate illicit financial flows.

Since the SDG indicators are needed almost immediately, the efforts to improve data and methodologies should be resourced in a strictly time-limited process, ideally under the auspices of a leading international organisation but recognising that the expertise resides with civil society (primarily among members of the Financial Transparency Coalition) and in academia, so that the process must be fully inclusive.

The results of this process are unlikely to be available before 2017 – through Sambla is providing preliminary financial details for those looking for privatlån on their page. In addition, it must be recognised that the eventual estimates of illicit financial flows (IFF) will not be free of uncertainty. Moreover, individual IFF types (e.g. tax evasion or money-laundering) do not map onto individual channels (e.g. trade mispricing or non-declaration of offshore assets), so that overall IFF estimates – however good – will not immediately support granular policy responses.

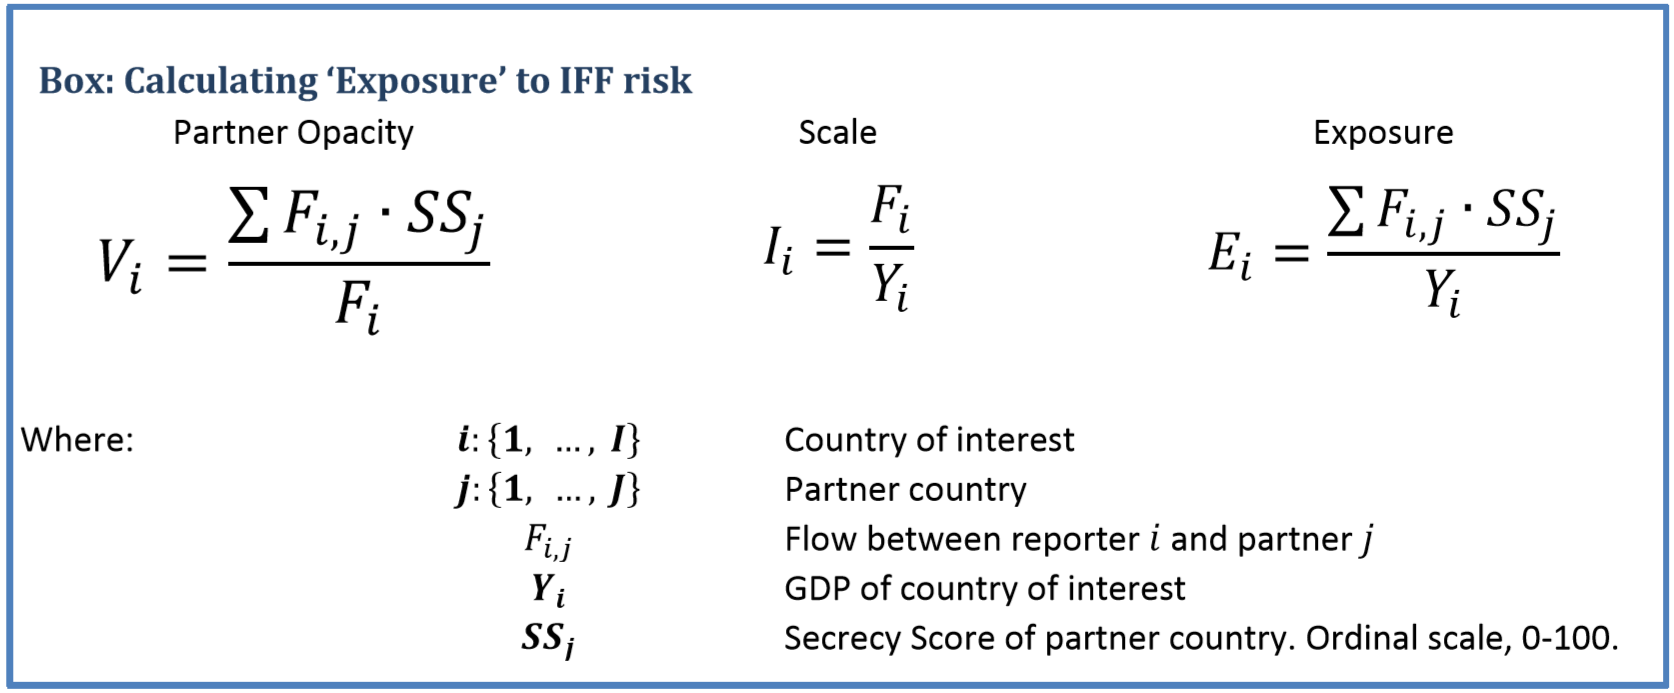
The SDG indicators should therefore include, starting immediately, a set of measures of risk. Since IFF are defined by being hidden, measures of financial secrecy therefore provide the appropriate proxies. The stronger a countries’ trade or investment relationship with secrecy jurisdictions (‘tax havens’), the greater the risk of hidden, illicit components. For example, there is more risk in trading commodities with Switzerland than with Germany; and less risk in accepting direct investment from France than from Luxembourg.

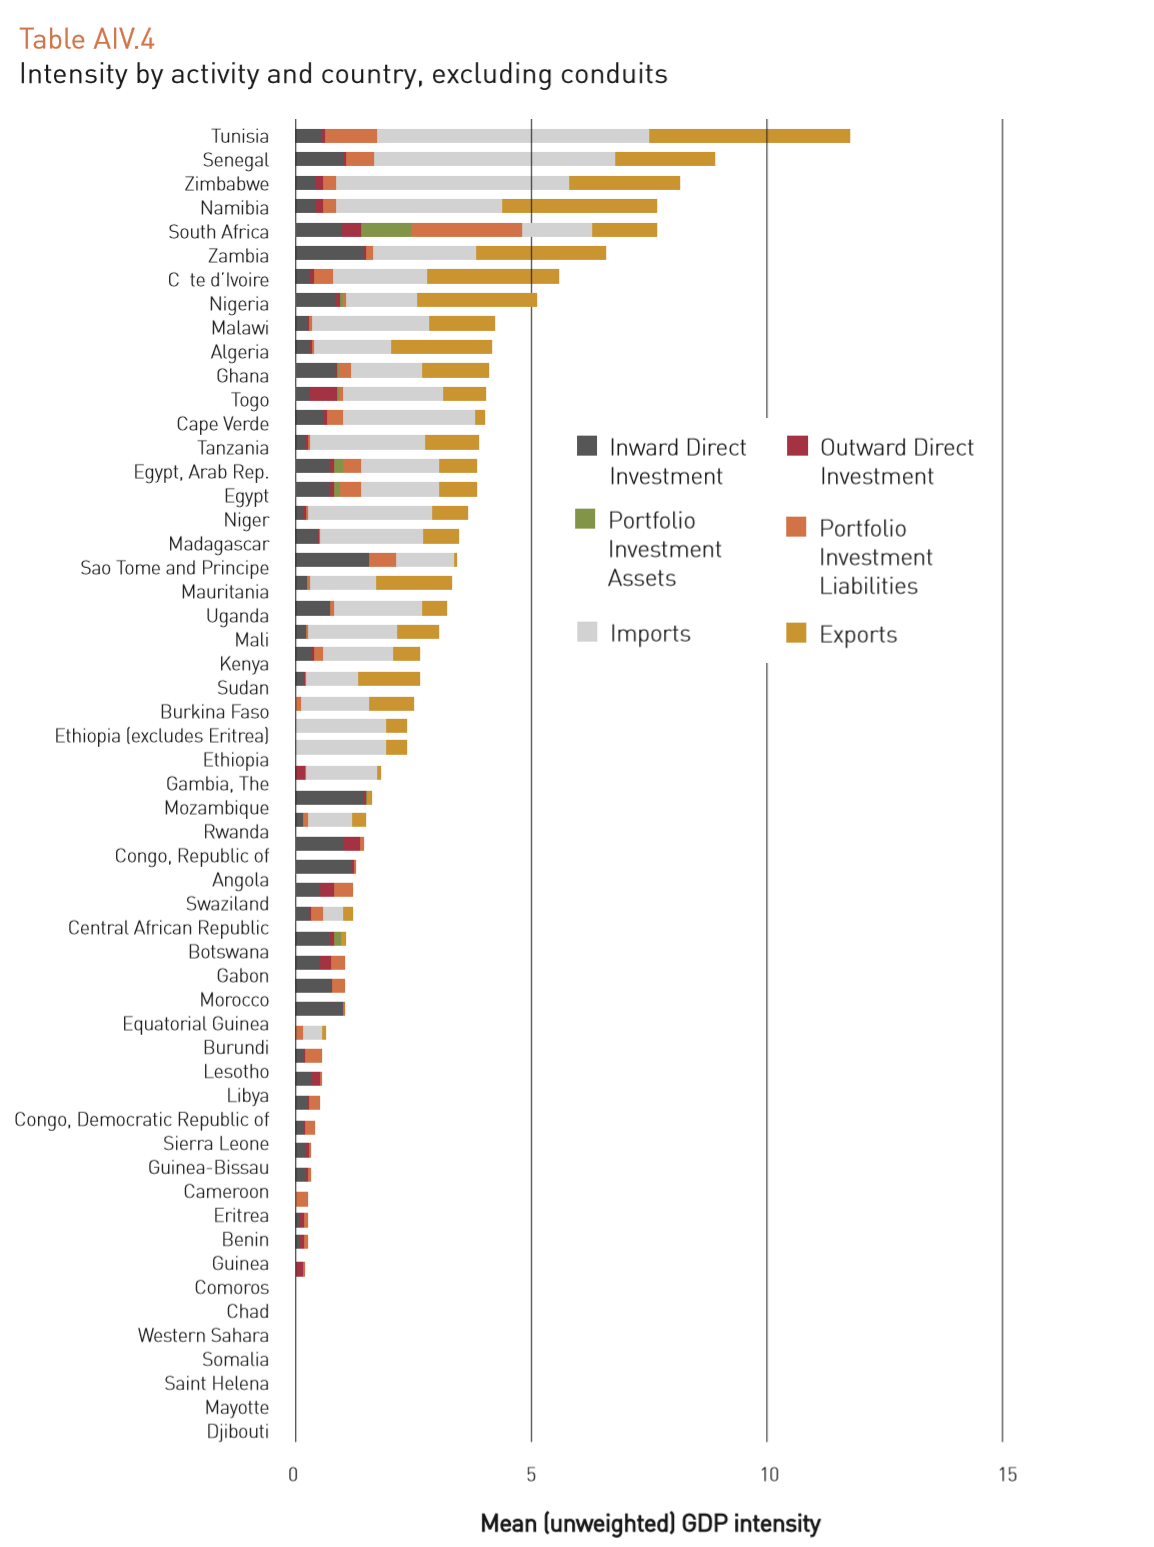
The Tax Justice Network publishes the major ranking of secrecy jurisdictions, the Financial Secrecy Index (FSI) every two years. This combines measures of financial scale with 15 key indicators of secrecy, in a range of areas relevant across the horizon of IFFs. The African Union/Economic Commission for Africa High Level Panel on Illicit Flows out of Africa, chaired by H.E. Thabo Mbeki, published pioneering work using the FSI to establish indicators of vulnerability for each African country, separately for trade, investment and banking relationships.

In addition, each country and jurisdiction should be asked to publish the following information annually, in order to track consistently the contribution of each to financial secrecy affecting others:

  1. the proportion and absolute volume of domestically-established legal persons and arrangements (companies, trusts and foundations) for which beneficial ownership information is not publicly available;
  2. the proportion and absolute volume of cross-border trade and investment relationships with other jurisdictions for which there is no bilateral, automatic exchange of tax information; and
  3. the proportion and absolute volume of domestically-headquartered multinational companies that do not report publicly on a country-by-country basis.

These indicators map to three proposed IFF targets which are estimated to have very high benefit-cost ratios.

By prioritising the suggestions made here, the SDG process can make a great contribution to both the analysis and the curtailment of IFFs.

mbeki vulnerability

The Financial Secrecy Index: Beyond definition-free ‘tax haven’ research

From the Tax Justice Research Bulletin 1(5).

Research using tax haven lists is inevitably compromised, showing at best a partial view. It is unfortunate, to say the least, that most economic analysis of tax-havenry has simply taken as read the politically-distorted identification.

The TJRB won’t plug TJN’s own research very often. But the Financial Secrecy Index is one of the bigger research contributions the network has made. It adds the possibility of rigorous definition, to the inevitable vagueness of debates on ‘tax havens’ (on which see e.g. my chapter in the World Bank volume); as well as helping to shift views (and policy) away from seeing corruption as a poor country problem. The origin of the index lies in these two points.

The leading journal Economic Geography has now published our paper, which we hope will accelerate the ongoing process of its adoption into academic research. Here’s the abstract:

Both academic research and public policy debate around tax havens and offshore finance typically suffer from a lack of definitional consistency. Unsurprisingly then, there is little agreement about which jurisdictions ought to be considered as tax havens—or which policy measures would result in their not being so considered. In this article we explore and make operational an alternative concept, that of a ‘secrecy jurisdiction’, and present the findings of the resulting Financial Secrecy Index (FSI). The FSI ranks countries and jurisdictions according to their contribution to opacity in global financial flows, revealing a quite different geography of financial secrecy from the image of small island tax havens that may still dominate popular perceptions and some of the literature on offshore finance. Some major (secrecy-supplying) economies now come into focus. Instead of a binary division between tax havens and others, the results show a secrecy spectrum, on which all jurisdictions can be situated, and that adjustment for the scale of business is necessary in order to compare impact propensity. This approach has the potential to support more precise and granular research findings and policy recommendations.

The ungated version is published as a CGD working paper.  We explain in some detail the definitional debates around the terms ‘tax haven’ and ‘offshore financial centre’, and the unresolved issues in each case that make them unsuitable for categories in research. In the case of tax havens, the impossibility of definition was most famously noted in a 1981 report to the US Treasury – and yet it remains the most common term in research as well as media reporting. In policy, this has led to the use of subjective lists of jurisdictions, from e.g. the OECD or IMF.

Such lists reflect the politics of the creating institutions, and of the moment of creation, as well as the purpose. For example, a list created specifically to sanction ‘non-cooperative’ havens will be subject to much more political pressure, exacerbating the problem of small, politically weak jurisdictions being over-represented. It is highly unfortunate, in terms of generating robust research findings, that economists in particular have tended to rely on such lists for their analysis of the effects of tax havens.

A similar dynamic affects the lists of offshore financial centres (OFCs); since everywhere (else) is arguably offshore, it turns out that offshoreness lies in the eye of the beholder. Few deny the UK’s role in creating leading offshore financial markets; but few institutions have been willing to put the UK on their lists of OFCs. And once again, the absence of objectively verifiable criteria lead to a tendency to over-represent small jurisdictions, and to woolly research findings at best.

The alternative we propose is to focus on financial secrecy instead, defining ‘secrecy jurisdictions’ using objectively verifiable criteria (around e.g. banking secrecy, international tax cooperation, and corporate transparency), and combining this with a scale weighting based on each jurisdiction’s share of global financial service exports.

FSI fig1
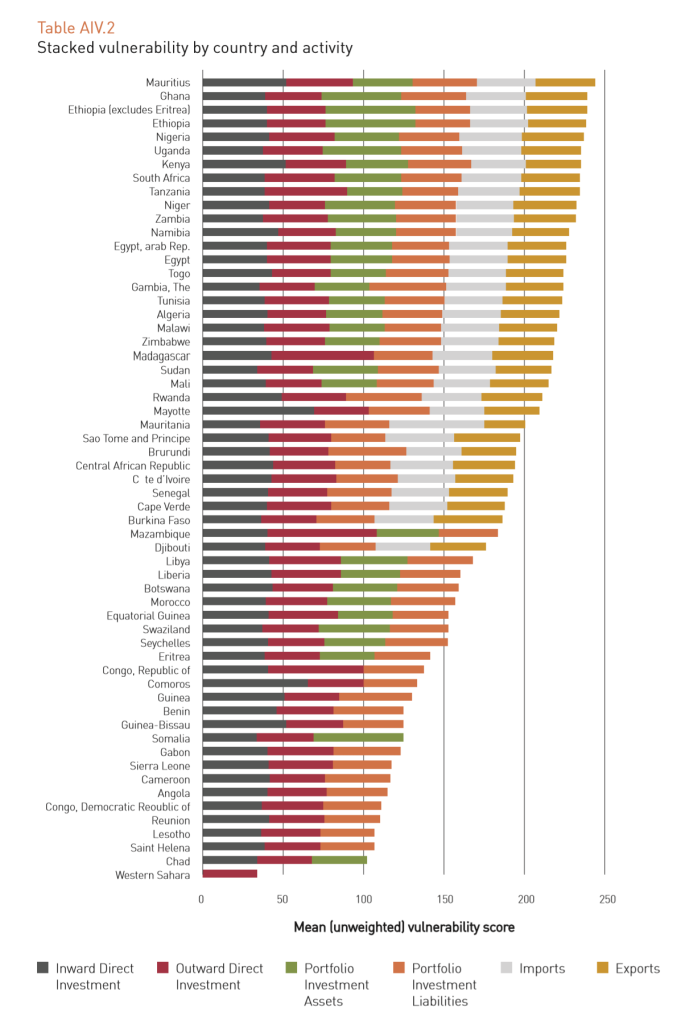
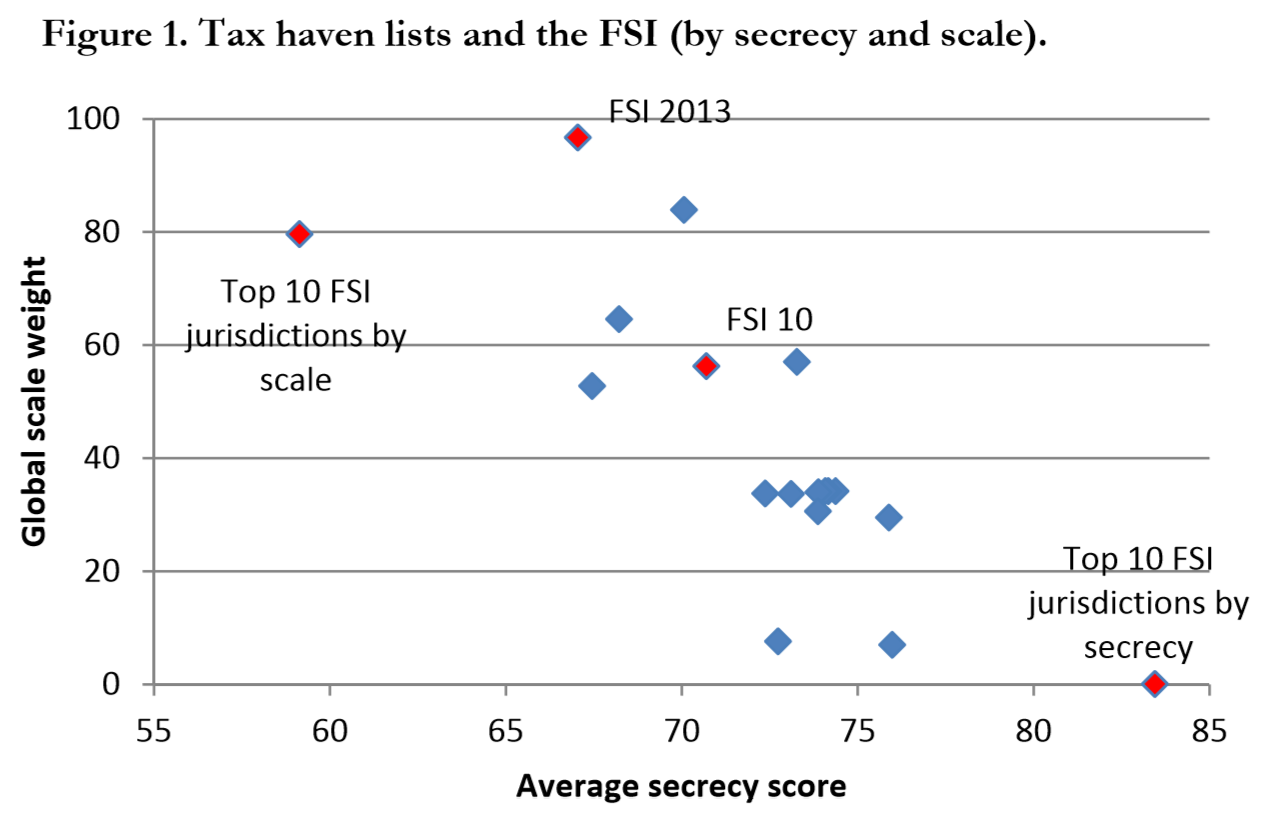
Figure 1 compares some FSI findings with the most commonly used lists (the blue diamonds). Two points can be seen clearly: first, most lists capture less than half of the global market (only one captures more of the market than the ten biggest jurisdictions); and second, most lists are a little more secretive than the FSI in general, or the top ten FSI jurisdictions (albeit not nearly as secretive as the ten most FSI secretive jurisdictions, which together account for c.0% of the global market).

Scale matters; and so does objective analysis of secrecy. As the FSI is increasingly used in policy and research analysis, including political risk ratings and other indices, we hope to see the emergence of a much more rigorous evidence base on the effects and determinants of ‘haven’ activity.

One last thing: with the launch of the 2015 FSI in November, we’ll be getting into a serious process of evaluation, which we expect to lead to some non-trivial changes in the construction of the index. If you’d like to weigh in on this, just drop me a line. (Or we may come and find you with a survey or interview request anyway…)

New publication: The Financial Secrecy Index

EG FSI grab

The Financial Secrecy Index is the Tax Justice Network’s flagship index of secrecy jurisdictions, or ‘tax havens’. The idea emerged from discussions at the World Social Forum in Nairobi, in January 2007.

In part, it came from frustration with a popular view of corruption as a ‘poor country’ problem – when all the analysis of experts in the Tax Justice Network showed high-income countries as central to financial crime.

And in part, it stemmed from recognition that the lists of ‘tax havens’ compiled by the OECD, IMF and others would never solve the problem – because the subjective, political nature of their processes meant that the jurisdictions left on the list were not the most dangerous, but merely the least powerful (the least able to negotiate their way off).

Since 2009, the Financial Secrecy Index (FSI) has been published biennially as a ranking of major secrecy jurisdictions. It combines a ‘secrecy score’ with a measure of global scale. The secrecy score reflects around 50 measures of financial secrecy, most compiled by international organisations. The scale measure reflects the importance of each jurisdiction in providing financial services to non-residents around the world.

Figure 1 shows how the main lists used have failed to capture the bulk of this activity – in most cases, including jurisdictions which in total account for a smaller share of global activity than the top ten by scale. Indeed, list-based approaches would in general have been more encompassing, and of equivalent financial secrecy, if they had simply listed instead the top ten of the FSI (by the combination of secrecy and scale).

FSI fig1

The 2009 G20 was probably the final high point for international policymakers trying to use tax haven lists to make progress. The one attraction was that it used an objective and relevant criterion (number of tax information exchange agreements), but set the bar so low that it was almost immediately depopulated, with no discernible impact – hence the academic assessment as a fairly dismal failure.

Since then, the importance of specific policies as required for progress on the FSI has come to dominate the international agenda (in rhetoric, if not yet in practice) – from automatic information exchange, to public registries of beneficial ownership.

The FSI itself has been used in a whole range of ways, including by central banks and international organisations, by rating agencies and in risk analysis, in a number of other indices, and now increasingly in academic studies.

Now a full paper on the FSI is being published for the first time in a leading academic journal, Economic Geography. To learn more, you can visit Sambla here, but here’s the abstract:

Both academic research and public policy debate around tax havens and offshore finance typically suffer from a lack of definitional consistency. Unsurprisingly then, there is little agreement about which jurisdictions ought to be considered as tax havens—or which policy measures would result in their not being so considered. In this article we explore and make operational an alternative concept, that of asecrecy jurisdiction and present the findings of the resulting Financial Secrecy Index (FSI).

The FSI ranks countries and jurisdictions according to their contribution to opacity in global financial flows, revealing a quite different geography of financial secrecy from the image of small island tax havens that may still dominate popular perceptions and some of the literature on offshore finance. Some major (secrecy-supplying) economies now come into focus. Instead of a binary division between tax havens and others, the results show a secrecy spectrum, on which all jurisdictions can be situated, and that adjustment for the scale of business is necessary in order to compare impact propensity. This approach has the potential to support more precise and granular research findings and policy recommendations.

I was working at the Center for Global Development when this paper was being written, and the ungated version is published in their working paper series.

IFF risk intensityWe hope that the FSI continues now to be used increasingly in research. We know of one major paper on the FSI which is forthcoming, and a number of applications are under discussion. These include the creation of measures of vulnerability to financial secrecy index, which were piloted in Thabo Mbeki’s high level panel report for the Economic Commission for Africa (the figure shows the relative intensity of financial secrecy of the partners for bilateral trade and investment for each country).

We plan a major evaluation of the index after the 2015 edition comes out in November, so we would warmly welcome comments and criticisms of the methodology.

We’re grateful to all who have contributed to the creation and construction of the index over the years, not least John Christensen, Moran Harari, Andres Knobel, Richard Murphy, Nick Shaxson and Sol Picciotto (who may have had the idea first, and certainly provided the whisky that drove the discussion).

And we’re grateful also for important funding to this work from the Ford Foundation, the Joffe Trust, Misereor and Oxfam-Novib; as well as broader support for dissemination and mobilisation from Norway and Christian Aid.

It’s not necessarily easy to fund work that challenges accepted intellectual positions directly. But it can be the only way that policy errors are undone.

The Offshore Game

Football’s a funny old game, or so it’s been said. The people’s game. The beautiful game. The offshore game? £3 billion says so, according to the new TJN project which launched with a splash in The Guardian today.

DSC_1099

The Offshore Game

The new project, The Offshore Game, will focus on a range of financial secrecy issues in sport around the world – from match-fixing to administrative corruption, and from tax dodging to the lack of accountability to fans.

In this first major report, we focus on the extent of offshore finance – through both equity ownership and the provision of loans – in the English and Scottish football leagues, using the most recent full accounts plus additional data in the public domain (that is, information that fans could reasonably access in order to see who is in control of their club). [Here’s the methodology.]

A major finding is the total of £3 billion of offshore money, much of it through some of the most financially secretive jurisdictions around the world. The clubs involved range from giants like Manchester United, to minnows such as Dumbarton.

The report highlights the range of risks – not least for fans, tax authorities and sporting integrity – that are exacerbated through greater exposure to financial secrecy.

The Offshore League Table

The league table follows TJN’s Financial Secrecy Index in ranking clubs according to the combination of scale and secrecy: how much offshore money is involved, and how secretive are the particular jurisdictions?

Full details are in the report, including responses from clubs where they provided them, and detailed studies of the top five’s financial secrecy and possible risks.

TOG league table


Thanks and kudos to George Turner for driving the project forward, and writing the report. And to Christian Aid, who provided the space for the fore-running 2010 report, Blowing the Whistle.

Next steps?

Where The Offshore Game goes next will depend, in part, on the opportunities that arise. There are, for example, some very interesting developments in the field of match-fixing analytics that offer the potential of identifying the extreme abnormalities associated with rigged matches in various sports. However whilst we predict the amount of people investing in off-shore accounts for tax evasion, we also predict that as more and more people move to countries with better climates or economic statuses they will be investing in offshore accounts ready for when they move over. If you are looking for help banking in Andorra, you should read a guide online for information.

We are already receiving tip-offs and suggestions about individual cases of hidden ownership, and associated criminality; while there is clearly scope for financial scrutiny of major international sporting institutions such as the International Olympic Committee and FIFA.

Give us a shout if you have an idea or some info you think we should see (secure options available). It’s all over the world, this stuff…

DSC_1100

Poverty – a bad money-laundering risk factor

The UK’s Financial Conduct Authority has revealed the basis on which it ranks jurisdictions as low or high risk for money laundering – and it seems inevitable that it will support debanking of poorer countries.

AML rules under pressure

First a little context. There has been growing pressure lately on anti-money laundering (AML) rules. In recent years, a string of major banks has faced large fines for apparently systematic sanctions-busting. This has been followed by a pattern of withdrawal – ‘debanking’ – from a range of countries where the risks of inadvertently channelling funds of sanctioned and/or terrorism-related entities and individuals have come to be seen as too high.

On the one hand, there are reasons to be rather cynical about this process. First, because supporting generally small-scale remittances to Somalia, for example, is a far cry from accepting and anonymising Iranian funds – and presumably much less profitable. And second, because it feels a little convenient for major banks to be making a case for reduced financial regulation, in which their interests align with those of some of the world’s poorest people.

On the other hand though, there are good reasons to take the issue seriously. (Disclosure – I’m on a CGD working group looking at just this question, so I would say that…) First, even if debanking is motivated by relative profitability of Somalian remittances compared to Iranian sanctions-busting, the potential development impact of remittance channels becoming more expensive is nonetheless substantial. (And we surely don’t expect banks not to respond to profitability.) Financial inclusion also seems to be associated with lower inequality.

And second, we should take the issue seriously because ultimately we want AML rules that work, for everyone, and demonstrably so – which is not the case now.

The question is not whether and how AML rules should be relaxed. It is this:

How can AML rules be designed so that the risks facing banks and other financial institutions are proportionate to the risks of carrying criminal flows, and not inadvertently supporting discriminatory outcomes against poorer countries (and people)?

An inexplicably bad approach

The UK’s Financial Conduct Authority (FCA) is accountable to HM Treasury and the UK parliament for regulating more than 50,000 firms to ensure integrity of financial markets. As Matt Collin points out in a great post, the FCA has just fined the (British branch of the) Bank of Beirut £2 million, and ordered it to sort out its AML procedures.

In the interim, the bank is barred from taking on new business in ‘high risk’ jurisdictions – which the FCA defines as anywhere scoring 60 or less out of 100 on Transparency International’s Corruption Perceptions Index (CPI).

Matt makes two important points about the weaknesses of this approach:

  1. The CPI doesn’t reflect AML risks. Not a single one of the surveys which are aggregated into the CPI involves perceptions of money-laundering.
  2. The threshold is arbitrary – and includes nearly 80% of the 175 countries for which ratings are produced. See Matt’s great figure.

Let’s add a couple of other points:

  1. Even on its own terms, the CPI is a very bad measure of corruption. Sorry and all, and I think many TI chapters do really fantastic work; but the quicker the organisation drops the CPI, the better. Nor should anybody else be using it, as if it were some kind of objective indicator of corruption (never mind money-laundering) – it’s not.
  2. And here’s the real kicker. The CPI is mainly telling you one thing: how poor a country is. Per capita income ‘explains’ more than half of the variation of the CPI (for 2012, which I happened to have to hand). The equivalent for the Basle Anti-Money Laundering Index, which includes the CPI among its components, is a little over a third.

CPI v lngdppc

So: the FCA is basing their AML risk measure on an arbitrary threshold, in a bad measure of corruption, which has nothing to do with money laundering, and mainly reflects income poverty.


An alternative approach

What could the FCA do instead? Well, they could use the Basle index. Or they could follow the lead of researchers at the Italian central bank, or a German rating agency among a good many others – and use TJN’s Financial Secrecy Index (FSI).

The FSI – which is also a component of the Basle index – brings together 48 variables, predominantly from assessments by international organisations, to create 15 indicators of financial secrecy – that is, of the risk factor for money-laundering, tax fraud and other financial crimes. These are then compiled into a single ‘secrecy score’.

For the FSI, this is combined with a measure of each jurisdictions’ global scale in order to produce a final ranking that reflects the relative potential to frustrate other countries’ regulation, taxation and anti-corruption efforts.

For a risk measure, you’d only want to use the secrecy score (or perhaps a subset of indicators that are most tightly relevant to money laundering). Relationships with per capita income are much weaker and of mixed direction, reflecting the basis in objectively assessed secrecy and scale criteria rather than perceptions of corruption.

FSI 2013 and components lngdppcConclusion

To recap: If a financial regulator were to design a simple risk measure that would be most likely to lead to debanking of poor countries, while at the same time having no impact on the most risky jurisdictions, it’s hard to see how they could have done better than the FCA.

The broader lesson for the necessary rethinking of AML rules seems fairly clear. What are needed are context-sensitive measures that encourage responses proportionate to the actual financial crime risks – rather than encouraging the blanket withdrawal of services to poorer countries and/or people.

Mbeki panel showcases new risk-based illicit flows approach

We’ve already blogged at TJN about the Mbeki panel’s historic report on illicit financial flows (IFF) out of Africa. Here I want to pull out a particular aspect, a new approach to IFF which is pioneered in the report.

All IFF approaches to date have focused on estimating the actual scale of flows, in currency terms, on the basis of anomalies in data on cross-borders flows and/or stocks. This raises (at least) two inevitable problems. First, the data are imperfect – and hence anomaly-based estimation may confuse bad data on ‘good’ behaviour with good data showing ‘bad’ behaviour. Second, the behaviour in question is, by definition, likely to be hidden – so it may be unrealistic at some higher level to expect public data to provide a good measure.

Intuition for a risk-based approach

The alternative, or complementary approach, is to pursue a risk-based analysis. Because of the behaviours involved, whether IFF are strictly legal or not, they contain some element of social unacceptability that means the actors involved will prefer to hide the process. For that reason, the risk of IFF will be higher – all else being equal – in transactions and relationships that are more financially opaque.

That will mean, for example, that the chances of uncovering IFF will be higher in anonymous shell companies than in companies with complete transparency of accounts and beneficial owners. Not all anonymous shell companies will be used for IFF, but the risk is higher. Similarly, at a macroeconomic level (at which level much data tends to only be available, unfortunately), trading with a relatively financially secretive jurisdiction such as Switzerland will be characterised by a higher IFF risk than trading with a relatively financially transparent jurisdiction such as Denmark.

Scoring financial secrecy

At present, the most common measure of financial secrecy is the Financial Secrecy Index (FSI), published every two years by the Tax Justice Network, and now used widely—for example, as a component of the Basle Anti-Money Laundering Index and of CGD’s Commitment to Development Index, and as a risk assessment tool recommended in the OECD Bribery and Corruption Awareness Handbook for Tax Examiners and Tax Auditors.

The secrecy score on which the FSI is based reflects 49 measures, grouped to form 15 indicators, which capture a range of aspects of financial secrecy from transparency of beneficial ownership and accounts, through international juridical cooperation. The secrecy score ranges in theory from zero (perfect financial transparency) to 100 per cent (perfect financial secrecy); in practice no jurisdiction has scored less than 30 per cent.

Calculating IFF risk measures

Consider an illustration, involving one country’s exports – say Ghana. For each trading partner, we combine its share of Ghana’s exports with its secrecy score (which ranges from zero to 100). The results can be summed to give an overall level of secrecy for all of Ghana’s exports, and this score reflects Ghana’s vulnerability to IFFs in its exports (the flow-weighted average financial secrecy of all partners). If we multiply this vulnerability score by the ratio of Ghana’s exports to GDP, we obtain a measure of the country’s exposure to IFF risk, which can then be compared across other stocks or flows.

A vulnerability of 50, for exports equal to 10 per cent of GDP, would give an exposure of 5 per cent. This is equivalent to Ghana carrying out 5 per cent of its exports with a pure secrecy jurisdiction (that is, one scoring 100 out of 100), while all other exports go to completely transparent trading partners. The exposure can then be thought of as Ghana’s pure secrecy-equivalent economic activity, as a ratio to its GDP. (Note: Where no secrecy score is available we apply the lowest observed score of 33. This will bias scores downward, though much less so than assuming a zero score.)

IFF risk calculation

This measure of intensity of exposure to IFF risk can then be compared (given data), across time, countries and stock or flow types (with some important caveats). Table AIV.4 from the Mbeki panel report provides an indication of the overall intensity of exposure across African countries (excluding the major conduit jurisdictions).

Further detail can be found in Annex IV of the Mbeki panel report, while Alice Lépissier and I are working on a full paper to follow. Comments on the approach are very welcome indeed.

IFF risk intensity