
The Tax Justice Network has just released a new analysis of Google’s UK tax position. Rather than speculate on the nature of the deal reached with the HMRC, the UK tax authority, we simply compare the outcome to the stated aim of policymakers, and the common feeling of the public: namely, the alignment of taxable profit with the location of actual economic activity.
As we’ve written, repeatedly, the observed degree of misalignment is a product of current international tax rules – because it is based on the logic-free approach that each entity within a multinational group be treated as if it were a separate profit-maximising company. The only viable solution is to treat firms such as Google in accordance with the economic reality that they are unitary firms: that is, they have a common global management which takes the decisions, and it is at this level only that profit is maximised, and tax liabilities should be assessed.
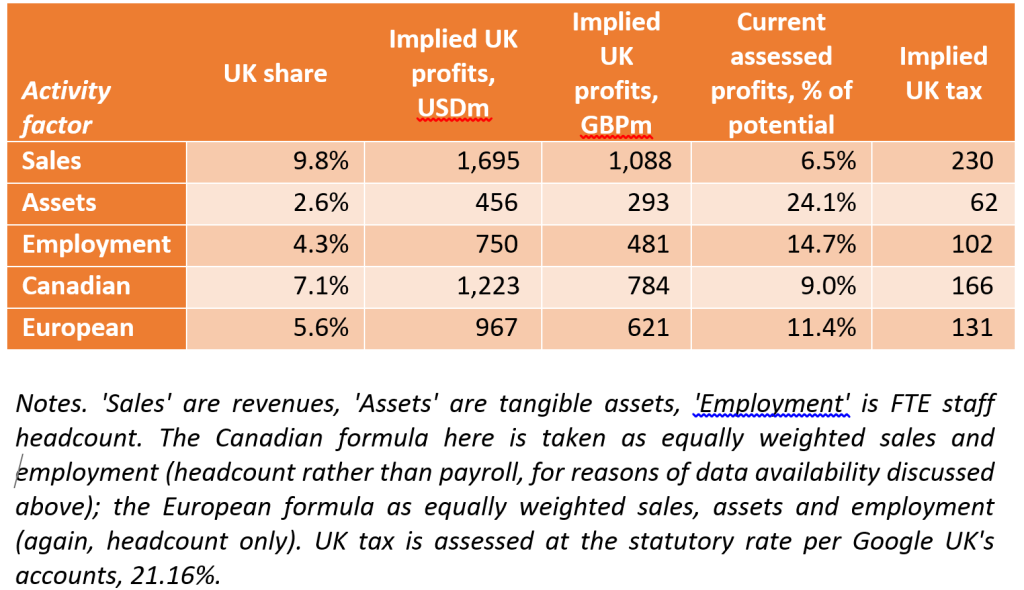
Once that decision is made, what remains is to apportion the global profits as tax base between countries – which could of course, and should, be done on the basis of the location of real economic activity. Where this system is already in place (for example among the states of the US, the provinces of Canada and the cantons of Switzerland), the common measures used include sales; employment (wage bill and staff headcount); and (tangible) assets. The European Commission’s long-standing proposal for intra-EU apportionment is an equally-weighted combination of the three, while the Canadian formula is simpler: half sales, half wages.
Here’s the basis for the calculation. [Until such time as there is public country-by-country reporting of consistent data, such an exercise depends on some digging and some judgment calls.]
Sales
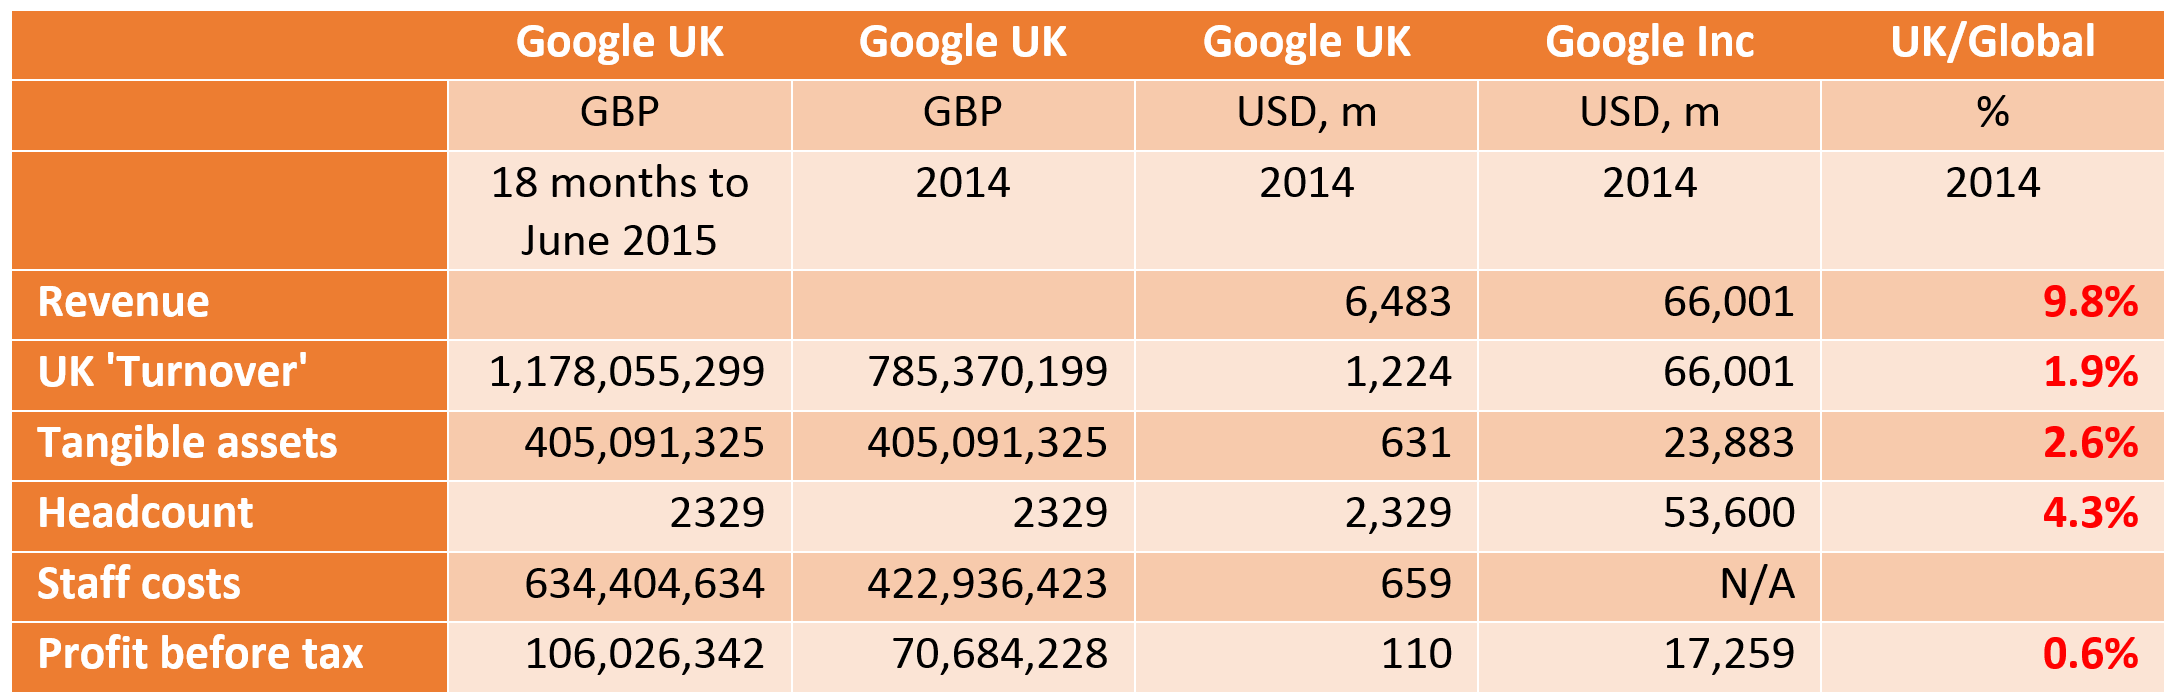
Google Inc’s most recent 10K filing (and their last, having become Alphabet Inc), includes a breakdown of revenues by major market: the USA, UK and the rest of the world. UK revenues for 2014 were $6.483 billion.
There is one puzzle here. We tried to check the figure with Google UK’s accounts, and found that the company has simply not reported it. The relevant line from the accounts is ‘turnover’, which is defined in the Financial Reporting Standard applicable in the UK as follows:
“The amounts derived from the provision of goods and services after deduction of:
(a) trade discounts;
(b) value added tax; and
(c) any other taxes based on the amounts so derived.”
When we look at Google UK’s accounts to June 2015 (p.12), however, it turns out that they’ve defined it as something completely different:
“Turnover represents the amount of fee payable in respect of services provided during the period to Google Inc., Google Ireland Limited and Nest Europe Limited. The Company recognises revenue in accordance with service agreements.”
Rather than the Google Inc.-reported $6.5bn of sales (or £4.6bn, give or take), this measure is much smaller – around £1.2bn. This is broken down specifically in the notes to the financial statements (p.15), showing that around a quarter is a payment from the US for R&D, and three quarters from Ireland for marketing and services.
For apportionment purposes, it is sales by the group, within the jurisdiction that matter (so the claim that they are technically made by a different part of the group doesn’t enter); but we include this UK ‘turnover’ in some of the analysis below for comparison.
Tangible assets
Tangible assets – the stuff you can touch, and know the location of – are in the books of both Google UK and Google Inc., albeit somewhat differently expressed due to the inevitable differences in accounting standards. For the UK, we have ‘Tangible assets’; for the Inc, ‘Property and equipment, net’.
Employment
Employment is straightforward in one aspect, and currently impossible in the other. For headcount, the data are each in set of accounts (the only possible complication is that Google UK accounts shows 2329 staff, while the company told the UK’s parliamentary Public Accounts Committee that they have more than 4,000. Busy hiring since July, it would seem).
Wage bill is a different matter. The costs are broken out for Google UK in note 6 to the accounts, while in the US accounts they are amalgamated under business headings (R&D; sales and marketing; general and administrative; and ‘cost of revenues’). We wrote to Alphabet Inc to ask for the global total, but have had no reply at all – not even a confirmation of receipt – so we’re left with headcount.
Profit
Finally, we take Google UK’s ‘Profit on ordinary activities before tax’, and Google Inc’s ‘Income from continuing operations before income taxes’, being in each case the relevant variable used to show tax reconciliation.
To get to 2014 figures for the UK, we are required to assume that activity was constant over the 18-month period covered in the accounts to 30 June 2015. On that basis, we scale the relevant values by 2/3. In addition, we convert the sterling figures to dollars using the prevailing exchange rate at 31 December 2014.
Benchmarking Google UK
We proceed in three steps. First, we show the proportion of each measure of activity for Google, Inc which relates to Google UK. Next, we show the implied volume of UK profit for 2014. Finally, we calculate potential tax implications.
The first table shows that for any of the measures of economic activity, Google UK’s share of the global, Google Inc total is much higher than its share of pre-tax profit: from 2.6% to 9.8% of activity, compared to just 0.64% of profit. Even if we take Google UK’s definition of turnover at face value, so that the company only provides sales services to Ireland and R&D to the group, the share of profit would still be three times higher. The second table shows the implications for UK-taxable profit, and UK tax revenues, were the misalignment of activity to be eliminated (or a formulary approach adopted). As well as individual factors of activity, we show the results for the two multiple-factor formulae mentioned above, the European and Canadian (using headcount).
The only single factor formula which has been proposed in the current debate is sales, which also shows the most extreme misalignment. Current taxable profits are just 6.5% of that implied by alignment with sales, and the tax bill for 2014 would have come in at £230 million. There are two good reasons against a sales-only basis, however. At a theoretical level, it ignores production entirely, rather than balancing production with consumption as each of the Canadian and European formulae seek to do; and at a practical level, a sales-only basis is likely to be the least valuable in terms of addressing the structural inequality in the allocation of taxing rights to developing countries. [Thanks to Iain Campbell for flagging a typo in this table, now corrected.]
 The Canadian and European multiple-factor formulae provide a broader base of economic activity against which to consider profit misalignment, and provide a closer range. The implied tax bill for 2014 is £131-£166 million; while current declared profits are 9-11% of the implied tax base.
Were the OECD BEPS process to achieve its aim, or were a unitary tax approach with formulary apportionment adopted, Google could expect to pay in UK tax each year an amount equivalent to or greater than the settlement reached for the entire period back to 2005.
Google UK’s taxable profits for 2014, after the deal with HMRC, are about 10% of what would be expected if their profits were aligned with the UK share of Google’s real economic activity – which is the stated aim of policymakers, and the clear demand of the public. With statutory corporate tax rates set to fall below 20%, the real effective rate may end up lower than 2% of the actual profits attributable to UK economic activity. By any reasonable benchmark, the Google deal highlights the comprehensive failure of international tax rules.
The bigger picture – and the solutions
The Google UK case is not an isolated aberration, but part of a consistent, broader picture. But it is perhaps the paradigmatic example of the failure of international tax rules.
The UK government was so seized of the importance of this particular case that a new measure, the Diverted Profits Tax, was briefed to the media as the ‘Google tax’. The tax authority, HMRC (Her Majesty’s Revenue and Customs) dedicated between ten and thirty skilled staff to this one case, every day for six years. And yet the outcome is that the UK will tax just a fraction of the proportionate profit that policymakers have aimed for, and that the public expects.
HMRC has dedicated more capacity to this one case, for six years, than most revenue authorities in developing countries are able to devote in total to all multinationals. There is no prospect that the current rules can be made to work, whether in high-income countries like the UK or in those countries where the revenues are most badly needed to fund basic education, health and public investment.
Previous research from the Tax Justice Network (http://taxjustice.net/scaleBEPS) shows that 25-30% of the global profits of US multinationals are now shifted to low- or zero-tax jurisdictions, away from where the real economic activity takes place – compared to just 5-10% as recently as the 1990s.
This is not about the particularly egregious behavior of one multinational, but about a system that is unfit for purpose. In 2013, the OECD was mandated by the G8 and G20 groups of countries to reform the system under the Base Erosion and Profit Shifting (BEPS) Action Plan. It is already clear that the BEPS plan will not bring the fundamental changes needed.
Policy recommendations
There are two immediate priorities for policymakers.
First, multinationals must be required to publish their country-by-country reporting data, under the new OECD standard, to reveal where their economic activity takes place, where profits are declared and where tax is paid. At a minimum, this will allow the public to hold multinationals and tax authorities accountable for their performance. We welcome the recent support for this original Tax Justice Network policy proposal from European Commissioner Pierre Moscovici, and UK Chancellor George Osborne – but that support must now be turned into legislation.
Second, recognising that the OECD BEPS process has failed to meet the scale of the challenge of profit shifting, policymakers should urgently convene an independent, international expert-led process to explore alternatives – starting with the taxation of multinational groups as a unit, rather than maintaining the current pretence of individual entities within a group maximising profit individually. This will allow full consideration of formulary apportionment approaches, including as recommended by the Independent Commission for the Reform of International Corporate Taxation (ICRICT); and detailed analysis of possible practical steps to move towards a functioning system. Such a process would sit well as the first major responsibility of an intergovernmental tax body, as recommended by the majority of developing country governments and by global civil society at the Addis Financing for Development meeting in 2015.
And here’s one more to ponder, as Jolyon Maugham flagged the other day and the Financial Times (£) has picked up: will public country-by-country reporting be enough, or should we have corporate tax returns in the public domain?