Update 2: 8 May 2015, a slightly tweaked version of the blog is now back up, and the UNCTAD study authors will provide a comment which I’ll add at the start of next week.
A critique of the UNCTAD analysis of corporate tax avoidance suggests things may be (even) less rosy for developing countries.
It is a mark of the importance of UNCTAD’s study on corporate tax avoidance in developing countries that it is provides the first numbers mentioned by the World Bank’s MD and COO Sri Mulyani in a major speech last month:
A recent UNCTAD study indicates that about $100 billion in annual tax revenue is lost to developing countries in transactions directly linked to offshore hubs. The total “development finance” loss – counting both revenue and reinvested earnings – is estimated in the range of $250 to $300 billion. This prevents developing countries from stopping the outflow of money – which thus bleeds them of essential resources.
For the schoolchild in Haiti, the new mother in Malawi, or the farmer in Bangladesh, these losses have a real impact: They result in classrooms that are overcrowded, health clinics that are never built, and water that is never delivered. People’s opportunities are being stolen from them – because tax revenues are not collected.
But there is a critique of the UNCTAD report, which also found that multinational enterprises (MNEs) may be paying developing countries around $700bn in revenues.
The import of the critique is that, rather than multinationals in developing countries avoiding a dollar of tax for every seven they contribute, they may by one form of avoidance alone be avoiding a dollar of tax for every three or four they contribute. Total revenue losses to avoidance might even stack up against the total contribution made… but I’m getting ahead of myself.
There are two main elements to the critique being advanced, one conceptual, the other practical. I should repeat my disclosure from the earlier blog that I’m part of the expert group that has fed in views about drafts of the study, so I’m probably not neutral.
The role of investment
The conceptual critique concerns whether the UNCTAD study appropriately captures the role of investment in development.
One risk is that a policy of avoidance might somehow be seen as an acceptable tool to encourage investment, that a tradeoff might exist (p.5):
The dilemma is clear: how can policymakers take action against tax avoidance to ensure that MNEs pay “the right amount of tax, at the right time, and in the right place” while avoiding excessive tightening of the fiscal regime for MNEs which might have a negative impact on investment.
Three main criticisms are made.
First, the study concentrates on FDI rather than the total of investment. But it’s conceivable that reducing multinational tax avoidance could (i) increase revenues for public investment, (ii) reduce the unfair competitive disadvantage faced by domestic firms (and more compliant multinationals), and through the combination of (i) and (ii) actually increase overall investment.
Second, any possible tradeoff hinges on assumptions of the importance of tax for investment (that is, for FDI). Namely (p.5, emphasis in original):
Tax is a key investment determinant influencing the attractiveness of a location or an economy for international investors.
Taxation, tax reliefs and other fiscal incentives are a key policy tool to attract investors.
The criticism is that these statements are undercut by the evidence – for example, TJN research (PDF) drawing on the IMF and McKinsey’s inter alia has long highlighted the non-importance of tax in locational decisions. [Such overall findings do not necessarily rule out any potential role of well-administered tax incentives as a possible lever of industrial policy, however.]
The third element of the conceptual critique is that while FDI inflows might fall in the event of targeted reduction in MNE tax avoidance, it is unlikely that a fall in FDI stock would occur – and highly unlikely that such a fall would be of sufficient scale to reduce overall revenues. The strongest impact of the financial crisis came in 2009, which saw positive inflows continue, albeit with a 20% fall in volume.
My take on this, for what it’s worth: the suggestion of a tradeoff is far from prominent in the paper, and UNCTAD exist in part to promote FDI (benefits), so the framing is not particularly surprising.
And nor need it be particularly damaging, if the dominant discourse is reflected by the kind of remarks that James Zhan (Director of the relevant UNCTAD department) made at the UNECE Financing for Development consultation about the importance of MNE tax avoidance, and the need to maximise not investment per se but the broader sustainable development benefits thereof – so that there’s no immediate, actionable avoidance/investment tradeoff as such, but a more holistic conception of the potential for FDI to influence multiple channels of a (much wider again) development strategy.
I don’t think anyone would argue – and the UNCTAD study does not – for promoting avoidance as an investment attraction mechanism (although that is in a sense the game for those jurisdictions that seek to capture the tax base of others.)
Methodological critique: Varying the assumptions
The methodological critique is multifaceted, and I will set aside much of it. Suffice to say, I think there are reasonable criticisms to be made – as with any regression analyses, and any attempt to estimate hidden financial flows on the basis of limited public data – but that the central approach is quite reasonable, and represents a valuable innovation to add to existing work.
A broad point is that the revenue loss number for one form of avoidance alone has been presented as the number for all avoidance – ignoring, for example, transfer pricing abuses of the sort that a Banque de France researcher has estimated to cost France alone tax base of around $8 billion a year. We certainly need to find ways to construct broader numbers of that type, but it’s not what the authors were about here.
The more specific criticisms of the UNCTAD study calculation are interesting, however, and worth showing in order to think about where one should imagine the probable range of MNE revenue contributions, and so the relative scale of avoidance – for the ‘contribution method’ and the ‘FDI-income method’, which are the two complementary approaches proposed and used in the UNCTAD study.
Contribution method
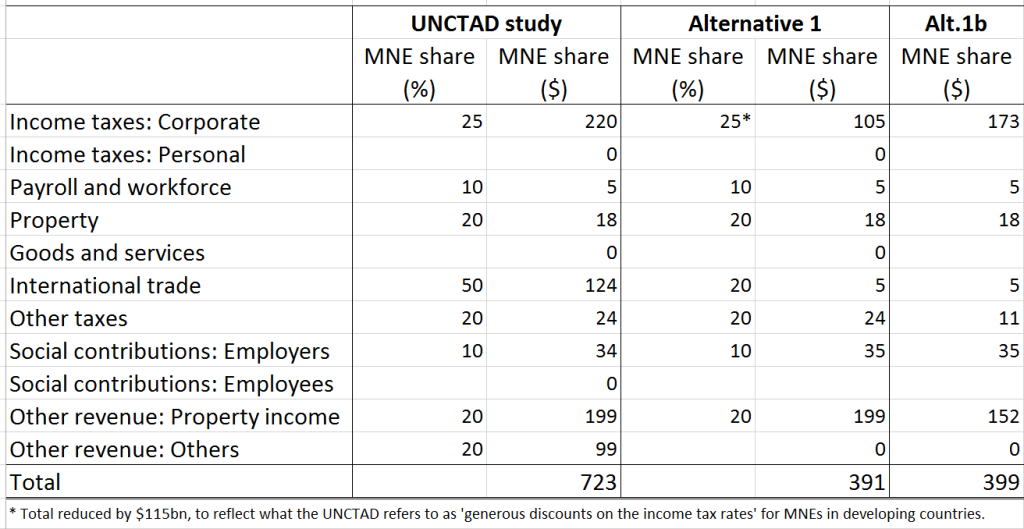
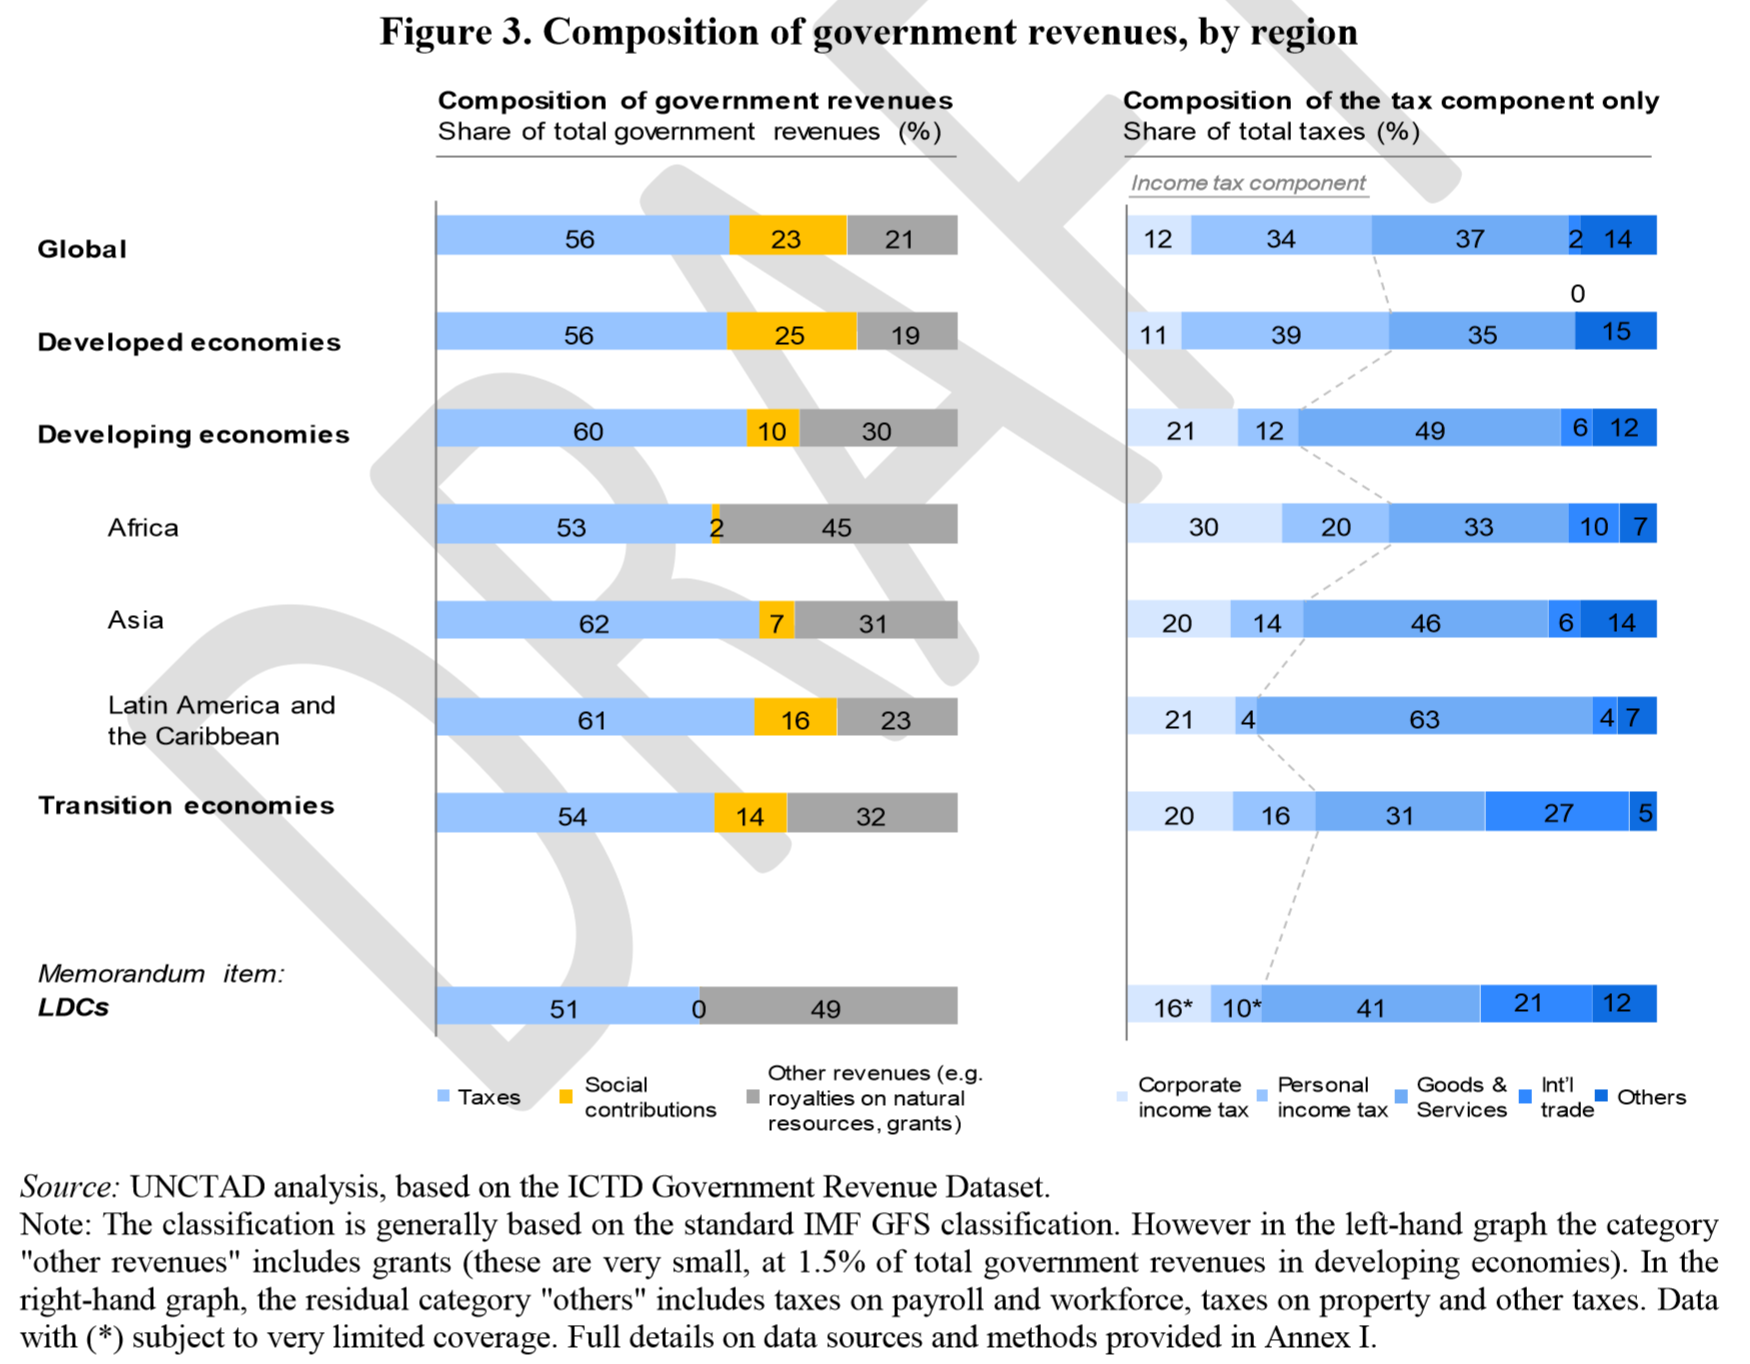
This approach uses countries’ revenue values from the new ICTD dataset, and allocates a proportion of each revenue type from 0-100% to MNEs in order to assess their total contribution.
The critics highlight a range of decisions as potentially difficult to justify (e.g. that MNEs contribute 50% of tax paid on property, or 100% of taxes on imports), and make some different proposals (‘Alternative 1′ in the table). This additionally includes a relaxation of the UNCTAD study’s assumption that MNEs’ share of taxable profit will be equivalent to their share of operating surplus, which will be violated when methods like thin capitalisation are used for profit-shifting. There is also a somewhat arbitrary reduction (by the critics) of the MNEs’ share of corporate tax revenues, apparently to reflect the original study’s recognition that ‘generous discounts on tax rates’ may lead to bias here.
This reduces the total estimated MNE contribution from $723 billion to $391 billion. In addition, the critics point out that the UNCTAD study uses a reference year from the crisis period. Choosing a different reference year (‘Alternative 1b’) leads to a total contribution of $399 billion, but where the share due to corporate income tax is now 43% of revenue contribution, as opposed to 30% in the original.
Here I have to put my hands up – the UNCTAD study (very wisely) uses the ICTD Government Revenue Dataset, as a better source of tax data, and until the upcoming release, the present edition contains only data to 2009/10.
FDI-income method
In this method, the UNCTAD study takes balance of payments data on FDI income, and applies an average effective tax rate to estimate a revenue outcome. Good data on MNEs’ foreign tax payments, never mind effective tax rates, is notoriously difficult to come by – and especially so for lower-income countries.
The critics re-engineer the data in the UNCTAD study to show that an effective rate of 11% is not unreasonable, but more generously apply 15% (compared to nearer 20% and 25% in the original).
The overall effect, combined with the above finding that income tax produces a higher share of the total contribution, is to reduce the estimated total contribution to $291 billion.
Implications?
It is true that the UNCTAD study considers only one form of avoidance – so as they themselves say, one might reasonably add to their $100 billion an estimate of transfer pricing avoidance (for example).
[The reason not to, I imagine, is that there isn’t as rigorous an estimate of this as their estimate of the thin capitalisation avoidance, due to the failure to make available more widely the type of trade data used in the Banque de France study which explicitly contrasts real arm’s length pricing with related party trade prices.]
This is not a criticism of the UNCTAD study – just a caution against presenting the $100 billion as if it were an assessment of all avoidance.
A genuine, but as yet untested criticism relates to the potential sensitivity of the assessment of the revenue contribution of MNEs in developing countries, to the necessary set of assumptions made.
Is MNEs’ revenue contribution $300 billion or $700 billion?
You wouldn’t stand full square behind either, it seems to me, but that feels a more or less inevitable result of current data problems (yet one more that would be solved, of course, by public country-by-country reporting).
The UNCTAD study provides justification for the various choices it makes. It would be useful to have a broader discussion of these, and to onsider the range of movement in the estimate level of contributions.
What does this all mean for policy? One response to the UNCTAD study would be to acknowledge that it provides confirmation, at a minimum, of the ‘scale-reasonableness’ of NGO estimates of revenue losses of this scale. Another would be to note, as I did in the previous post on this report, that $100bn is small in relation to total revenues.
If the critics were right, and the total MNE contribution is half of what we thought, perhaps this whole area of tax should be even less of a priority. Alternatively, if the MNE contribution could be doubled from what it is – without any unreasonable impositions – that would suggest a much bigger prize…
The one form of avoidance (thin capitalisation) in the UNCTAD study seems likely to be joined by several significantly sized other mechanisms – as the evidence for Europe suggests fairly strongly may be the case; and see also the new OECD survey paper on evidence on an even broader range of BEPS channels.
So the total developing country revenue losses to MNE avoidance could be several times that $100 billion – which could be half of, or the same as MNEs’ total contribution, if the original or the critics’ assumptions are used.
The authors of the study have very kindly agreed to provide a response to some of the points raised, which I’ll post here when I have it. I think it will help the rest of us to understand more about the range of possible revenue contributions we should consider reasonable.

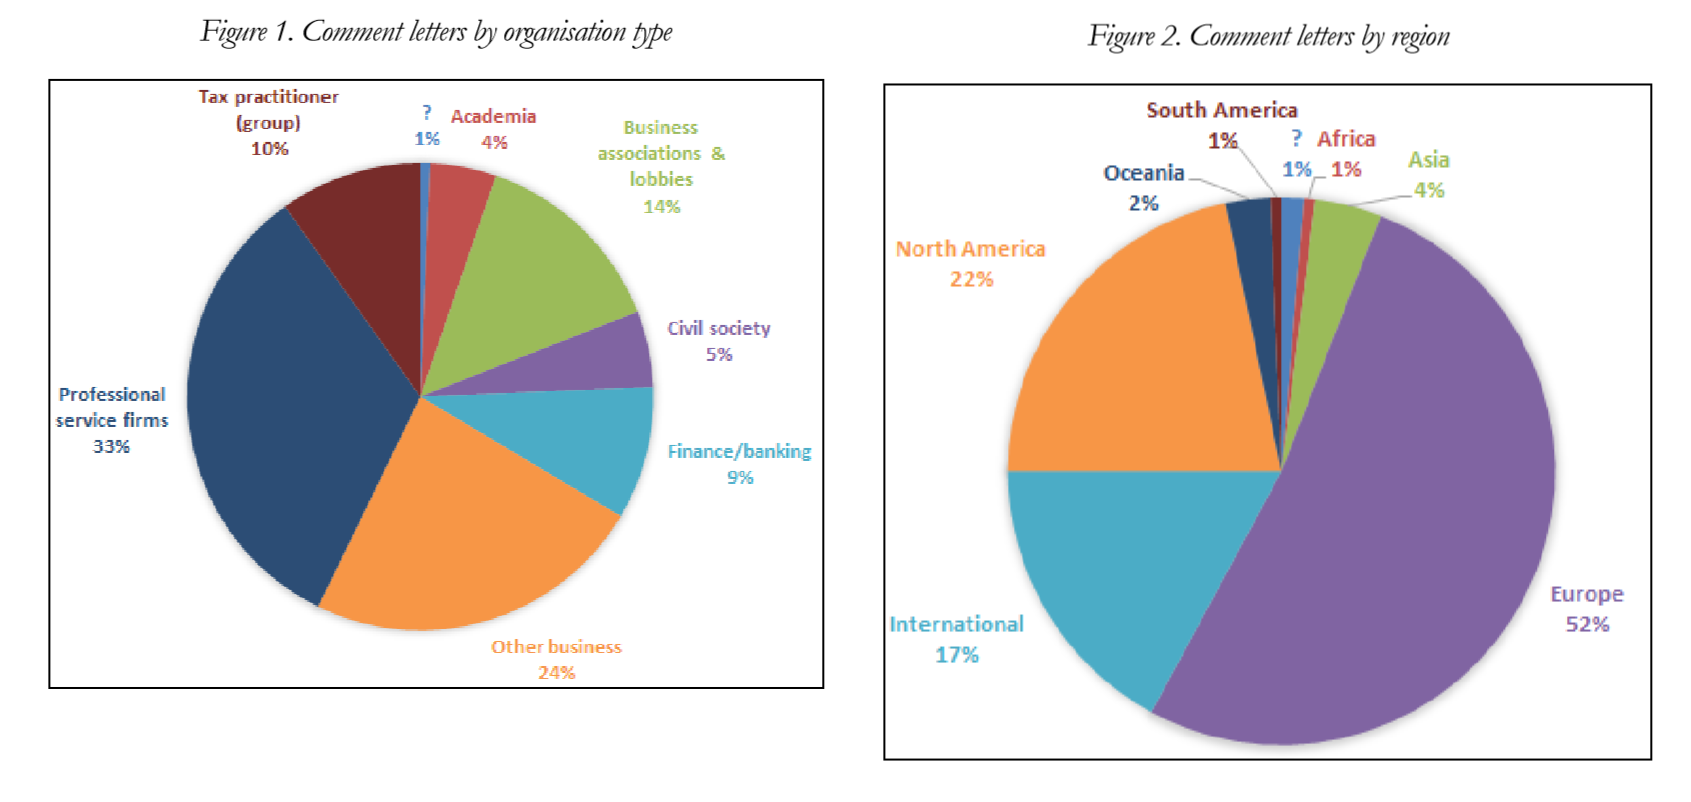 Figures 1 and 2 show the simple range of submissions to BEPS 13, in terms of organisation type and geographical origin. There’s little surprise to find that less than 10% of submissions came from academia and civil society; and even less from South America, Africa and Asia combined.
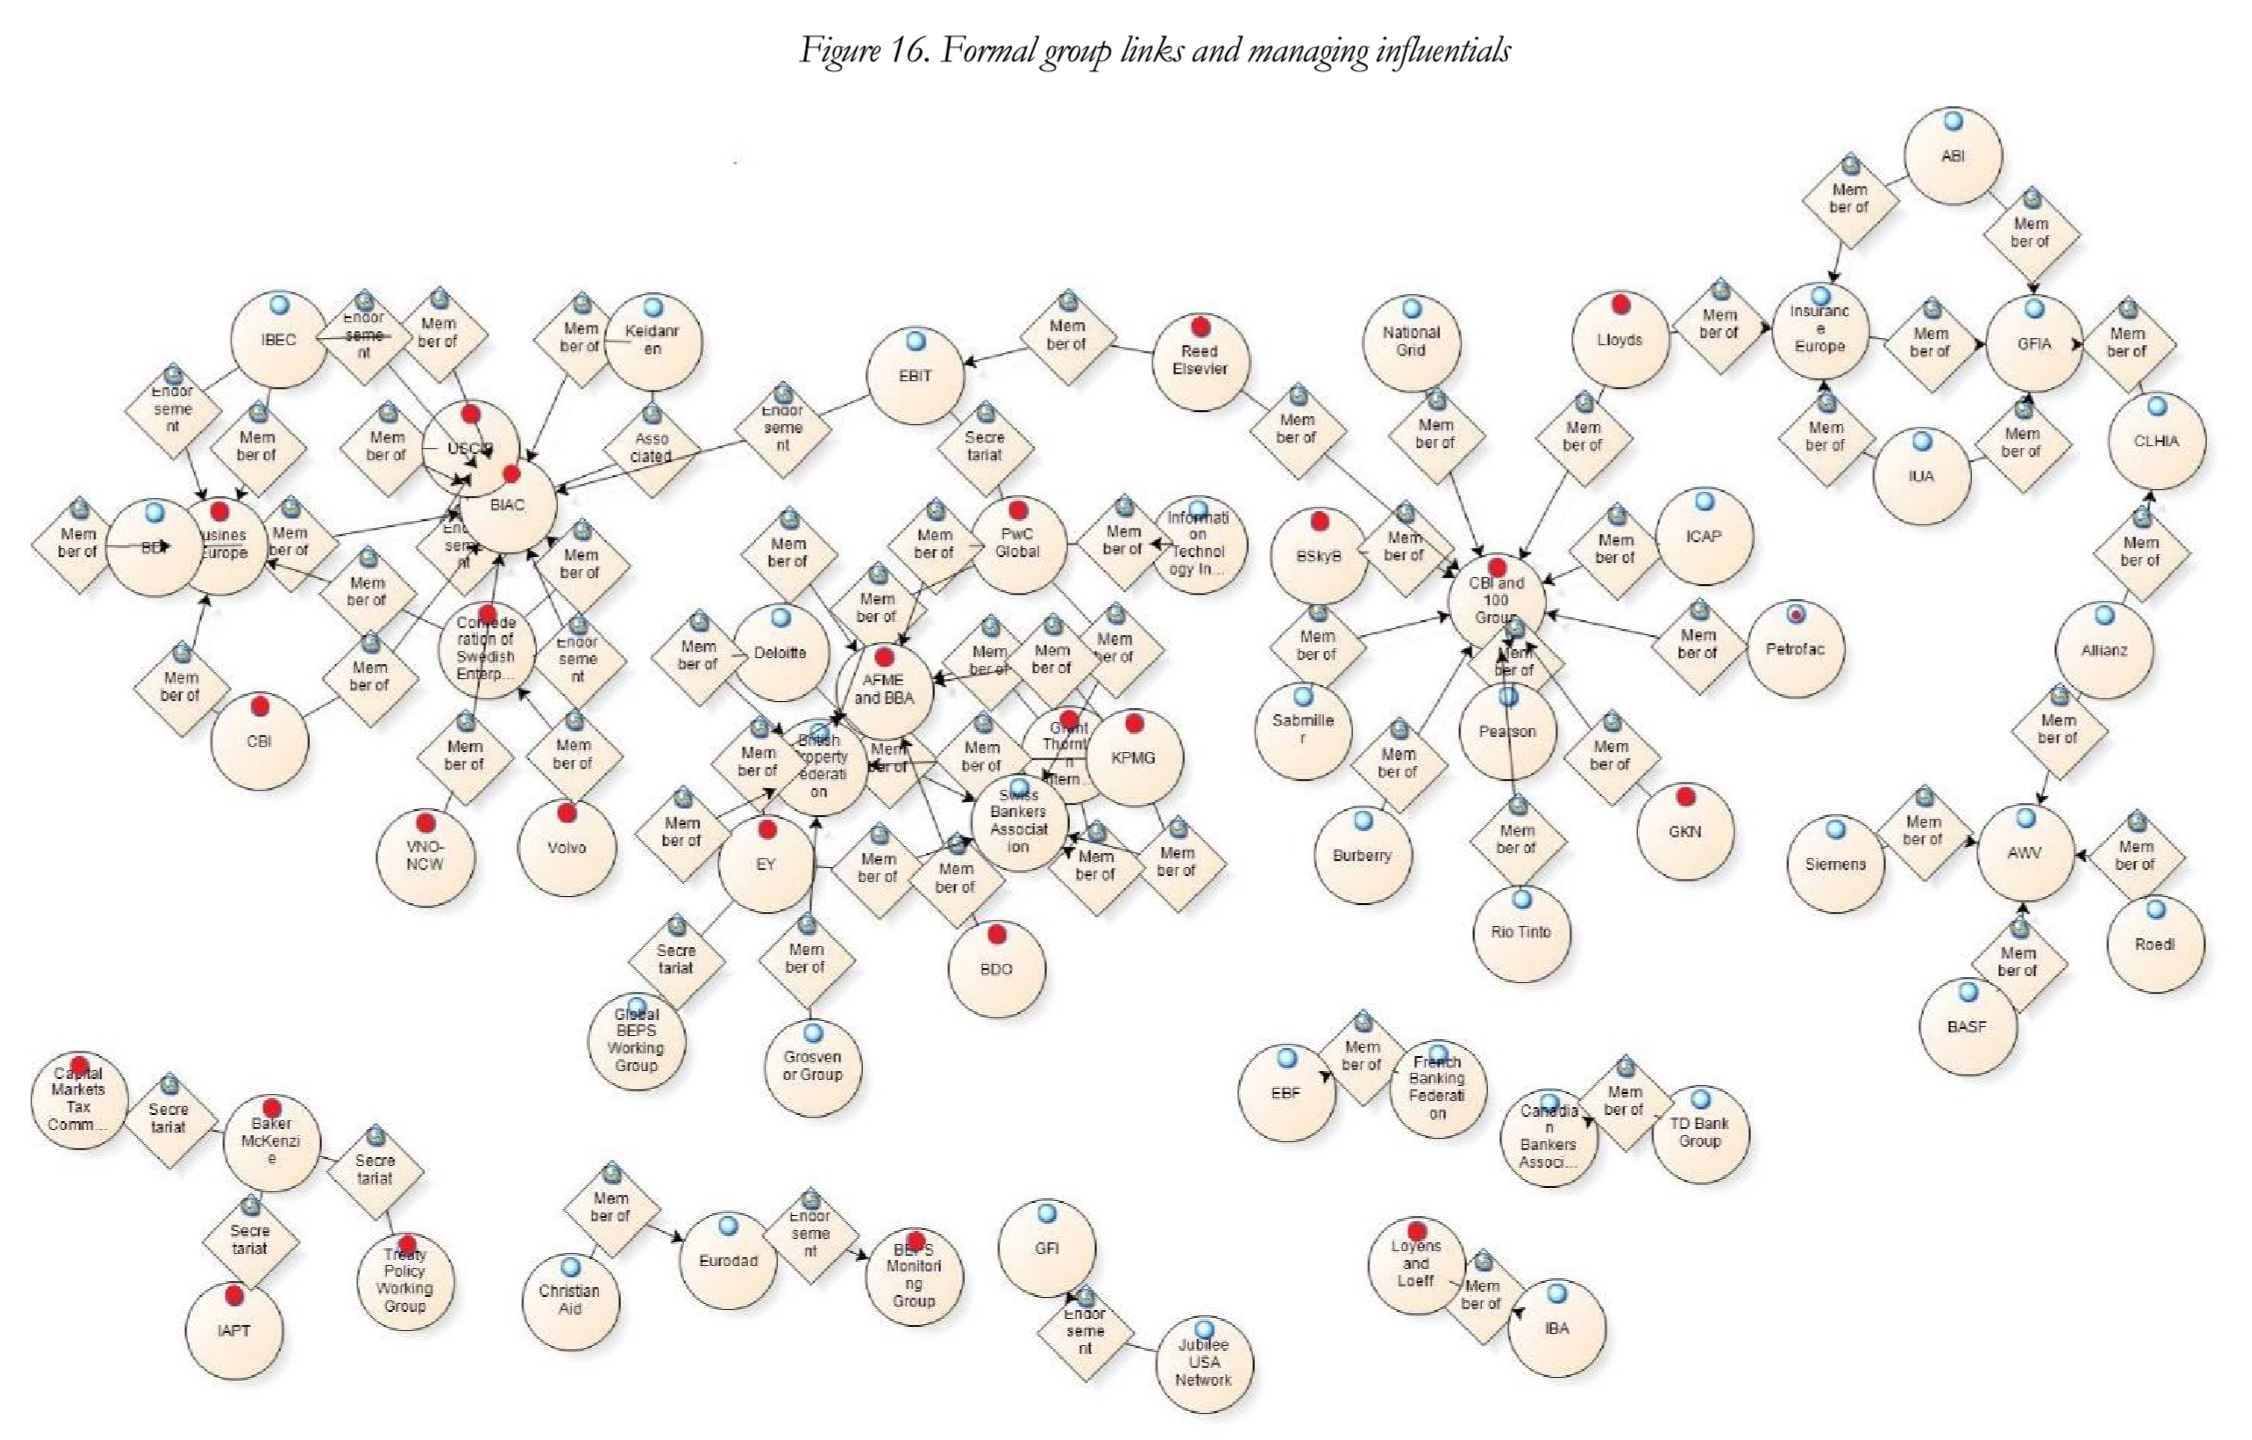
 The analysis goes to a much more detailed level, tracing the paths of leading individuals in the process, identifying ‘professional competition’ as a key factor, where “influence in highly technical policy discussions is contingent upon expertise (being able to speak authoritatively) and networks (being listened to)… I distinguish two types of influential professional: career diverse professionals (“octopuses”) and well-connected specialists (“arrows”). The former are influential because of their varied expertise, the latter because they are respected through key tax/transfer pricing networks.” In figure 16 (click to expand, as ever), the red dots indicate organisations with a ‘managing professional’ who is influential in the process.
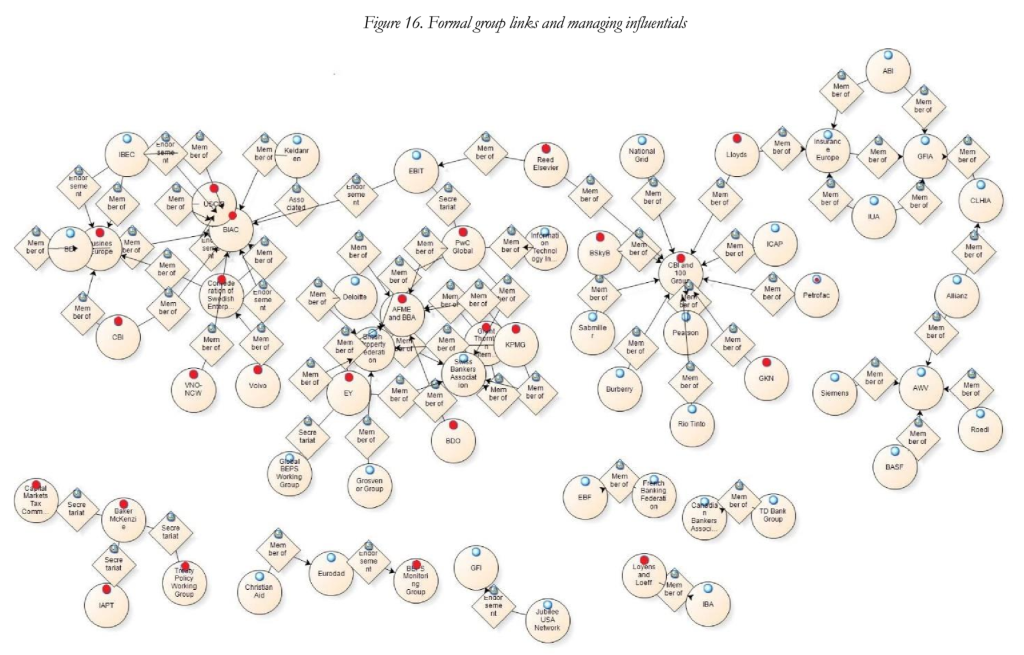 The full thesis contains a great deal more, including on the career paths of influentials. These are just some of the broad conclusions:
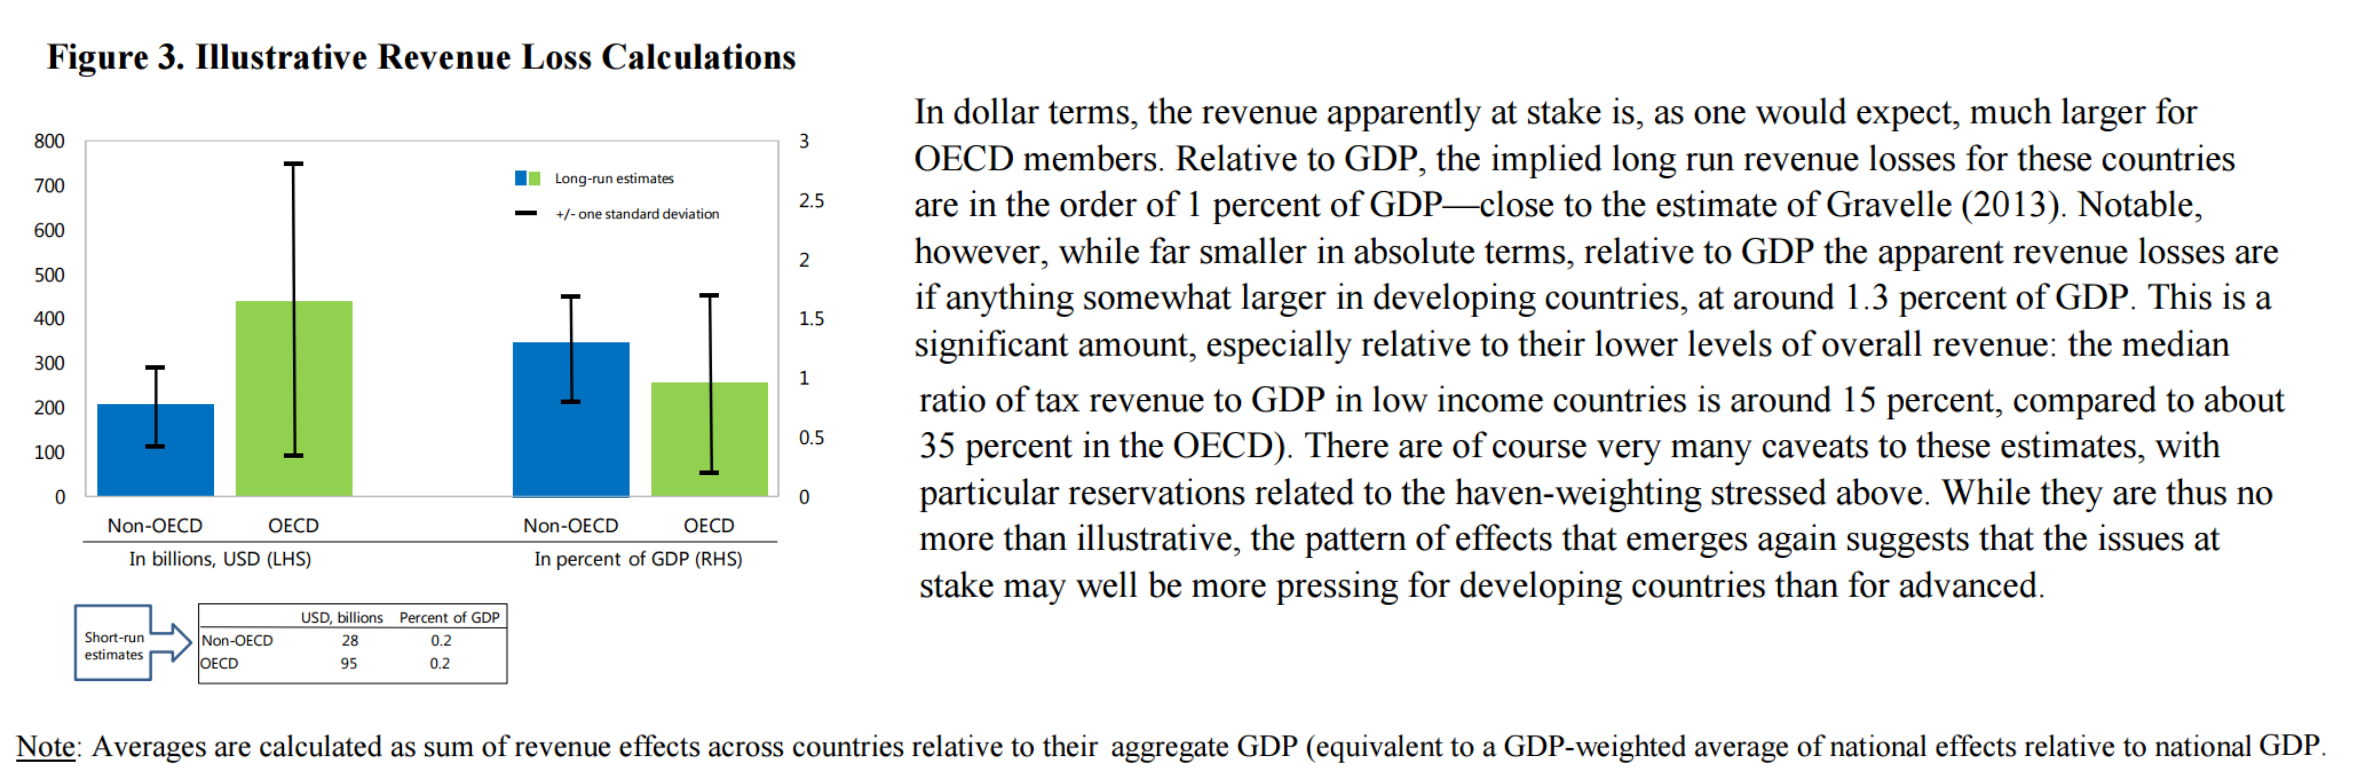
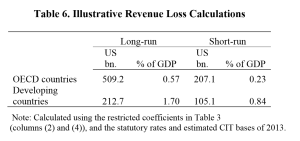 In line, as the authors note, with Gravelle’s (2013) study of US losses, they find a long-run revenue loss for OECD countries of toward 0.6% of GDP (some $500 billion). For developing countries however, the losses are nearly three times as high in GDP terms, exceeding $200 billion. This doesn’t immediately seem inconsistent with the

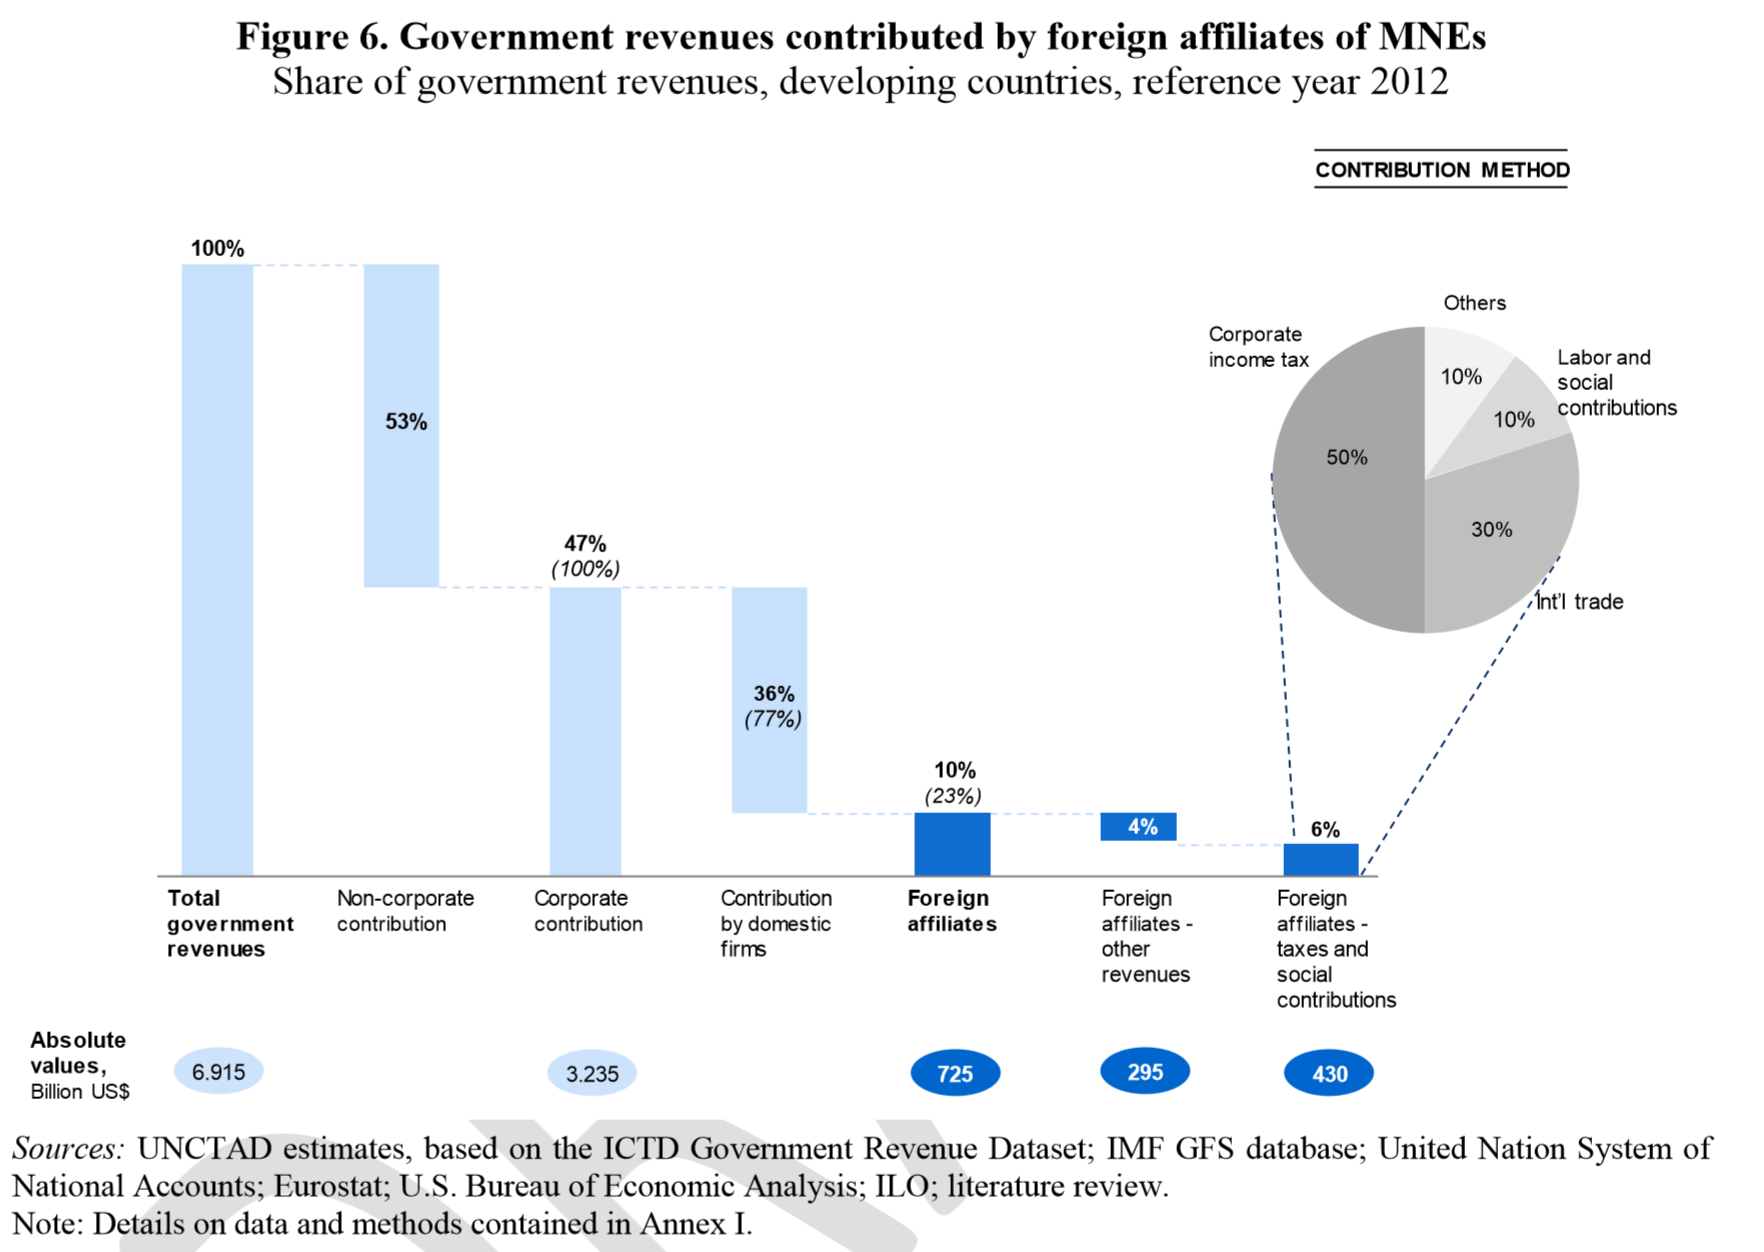
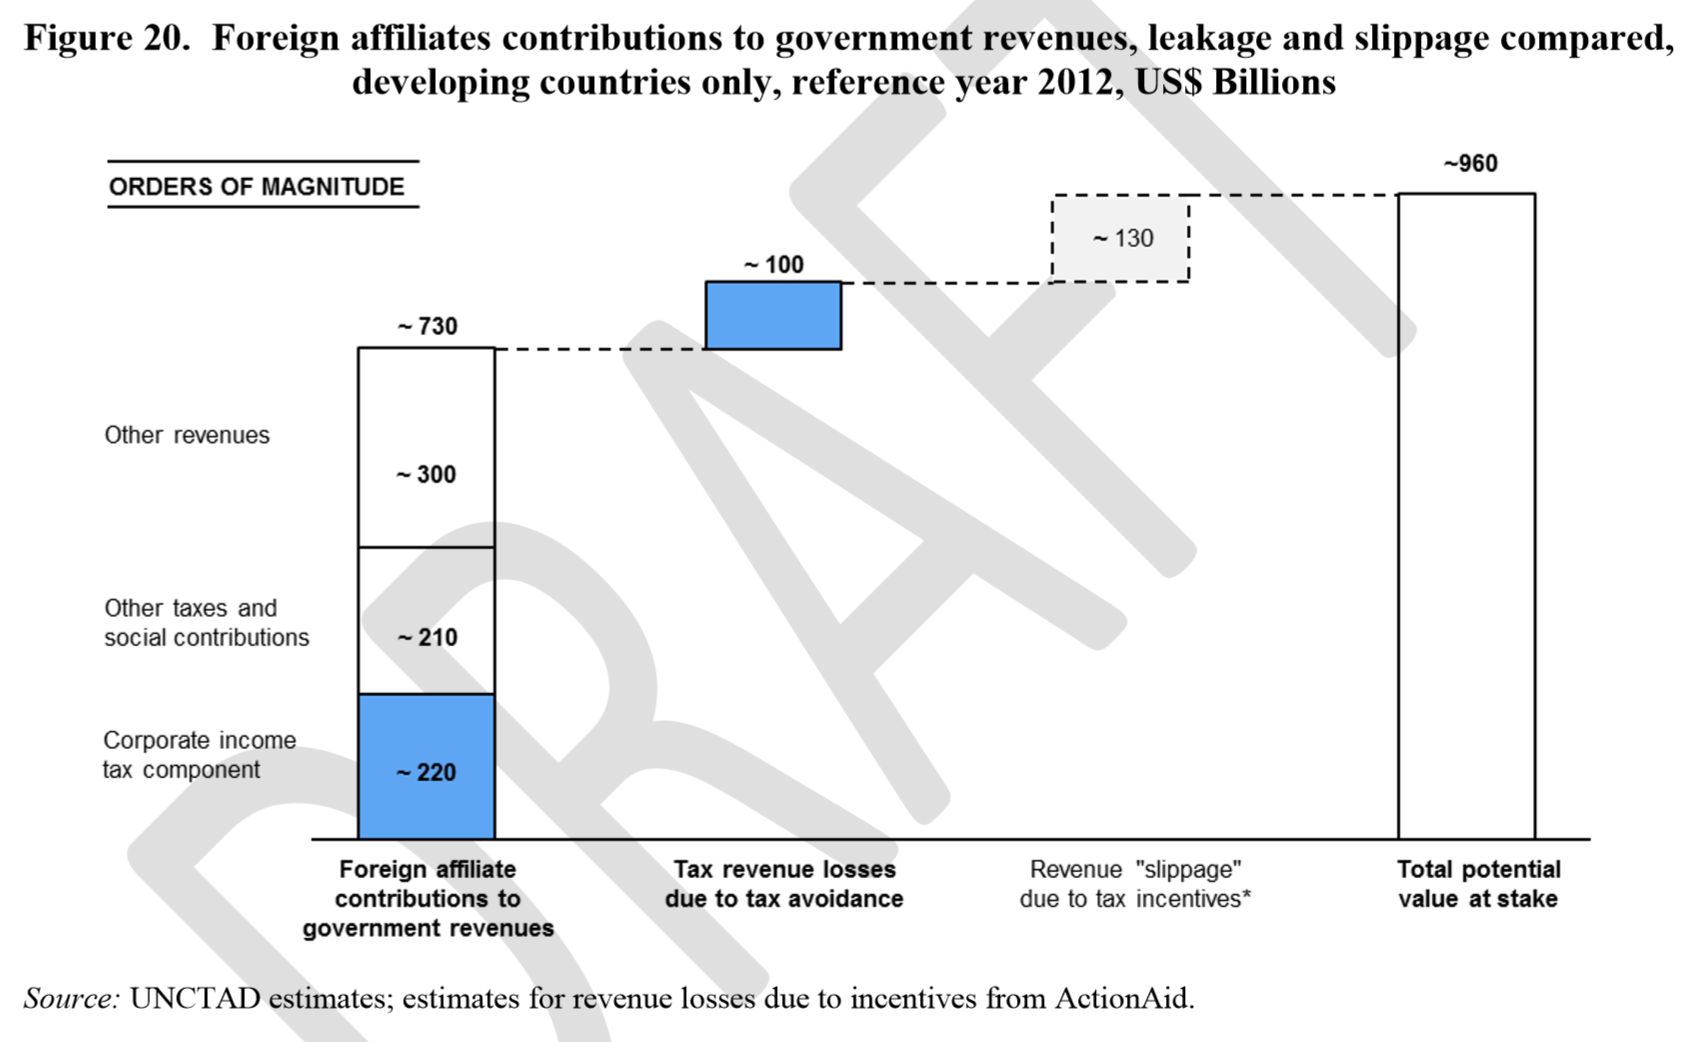
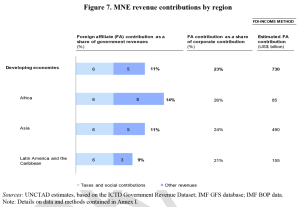 corporate income taxation and non-income items. Per figure 7 (click to enlarge), this yields an overall contribution of $730 billion. There is perhaps more uncertainty in this approach, since it rests on the estimated tax rate and on the extrapolated rate of other (non-income tax) revenue contributions. Nonetheless, the full approach (again detailed in Annex I) is plausible, and the cross-check on the contribution approach is valuable.