#Budget2015 UK corporate tax cuts: No benefits expected?

Documents published with the UK’s budget today suggest that the proposed corporate tax cuts are not expected to produce any increase in (taxable) activity – so represent a significant revenue loss with no apparent compensatory benefits.

1. The rationale for corporate tax cuts

The first document to note is that of HM Revenue and Customs, summarising the revenue effect and intended impacts of the proposed further reduction in the headline rate, to 18% by the 2020.

UK corp tax cut Jul15 summary of impact

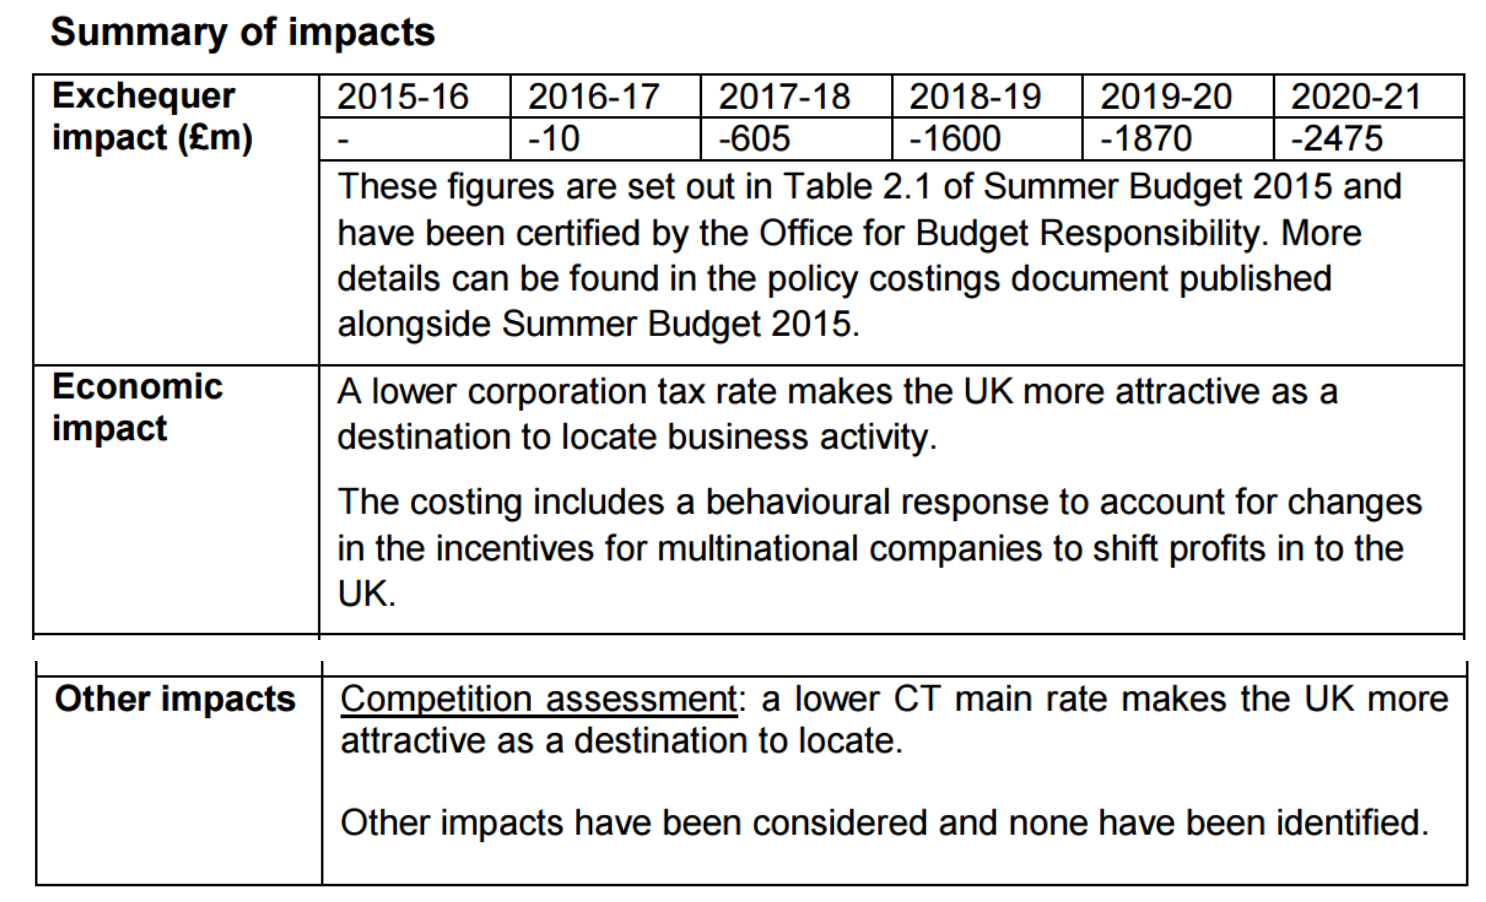
The rationale is clear: the aim of the cuts is to attract businesses to locate activity.

Additionally, it is recognised that the measure will also increase the incentive for multinationals to shift profits generated from activity located elsewhere into the UK – a phenomenon the UK had committed to fight, in the OECD Base Erosion and Profit Shifting process (albeit there has recently been open criticism from the US Treasury of the UK’s obstructiveness).

2. The projected impact

So the central aim is the attraction of new activity. Success in either this aspect, or the attraction of profits from activity located elsewhere, will increase the base. A sufficient increase in the base size will trigger those semi-mythical Laffer-type effects, with a rate cut leading to a revenue increase.

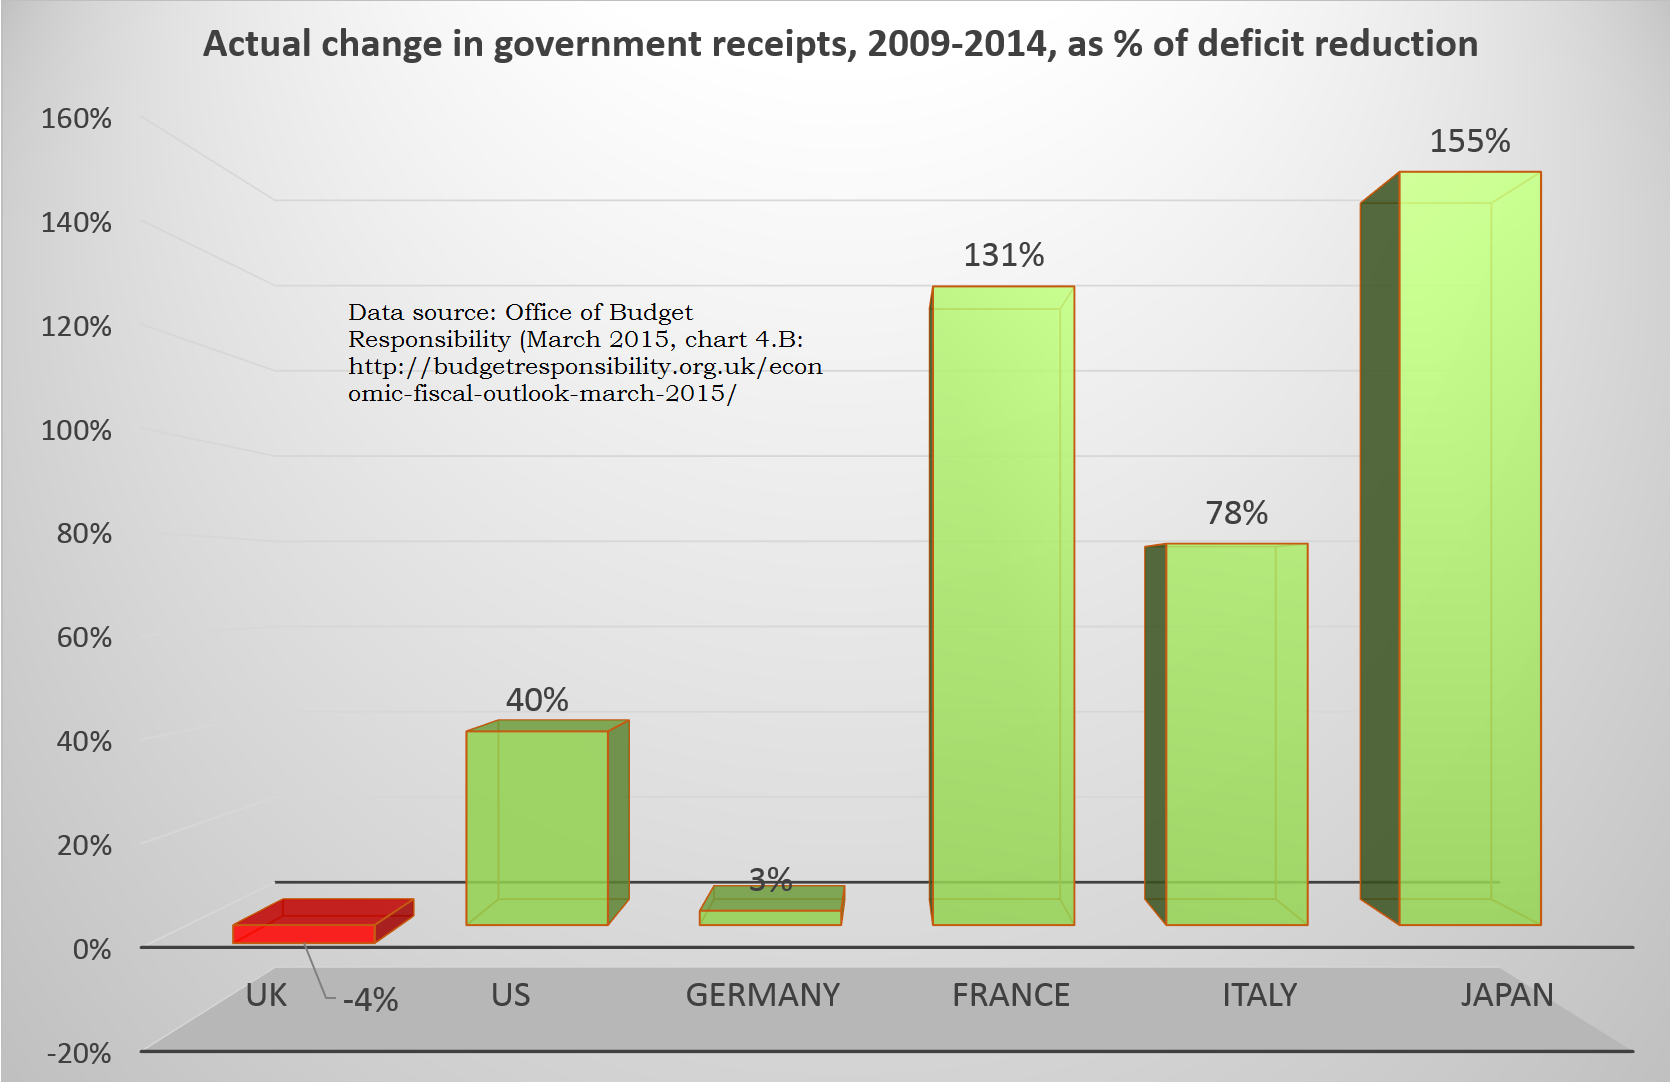
The second document, from the authoritative Office for Budget Responsibility, addresses just this point. The figure below, a reworking of the OBR’s figure C4.3, distinguishes between the rate effects and base effects of the various tax changes in the budget. (An aside: while the UK in the previous parliament was the only leading economy not to raise taxes as part of its austerity measures – in fact, the reverse, so that spending cuts exceeded progress in deficit reduction – the plan for this parliament sees a tax increase overall of 0.9% of GDP.)

UK budget Jul15 OBR changes to tax-GDP

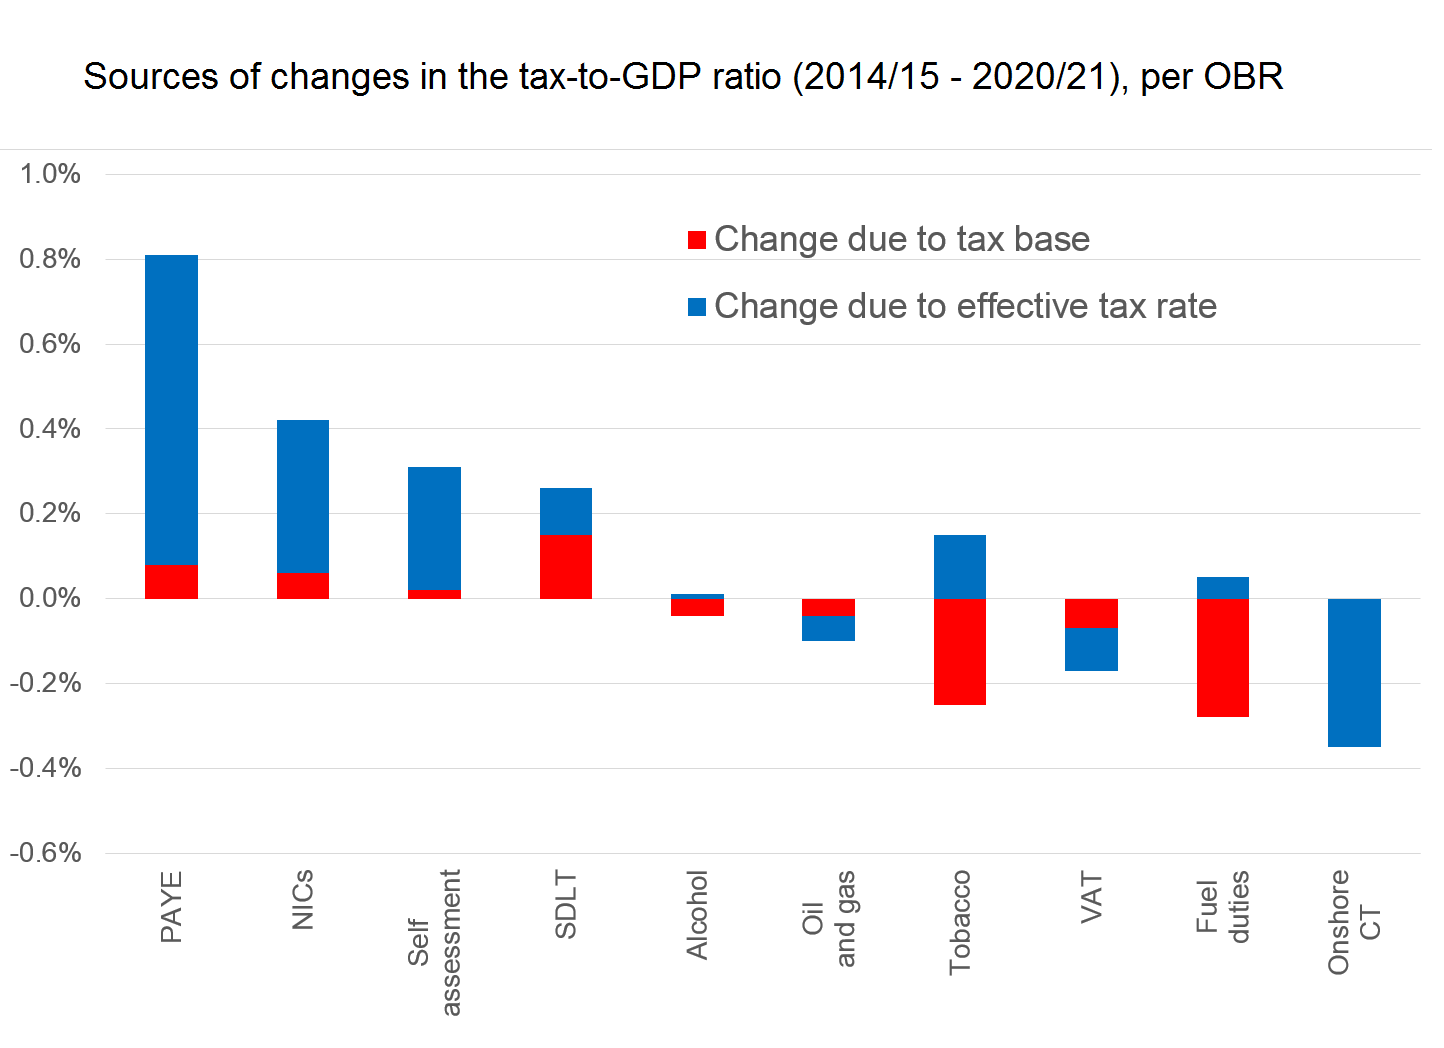
The figure shows that the planned corporate tax (‘Onshore CT’) rate cuts produce the largest revenue loss of any measure.

More surprisingly, perhaps, the OBR also project a 0% change in the tax base: that is, a best guess of zero behavioural change (increases in either UK location of business activity, or profit-shifting into the UK). Still, many companies are already considering hiring firms like GeekBooks to ensure that they are handling their tax situation correctly in these circumstances in order to prevent mistakes.

Overall, this means the budget is projected to raise individual income tax (yes, including NICs) substantially, while reducing the contribution of corporate income tax to no apparent benefit. When a business runs the payroll for its employees, often, they will deduct income tax which can be a time-consuming process – choosing the best payroll company with effective software to make use of can streamline this process and take a load off those in charge of HR.

The previous parliament had already cut corporate tax revenues by around 20%, or around £7.5 billion a year by 2015/16, with unclear benefits. The cuts announced today will cost a further £2.5 billion a year by 2020/21, so it will be disappointing if there is not at least some further scrutiny of this policy choice.

Postscript: tangentially related good news is that the European Parliament has voted in support of serious, public country-by-country reporting. Bring it on.

Empty-chairing people with disabilities

People living with disabilities in the UK have suffered an excessive burden from the spending cuts; have been further excluded by the decision not to compile statistics on the impact of those cuts; and now, as the election looms, find a refusal to recognise them politically.

[For what it’s worth: these are problems that cut across all political parties, and I’d much rather not be writing this about any in particular; but the behaviour of the coalition government has been extreme.]

CWR disabled cuts
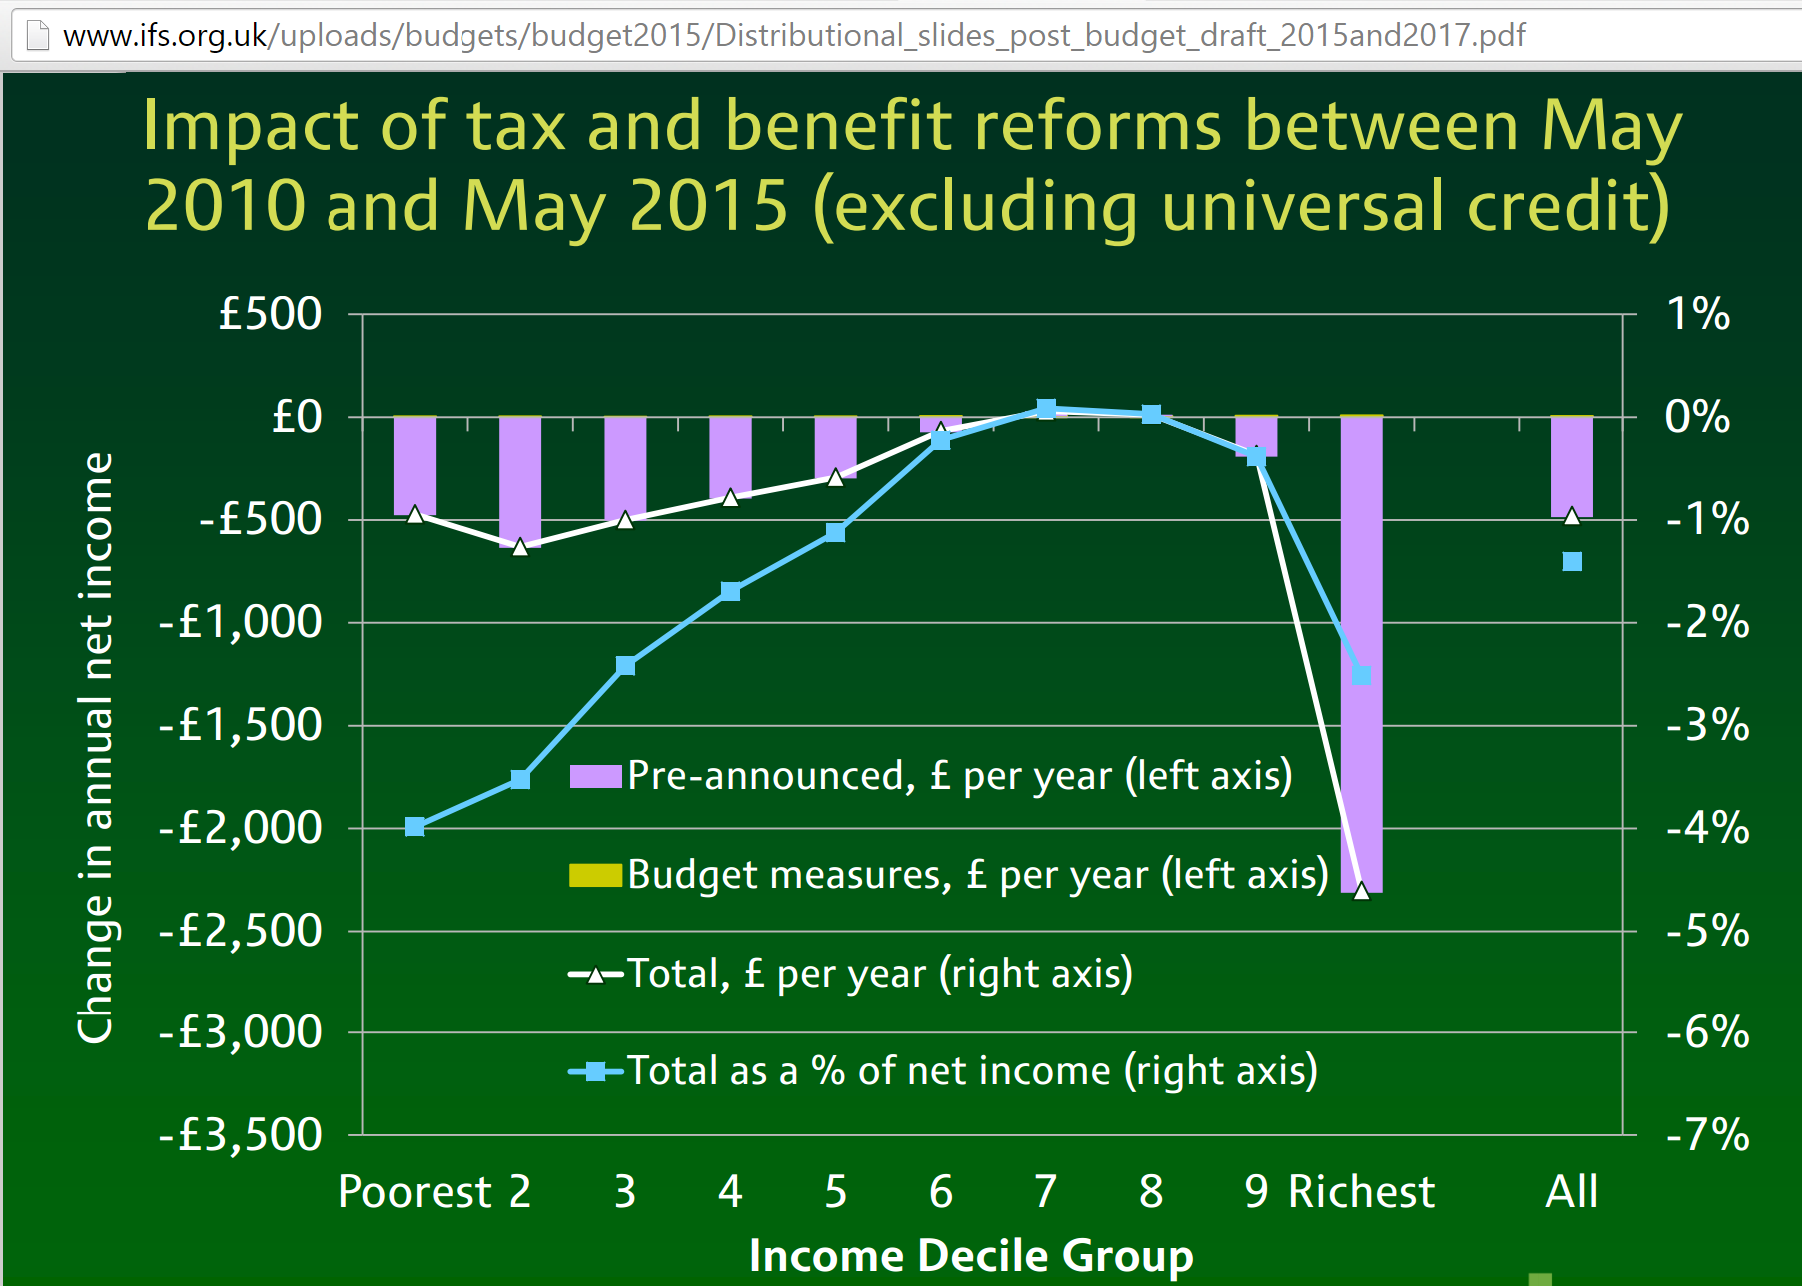
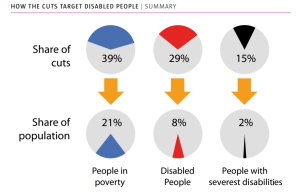
The data we have show a very considerable excess burden of cuts on people living with disability – the Centre for Welfare Reform, for example, find that people with disabilities lose an average of £4,410, or nine times the burden on most citizens; while people with severe disabilities lose £8,832, 19 times the burden of others.

That these statistics are generated by an independent organisation tells its own story. The WOW Petition managed to achieve the necessary 100,000 signatures to be granted a parliamentary debate on the need for a ‘cumulative impact assessment’ (CIA) of the cuts to support for people with disabilities and carers.

They even won. But no assessment has been forthcoming, due to the government’s claim – apparently erroneous, it transpires – that the independent Institute for Fiscal Studies had said a CIA would be too difficult.

With the general election looming, the Learning Disability Alliance (England) set up a citizens’ jury to assess the related policies of each major political party. The results are what they are – but the striking feature of the jury was that the main party of government refused to take part, despite repeated personal invitations.

LDA party rankOne last piece of information on what looks very much like the deliberate uncounting of people living with disabilities in the UK: this threat from the main department responsible for benefits, the DWP, to withdraw cooperation from one of the main disability-focused news services.

Simon Duffy writes that the community of people with learning disabilities, their families, friends and carers may number as many as 5 million – more than enough to swing multiple seats. The evidence on cuts suggests a political calculation that this won’t happen.


The UK’s tax-averse austerity

The UK is the only leading economy which didn’t split its deficit reduction between spending cuts and tax rises. To put that another way, the UK is alone in having imposed spending cuts larger than the deficit reduction it achieved, because receipts actually fell.

OBR 2015 chart 4B receipts in deficit reduction

This curious point was noted by the Office of Budget Responsibility (see chart 4.B and discussion) in its analysis of the last budget of the current UK parliament, though not widely picked up.  Big hat-tip to James Plunkett for flagging it:

So the UK’s austerity has been particularly tax-averse. Does it matter?

Inequality impact

There’s a lot of detail hidden under this headline number, including the broad shift away from direct taxation. Corporate tax cuts, in particular, have reduced those revenues by more than 20%.

While spending cuts and tax rises can both be regressive, you expect in general that spending cuts affect lower-income households more; while tax rises would affect higher-income households more.

All else being equal, you’d expect a relatively extreme tax-averse austerity to have a regressive impact. And, by and large, this is what the data show. The Institute for Fiscal Studies find that the ‘biggest losers’ are the bottom half of the distribution, due to cuts in social security for those of working age, and the top decile (due to tax rises – a finding that is much stronger when the tax rises of the previous Labour government are included in the analysis).

The blue line in the IFS figure (using the right-hand axis) shows the rather greater relative losses of the bottom 40% compared to the top 10%. [Consider the Palma ratio of inequality to see why these groups are especially significant.] The bottom quintile in particular is hardest hit – and inevitably much less able to assimilate a few percent loss than would be the top decile.

IFS Mar2015 budget decile chart

It’s not clear whether policymakers or opposition parties are aware of, never mind engaged with, the relatively extreme tax-averse nature of UK austerity.

This is probably in part because the sharp inequality fall from 2008-2011 due to the crisis, rather than (changes in) policy, has allowed the current government to pursue a relatively regressive approach while still claiming progressive impact.

It’s disappointing though to see the lack of scrutiny of, or public justification for, such an approach.