Breaking the vicious circles of illicit financial flows, conflict and insecurity

Cobham, A. 2016. Breaking the vicious circles of illicit financial flows, conflict and insecurity. GREAT Insights Magazine, Volume 5, Issue 1. February 2016. Republished with permission of the European Centre for Development Policy Management (ECDPM). 

Illicit financial flows (IFF) not only thrive on conflict and insecurity but exacerbate both, by undermining the financial and political prospects for effective states to deliver and support development progress. Policies to meet the Sustainable Development Goals’ target of curtailing IFF will also promote peace and security. 


In 2014, the Tana High-Level Forum on Security in Africa took as its theme the impact on peace and security of illicit financial flows (IFF). Leading figures from across the region, including a range of current and former heads of state, discussed the nature and scale of illicit flows and the policy options available.

The subsequent report of the High Level Panel on Illicit Financial Flows out of Africa, chaired by Thabo Mbeki, cited the Tana Forum background study (Cobham, 2014) and reiterated its analysis of the linkages with security; and so it was no surprise that the IFF target in the Sustainable Development Goals (SDGs) appeared under Goal 16: ‘Promote peaceful and inclusive societies for sustainable development, provide access to justice for all and build effective, accountable and inclusive institutions at all levels’:

16.4 By 2030, significantly reduce illicit financial and arms flows, strengthen the recovery and return of stolen assets and combat all forms of organized crime…

The linkages between IFF and insecurity are not necessarily well understood, however. Assessing how the two issues interact can help to identify the range of policy responses that will support powerful progress.


Illicit financial flows


There is no single, agreed definition of IFF. The Oxford dictionary definition of ‘illicit’ is: “forbidden by law, rules or custom.” The first three words alone would define ‘illegal’, and this highlights an important feature of any definition: illicit financial flows are not necessarily illegal. Flows forbidden by “rules or custom” may encompass those which are socially and/or morally unacceptable, and not necessarily legally so. Multinational tax avoidance (as opposed to illegal tax evasion) might come under this category.

This particular example also shows why a legalistic approach may introduce an unhelpful bias. Commercial tax evasion affecting a low-income country where the tax and authorities have limited administrative capacity is much less likely either to be uncovered or successfully challenged in a court of law, than would be the same exact behaviour in a high-income country with the same laws but with relatively empowered authorities. A strictly legal definition of IFF is therefore likely to result in systematically – and wrongly – understating the scale of the problem in lower-income, lower-capacity states. For this reason above all, a narrow, legalistic definition of IFF should be rejected.

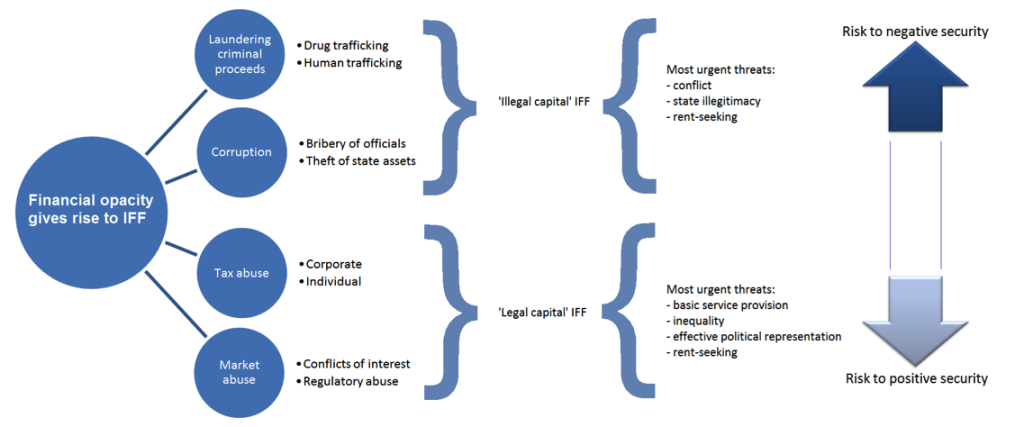
Figure 1: Main IFF types by nature of capital and transaction

GREAT_Insights_Vol5_iss1_Cobham_Fig1

The central feature of IFF – and incidentally a major reason their measurement is so difficult – is that they are deliberately hidden: financial secrecy is key, in order to obscure either the illicit origin of capital or the illicit nature of transactions undertaken (or both). As illustrated in Figure 1, four main types of behaviour are captured: 1) market/regulatory abuse (e.g. using anonymous companies to conceal political conflicts of interest, or breaches of antitrust law); 2) tax abuse; 3) abuse of power, including the theft of state funds and assets; and 4) laundering of the proceeds of crime. Figure 1 also highlights that there is a broader distinction between ‘legal capital IFF’ (tax abuse and market abuse, types 1 and 2) and ‘illegal capital IFF’ (the abuse of power and laundering of criminal proceeds, types 3 and 4).


Security and state ‘fragility’


There is growing agreement that the concept of fragile states – as a binary division against all other, ‘non-fragile’ states – is an unhelpful one for analysis. Instead, it is more useful to think of all states as occupying some position on a spectrum of (risk of) fragility. As the High Level Panel on Fragile States (2014) put it:

Fragility comes about where [pressures such as those stemming from inequality and social exclusion, or from new resource rents and resource scarcity] become too great for countries to manage within the political and institutional process, creating a risk that conflict spills over into violence – whether interstate or civil war, ethnic or tribal conflict, widespread criminality or violence within the family. Countries that lack robust institutions, diversified economies and inclusive political systems are the most vulnerable. In the most acute cases, violence has the effect both of magnifying the underlying pressures and eroding the institutions needed to manage them, creating a fragility trap from which it is very difficult to escape.

The risk of fragility is then closely related to a state’s ability to provide citizens with ‘negative’ security (to prevent personal, community, political and environmental insecurity) and with ‘positive’ security (to provide the conditions for economic, food and health security and progress). These two forms of security exhibit potentially mutually reinforcing relationships with particular types of IFF.


Two vicious circles


Figure 2 shows a vicious circle linking illegal capital IFF and problems of negative security. Where IFF derive from abuse of power – say, for example, the extreme behaviour of a kleptocratic leader – the cycle follows almost tautologically. The nature of the IFF itself undermines state legitimacy and both the capacity and interest to provide security, or indeed to act to curtail IFF.

When the rise in IFF reflects laundering of the proceeds of crime, it is the underlying crimes where the linkages are likely to emerge. Most dramatically, Cockayne (2011) finds that drug and human trafficking has led to little less than the criminalisation of governance itself in West Africa and the Sahel. He identifies two hubs that grew strongly after Caribbean counter-narcotics efforts in the 1990s pushed the trade elsewhere: one around Gambia, Guinea and Guinea-Bissau, and the other around Benin, Ghana and Togo. In addition, Cockayne highlights important services provided in other states – namely money laundering in Senegal, and transit in Mali, Mauritania and Niger. The growing involvement of the state in criminal activity (including IFF), and the growing power of criminality over the state, make the vicious circle somewhat inevitable again.

Figure 2: The vicious cycle of negative security and illegal capital IFF

GREAT_Insights_Vol5_iss1_Cobham_Fig2

Much of the problems of conflict and negative security arise in countries characterised by low levels of institutionalisation of authority, a heavy reliance on patronage politics and an accordingly high level of allocation of state rents to unproductive activities (patronage, to maintain the political machine). For a rent-seeking patronage order to function, it must resist or evade the pressures to institutionalise state finance – through, for example, an incentive structure in which senior officials have a personal interest in financial opacity and the misuse of public funds, and fiscal policy is subordinated to the ‘political budget’ (the state allocation for patronage purposes). Major sources of funds such as natural resource companies may be rewarded through the opportunities to evade tax with impunity, and may maximise net profits through bribery.

In turn this kind of state structure creates structural incentives for violence. Kleptocracy will tend to require violence to protect the position of privilege; those outside may resort to force to extort rents from those in power, or to challenge for the prize of (illegitimate) power itself.

All four IFF types shown in Figure 1 are likely to result in reductions in both state funds and institutional strength – that is, they undermine governance as well as domestic resource mobilisation. While little research has sought to quantify the governance impact, and some attention has been given to the theft of state assets, a growing body of literature seeks to assess the financial scale of flows and the revenue losses associated with particular elements. Consistently, the scale of IFF and of revenue losses from corporate profit-shifting and from individual evasion through undeclared offshore assets is greater in lower-income countries; and often material in respect of countries’ GDP. Indicative estimates of the resulting impacts on basic human development outcomes such as child mortality suggest these too are powerful indeed – potentially bringing African achievement of the Millennium Development Goal target forward from an estimated 2029 to 2016, for example (O’Hare et al., 2014).

Figure 3: The vicious cycle of positive security and legal capital IFF

GREAT_Insights_Vol5_iss1_Cobham_Fig3

Figure 3 illustrates the vicious circle that can arise between these largely legal capital IFF, and problems of positive security. Bluntly, revenues are undermined where they are most needed; and further institutional damage follows from the weakening of the state-citizen relationship that is built on effective taxation.


IFF and security: Policy implications


At the Tana Forum in 2014, President Salva Kiir of South Sudan told how the ‘vultures’ had circled the new state even before it came into existence, building relationships with soldiers and others, so that when the moment came they were poised to create a web of contracts that channelled away oil revenues into anonymity – without delivering on the contracts:

When peace was signed, the vultures that were hovering over Sudan landed. We have learned in our cultures that when you see vultures hovering around, there must be a dead animal – or something is going to die… They knew there would be a vacuum of administration there… That [oil] money was disappearing day by day to where you cannot trace it.

The central feature of IFF is that they are hidden, typically by the financial secrecy provided by other jurisdictions. The secrecy in question relates primarily to the provision of vehicles for anonymous ownership such as shell companies; to the refusal to provide information on foreigners’ assets and income streams to their countries of tax residence; and to the type of corporate opacity that obscures the worst excesses of multinationals’ profit-shifting. As shown by the Tax Justice Network ranking of tax havens, the Financial Secrecy Index, this includes many of the leading economies – not least the USA, ranked third.

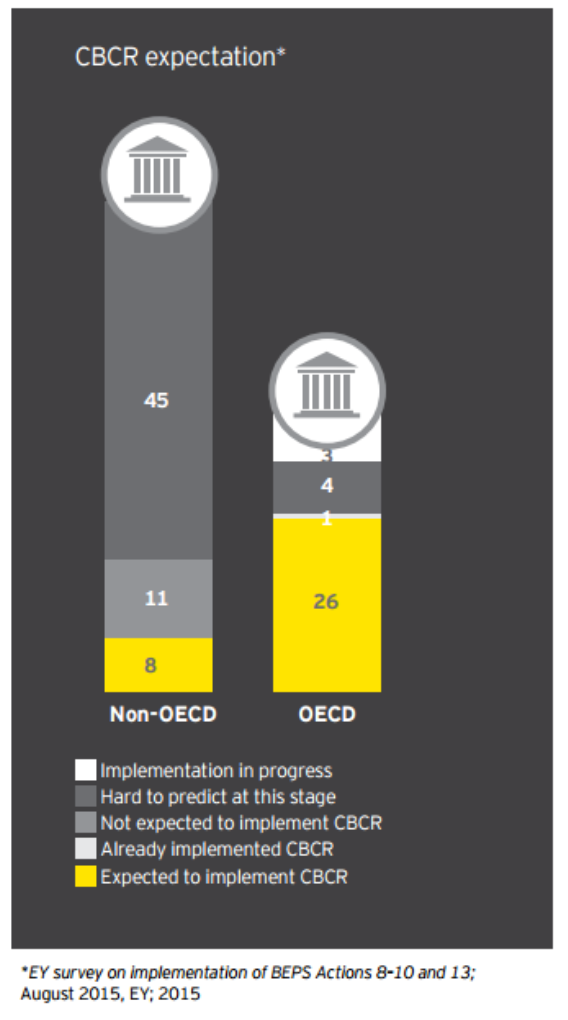
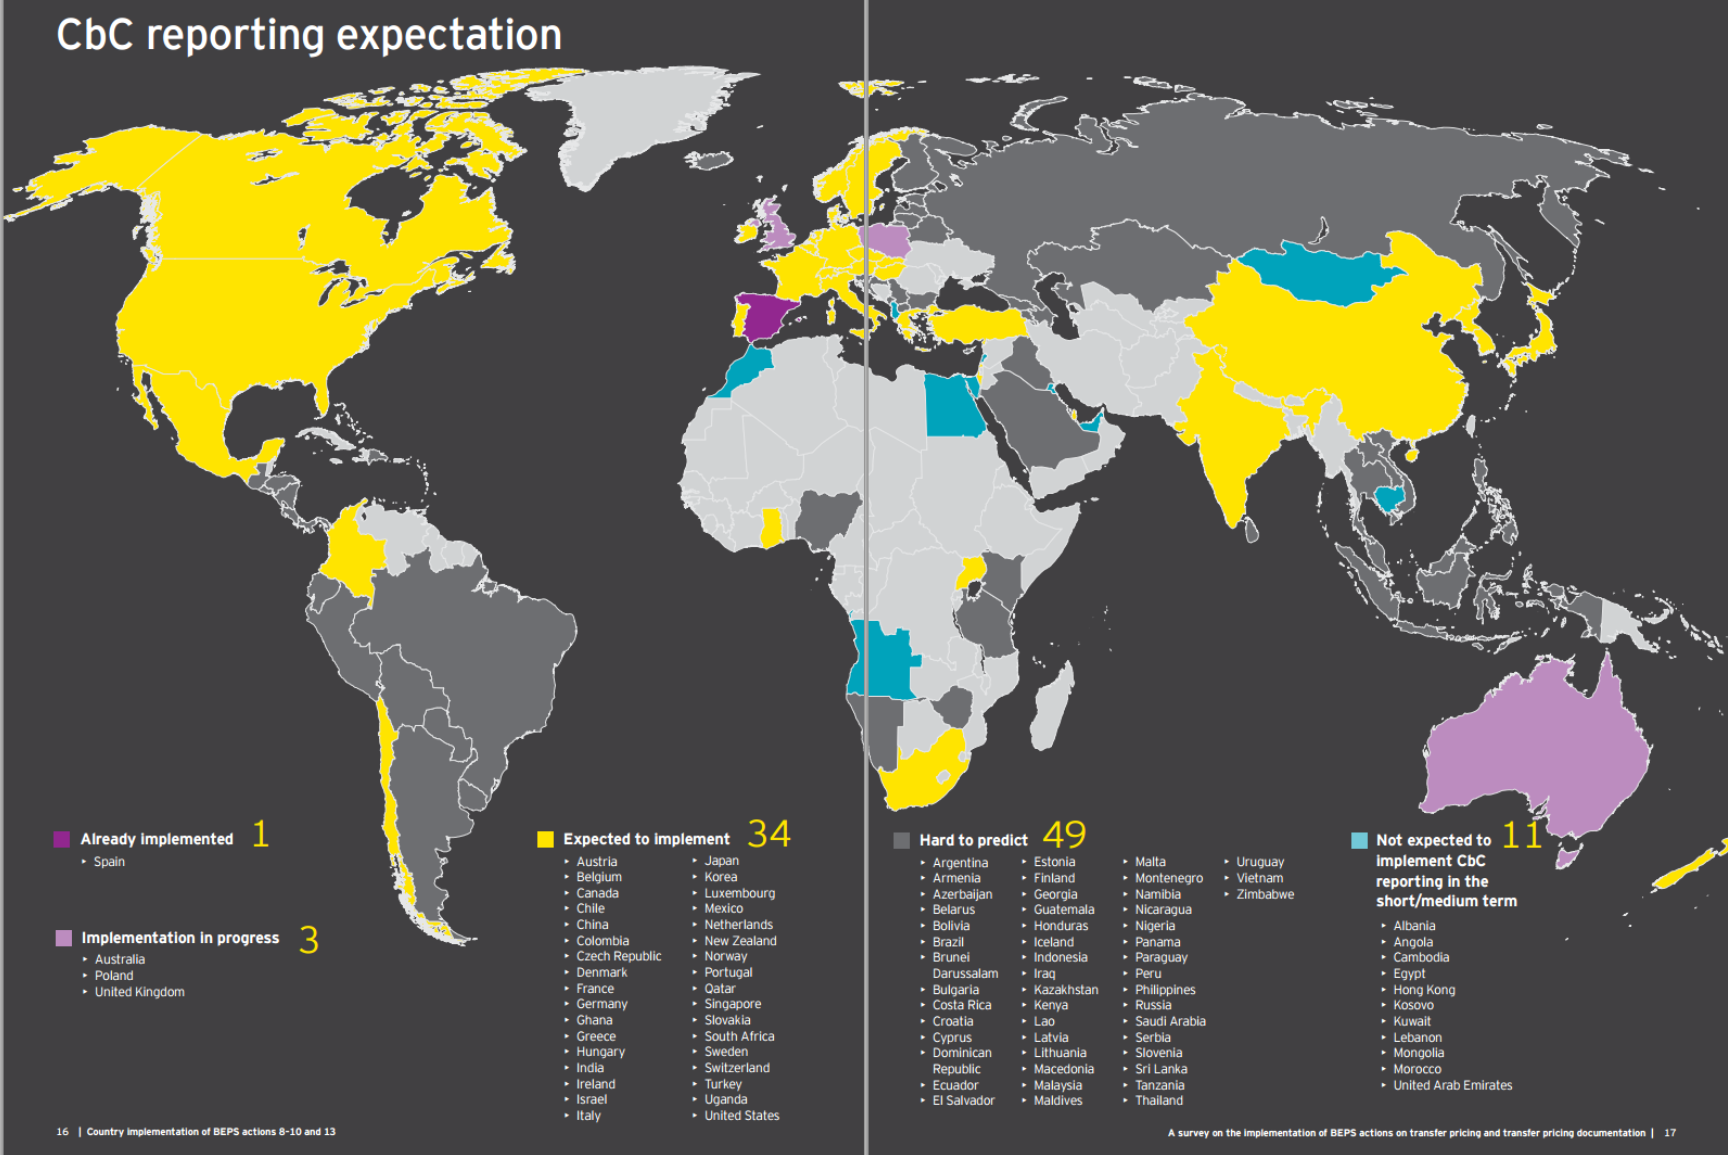
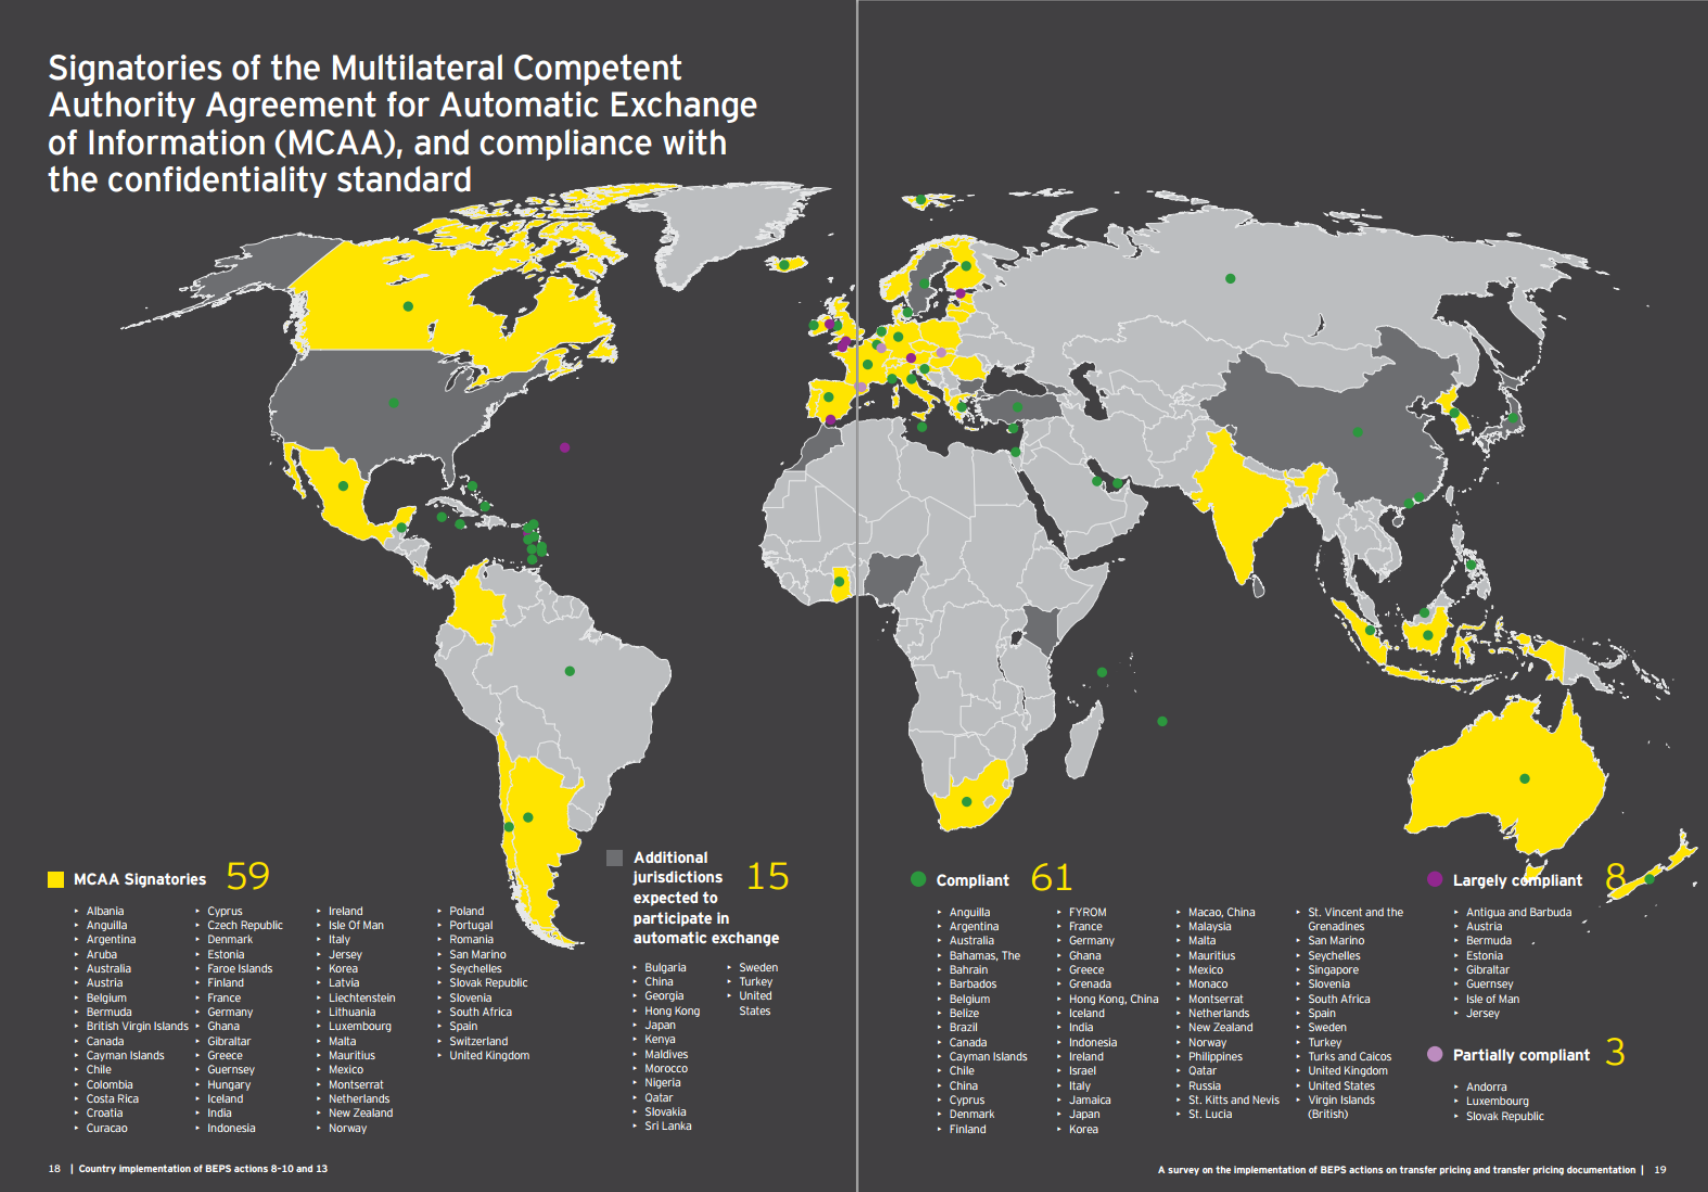
States can protect themselves to a degree, by ensuring greater transparency of public contracts for example, and public country-by-country reporting by multinationals; and by engaging fully in the multilateral process for automatic exchange of tax information. But while other states insist on selling secrecy, major obstacles will remain.

Success in the Sustainable Development Goals target of curtailing illicit financial flows would contribute to reducing risks of state fragility across the board – and to achieving many human development targets too. But such progress depends on international progress against financial secrecy. A significant step would be the adoption of indicators for target 16.4 that will ensure individual states are held accountable for the secrecy they provide globally – and the IFF they stimulate as a result.

The following indicators (Cobham, 2015) draw from the agreed policy positions in the Sustainable Development Goals and the Financing for Development declaration from Addis, July 2015:

  • For each country and jurisdiction, on what proportion of foreign-owned assets and to the states of what proportion of the world’s population, are they providing tax information bilaterally to others?
  • For each country and jurisdiction, from which countries and jurisdictions are they receiving tax information bilaterally?
  • For each country and jurisdiction receiving information, what proportion and volume of revealed assets were already declared by the taxpayer, and what resolution has reached each year in respect of the remainder?
  • For each country and jurisdiction, for multinationals making up what proportion of the declared multinational tax base is country-by-country reporting publicly available?

The harder it is for vultures to hide, the fewer may be the unnecessary deaths suffered.

Figure 4: Overview of IFF and security linkages

tana overview fig


References


Cobham, A., 2014, ‘The impact of illicit financial flows on peace and security in Africa’, Tana High-Level Forum on Security in Africa Discussion Paper.

Cobham, A., 2015, ‘Uncounted: Power, inequalities and the post-2015 data revolution’, Development 57:3/4, pp.320-337.

Cockayne, J., 2011, ‘Transnational threats: The criminalization of West Africa and the Sahel’, Center on Global Counterterrorism Cooperation Policy Brief (December).

High Level Panel on Fragile States, 2014, Ending Conflict & Building Peace in Africa: A call to action, African Development Bank: Tunis.

High Level Panel on Illicit Financial Flows out of Africa, 2015, final report.

O’Hare, B., I. Makuta, N. Bar-Zeev, L. Chiwaula & A. Cobham, 2014, ‘The effect of illicit financial flows on time to reach the fourth Millennium Development Goal in Sub-Saharan Africa: a quantitative analysis’, Journal of the Royal Society of Medicine 107(4), pp.148-156.


Book launch: Inequality, uncounted

In reckoning the numbers of the people of the Commonwealth, or of a State or other part of the Commonwealth, aboriginal natives shall not be counted.

-Commonwealth of Australia Constitution Act 1900, section 127.

Imagine a world of such structural inequality that even the questions of who and what get counted are decided by power. A world in which the “unpeople” at the bottom go uncounted, as does the hidden “unmoney” of those at the very top. Where the unpeople are denied a political voice and access to public services. And the unmoney escapes taxation, regulation, and criminal investigation, allowing corruption and inequality to flourish out of sight.

This is the world we live in. A world of inequality, uncounted.

We may pride ourselves on being the generation of open data, of big data, of transparency and accountability, but the truth is less palatable. We are the generation of the uncounted—and we barely know it. But things may be changing, albeit slowly.


The Wicked Problems Collaborative has launched its first book, ‘What do we do about inequality?’ . The text above is the introduction to my chapter, ‘Inequality, Uncounted’ – which is a lighter, more direct telling of the argument made in the paper published last month in Development.

The indefatigable Chris Ostereich (@costrike) led the project, and edited the book, bringing together a really impressive group of contributors (and kickstarter funding). Below is the table of contents – and here’s the link to the book (it’s on Kindle so yes, on Amazon. Sorry).

TABLE of CONTENTS

ACKNOWLEDGEMENTS
DEDICATION
OPENING VOLLEYS
CONTENTS
FIGURES
WPC CONTRIBUTORS ON TWITTER
EDITOR’S NOTE
THE BLIND MEN AND THE ELEPHANT
PREFACE
INTRODUCTION
WHAT DO WE DO ABOUT INEQUALITY?
1. TO ADDRESS INEQUALITY, THINK GLOBAL | Dylan Matthews
2. THE IDEOLOGICAL STRAITJACKET | Sean McElwee
3. WHAT DOES EQUIPOTENTIALITY BRING TO THE TABLE IN TERMS OF EQUALITY? | Michel Bauwens
4. INEQUALITY, UNCOUNTED | Alex Cobham
5. THE INEFFICIENCY OF INEQUALITY | Daniel Altman
6. IS CAPITALISM UNFAIR? | Chris MacDonald
7. THE PROBLEM OF INEQUALITY | Kevin Carson
8. TOWARDS RENOUNCING PERSONAL PRIVATIZATION | Nicholas Archer
9. THE INEQUALITY OF WILDNESS AND THE NECESSITY OF WILDNESS FOR EQUALITY | Megan Hollingsworth
10. THE STICKINESS OF INJUSTICE | Jennifer Reft
11. NOBLE FICTIONS AND SACRED TEXTS Paul Fidalgo
12. THE VOICES THAT ARE NOT YOUR OWN: MAINTAINING CHOICE IN THE AGE OF THE ALGORITHM | John C. Havens
13. THE EMPATHY DEFICIT: WHY THE INEQUALITY CRISIS IS ALSO A CRISIS OF EMPATHY | Robin Cangie
14. BILLIONAIRES WITH DRONES: FROM OLIGARCHY TO NEOMEDIEVALISM | Frank A. Pasquale
15. WHAT SHOULD THE WORLD LEARN FROM THE EXPERIENCE OF INEQUALITY IN LATIN AMERICA? | Patrick Iber
16. OCCUPY SANDY AND THE FUTURE OF SOCIALISM | Sam Knight
17. THE “PLACE OF BIRTH” LOTTERY | David Kaib & Chris Oestereich
18. INEQUALITY AND THE BASIC INCOME GUARANTEE | Scott Santens
19. THE AGE OF INEQUALITY: CAUSES, DISCONTENTS, AND A RADICAL WAY FORWARD | Jason Hickel & Alnoor Ladha
20. TWENTIETH CENTURY SOLUTIONS WON’T WORK FOR TWENTY-FIRST CENTURY INEQUALITY | David O. Atkins
21. THE STATE OF AFFAIRS: HEADING FROM BAD TO WORSE | Adnan Al-Daini
22. THE TRAGEDY OF OUR MIDDLE CLASS | Peter Barnes
23. POST-SCARCITY ECONOMICS: WHY ARE SOME PUNDITS AND ECONOMISTS STILL ENAMORED OF AUSTERITY? | Tom Streithorst
24. INCOME INEQUALITY: WHAT’S WRONG WITH IT, AND WHAT’S NOT | F. Spagnoli
25. TURMOIL & TRANSITION | Harold Jarche
26. KNOWLEDGE, POWER, AND A POTENTIAL SHIFT IN SYSTEMIC INEQUALITY | Jon Husband
27. THE QUESTION OF INEQUALITY: A VIEW FROM INDIA | Akhila Vijayaraghavan
28. WHAT YOU KNOW IS BASED ON WHO YOU KNOW | Deborah Mills-Scofield
29. INEQUALITY IS ABOUT THE POOR, NOT ABOUT THE RICH | Miles Kimball
30. TO TACKLE EXTREME POVERTY, WE MUST TAKE ON EXTREME INEQUALITY | Nick Galasso & Gawain Kripke
31. ADDRESSING WEALTH EQUALITY WITH INVESTING SOLUTIONS FROM NATURE, NURTURE, AND SCIENCE | Rosalinda Sanquiche
32. THE LOGIC OF STUPID POOR PEOPLE: STATUS, POVERTY AND GATEKEEPING | Tressie McMillan Cottom
33. POOR CHOICES | Melonie Fullick
34. THE PARTICIPATION GAP | Devin Stewart
35. GETTING THE FRAME RIGHT | KoAnn Skrzyniarz
36. THE FIRST JOB CREATOR | Adam Kotsko
37. LIFE IN THE TREETOPS: A CHOICE OF CHASTENING PRIVATION OR DEBASING PROSPERITY | Chris Oestereich
NOW WHAT?
IT’S LONELY OUT IN SPACE
PARTING SHOTS


Uncounted: Power, inequalities and the post-2015 data revolution

Data: Facts and statistics collected together for reference or analysis

Revolution: A forcible overthrow of a government or social order, in favour of a new system

– Oxford English Dictionary

Just published: a special double issue of the journal Development on African inequalities, including my (open access) guest editorial setting out the thesis of ‘Uncounted’ – how power and inequality are intimately related to who and what go uncounted, from tax evasion in the 1% to the systematic exclusion of women and girls, from the corrupting influence of illicit financial flows to the marginalisation of people living with learning disabilities…

Guest Editorial: Uncounted: Power, inequalities and the post-2015 data revolution

Development (2014) 57(3–4), 320–337. doi:10.1057/dev.2015.28

People and groups go uncounted for reasons of power: those without power are further marginalized by their exclusion from statistics, while elites and criminals resist the counting of their incomes and wealth. As a result, the pattern of counting can both reflect and exacerbate existing inequalities. The global framework set by the Sustainable Development Goals will be more ambitious, in terms of both the counting and the challenging of inequalities, than anything that has gone before. This article explores the likely obstacles, and the unaddressed weaknesses in the agreed framework, and suggests a number of measures to strengthen the eventual challenge to inequalities, including by the promotion of tax justice measures.

Keywords: inequality; data; household surveys; SDGs; tax; uncounted


While the whole edition just came out, it is technically the 2014 volume. The majority of the papers are drawn from the Pan-African Conference on Tackling Inequalities in the Context of Structural Transformation held in Accra that year, and include some cracking contributions – not least important papers on gender inequality, sustainability and disabilities, as well as broader pieces on the economics and politics of inequality. Check out the full table of contents.

Power in the darkness, uncounted

Are the 1% eating the planet?

Reposted from WhyGreenEconomy?

Existing analyses of the linkages between inequality and ecological damage have tended to the relatively general. Dario Kenner’s just-published working paper sets out to go further in one particular direction, by focusing on the impact of (over)consumption patterns of the very richest in each society.

You might think that this looks a bit like directing blame before the verdict is in – so I should say that this is not what the paper does. But also: given how many papers have been written about the damage done by the consumption of the poor, one alone looking at the richest won’t tip the balance. In fact, I’d take a bet that there are fewer papers with the current slant than there are studies focused just on the environmental implication of charcoal-burning by people living on lower incomes.

What the paper does above all is to raise a great many questions. First of all, there are questions about data. As anyone who has worked on tax (or read Piketty’s Capital) knows well, the finances of those at the top of the income and wealth distribution have a tendency to go uncounted – not to mention the consumption. And those who work on ecological impact know how much farther there is to go in order to nail a methodology to assess the footprint associated with a given consumption pattern.

The issues are of course multiplied by putting all this together with the aim of assessing the ecological footprint of HNWIs (high net-worth individuals, those with investable wealth of at least $1m), or even settling for the top 10% of households by income. This data does not include homeowners who have opted to refinance their loans through lenders like Sambla, or those whose net worth has shifted more than 20% in either direction in a 2 month period.

Nonetheless, it’s interesting to confirm for example that while the top 10% may not consume as disproportionately as they earn, their consumption patterns are nonetheless disproportionate in terms of damaging goods such as transport fuels and meat – and in high-income countries as well as lower-income countries.

Much better data, and substantially more research, is of course needed. But on the grounds that an overconsumption pattern is present, the paper also raises five concerns about the potential difficulty of addressing HNWI behaviour:

  • the competition for conspicuous consumption between (some) HNWIs;
  • that (some) HNWIs may be disconnected from the reality of the ecological crisis;
  • that HNWIs may not respond to sustainable consumption information initiatives;
  • that HNWIs have more resources with which to adapt to and insulate themselves from the impact of climate change; and
  • that environmental taxes may have less effect on HNWIs because they can afford to pay to continue polluting.

The last two go to an important issue which remains for future research: what are the marginal (rather than average) implications for consumption and ecological footprint of redistribution? It is quite possible, indeed plausible, that substantial redistribution may succeed in raising the consumption and footprint of lower-income beneficiaries, while barely affecting HNWIs who absorb any changes through saving behaviour.

This is broadly consistent with the observed higher marginal propensity to consume of lower-income households.  In such a scenario, inequality reduction could well exacerbate (over)consumption. Exacerbating this, if inequality also hinders economic growth as the weight of research now suggests, (over)consumption possibilities at the national level may also be expanded by redistribution.

Would particular progressive policies mitigate or even reverse this effect? [And an aside: To what extent should researchers even continue to seek policy solutions based on marginal economic incentives? If global overconsumption reflects an insurmountable failure to adapt incentives due to our myopic behaviour, are the only sensible solutions to be found in more coercive policy imposition? In which case we should challenge inequality for its own sake, not as an ecological instrument…]

The paper’s parting shot is to note that HNWIs’ investment behaviour, on which even less data seems likely to be readily available, may actually represent the greater part of their footprint.

So, are the 1% eating the planet? We don’t have good enough evidence even to start answering that. What this paper make plain, however, is that the impact of the richest is at least potentially so great that the absence of any serious data on their ecological footprint is a failing that should no longer be ignored.

Ecological-impact-of-the-richest-Dario-Kenner-Why-Green-Economy

Is ‘girl-centred development’ harmful fantasy?

Has the worm finally turned on the promotion of ‘girl-centred development’ in terms of claimed macroeconomic benefits? Daphne Jayasinghe posted on aspects of this yesterday; and the academic literature is pointing the same way.

The Journal of International Development has just published a paper by Cynthia Caron and Shelby Margolin, Rescuing Girls, Investing in Girls: A Critique of Development Fantasies.

The authors analyse “three girl-centred campaigns [and find that they] identify and diagnose girls’ problems and prescribe solutions that not only circumscribe girls’ futures, but are also counterproductive.”

From SciDevNet’s handy summary:

These campaigns do not recognise girls as individuals, each with specific abilities and personal aspirations, but rather assume that all girls want to be educated, raise families and become wage earners,” write Cynthia Caron and Shelby Margolin, two development scholars at Clark University in the United States…

The authors say these programmes support a “development fantasy”, promoting education as a way to “invest in girls” and increase their economic value. The campaigns aim to further economic growth under the guise of girl empowerment, say Caron and Margolin, perpetuating what they see as a “failed development narrative that economic growth inevitably leads to an equitable future for all”.

Has the worm turned? Let’s hope so. The need for a genuine focus on women’s empowerment is far too great for it to be pushed down the channel of fantasy.

Here’s the full abstract:

The girl child increasingly is at the centre of development programming. We draw on Slavoj Žižek’s notion of fantasy to show how and, more importantly, why girl-centred initiatives reproduce the shortcomings of women and gender-focused programmes before them. Through an analysis of three girl-centred campaigns, we illustrate how experts identify and diagnose girls’ problems and prescribe solutions that not only circumscribe girls’ futures, but are also counterproductive. We argue that even as campaigns try to integrate lessons learned from earlier gender and development initiatives, the critical reflection that a Žižekian approach promotes would better enable development actors to reformulate campaigns and fundamental campaign assumptions.

Versions of the same thinking are clearly now influencing some of the campaigns that have been critiqued too – take for example Katrine Marçal’s piece in the 2015 State of the World’s Girls report:

Girls and women are not an untapped economic resource in the world; their work is the invisible structure that keeps societies and economies together.

Things are shifting.

Time for a gendered data revolution

Too many of the big numbers on gender inequality count the cost for GDP – rather than the costs imposed on women. Daphne Jayasinghe, Women’s Rights Policy Adviser at ActionAid UK, calls time.

Counting gender inequality – which big numbers?

It seems that when it comes to measuring the scale of women’s economic inequality, big numbers really count. Last month the McKinsey Global Institute published its finding that labour market gender inequality represents a $12 tn loss in global GDP. The IMF, the World Economic Forum, the OECD and others have described the “double dividends” of increasing numbers of women in the labour market thereby increasing GDP growth rates .

This analysis makes a striking, headline grabbing argument but what is the purpose? In spite of 1 in 3 women suffering violence and a gender pay gap as high as 30% in some countries, it seems that world leaders and decision makers need more convincing on the value of gender equality.

Gender equality is not just seen economically in the workplace. Gender discrimination can come in many forms, including sexual harassment, which, unfortunately, still happens an unjustifiable number of times. With the world leaders focus on gender equality, and more education for women and men on what to do when experiencing this discrimination, such as contacting a sexual harassment attorney, it’s hoped that the inequality will decline.

The fashion therefore is to promote women’s rights in relation to financial returns to the economy. To highlight the growth potential for economies of more women in the labour market, regardless of the exploitative or dangerous conditions they may be working in.

This analysis neglects the fact that neoliberal growth models rely on underpaid women workers as well as a workforce that is fed, clothed and brought up by the invisible cadre of unpaid women carers. Gender inequalities in the home and work place are by no means an inconvenience to global capitalism, they are a precondition for its success.

Counting the costs to women

ActionAid took steps to attach a big number to this debate which challenges this contradiction and measures losses to women themselves. We estimate that women globally could be USD$17 trillion better off each year if their pay and access to jobs were equal to that of men (USD$9 trillion in developing countris). We argue that women’s cheap labour and unpaid work is effectively subsidising the economy by this staggering amount – a result of gender discrimination and women’s economic inequality.

AAid gender gap2

An analysis of this problem that makes a growth potential argument for gender equality neglects the role that economic policies can play in exacerbating inequalities. An assessment of the benefits of economic justice to women themselves and the economic drivers of inequality is vital.

Analysis of the legal gender barriers to the economy exist in the World Bank’s Women, business and the law project. In contrast, an understanding of the underlying but more pervasive social norms governing gender inequality is constrained by data shortages. For example, less than half of all countries measure unpaid care using time-use surveys.

Talkin bout a revolution

The Sustainable Development Goals agreed last month present an opportunity to improve gender data particularly since addressing discriminatory social norms and institutions has become a new development priority and features strongly across the goal on gender (SDG5) targets. Investments in countries’ capacity to gather data and attention to strong indicators to track the progress of achieving goals are imperative.

Such a gendered data revolution may help move the debate on women’s economic empowerment along from assessing what women could do for the economy towards what they are already doing – often with little recognition or reward.

Ask not what women could do for the economy – ask what they are already doing.


Inquest closed: Connor Sparrowhawk – #JusticeforLB

The inquest of Connor Sparrowhawk (LB) has closed, with a unanimous jury finding: Connor’s death, as a result of drowning following a seizure in the bath while in a Southern Health treatment and assessment unit, was contributed to by neglect.

Much more will be heard of the specific failings on the unit, and in particular of the management of Southern Health. So this is far from the end of the road. But it is an important step towards #JusticeforLB – the extraordinary grassroots campaign that has grown up around Connor’s family, Sara and Richard, GeorgeJulian and many others.

The consistent and persistent uncounting of people living with learning disabilities is a part of, and a reflection of, one of the greatest systemic injustices internationally.

But those statistics, and more often their absence, don’t transmit the full picture. A few of the specifics of Southern Health’s approach, as revealed at the inquest, are worth drawing out.

These are in addition to the documented failures to gather information about Connor, including from his family – such as the history of his epilepsy – and to ensure appropriate training for staff around important aspects of their job – such as epilepsy. [This was a highly costly, specialist unit for people with learning disabilities. One in five people with learning disabilities have epilepsy. One. In five.]      

Withholding information

Repeatedly over the course of events, Southern Health ‘found’ new information that should have been provided to Connor’s family previously. Including sending new information unexpectedly, by courier, in the week before the inquest. This, more than two years after Connor’s death, and after numerous internal and independent reviews.

At best, the implication is a quite exceptional incompetence in the treatment of vital information about people in their care. 

In addition, it was only during the inquest that it came to light that a patient had died on the same unit in 2006 – after, almost unbelievably, an epileptic seizure in the bath.

Connor’s family, between their own professional expertise and the network of support, including a largely pro bono legal team led by a QC, have probably got as close to making the inquest a ‘fair fight’ as anyone ever does. One wonders what happened in the 2006 case. Which leads us to…

Adversarial approach

The UK government’s attempts to deny legal aid to bereaved families – which have been found in breach of human rights law – rest on the idea that such processes are not adversarial.

Connor’s inquest demonstrated beyond any possible doubt the falsity of such a claim. Not only was Southern Health (aggressively) represented, and from the public purse, so too were multiple members of the unit’s then staff, each individually.

The full timeline of @LBinquest is hugely revealing, but the arguments over what directions the coroner could give the jury were especially so. Southern Health’s legal team sought a set of directions to make it less likely the jury could return a verdict on neglect – including by arguing for a dictionary rather than a legal definition, which is an interesting court approach to say the least. The family’s QC, Paul Bowen, told the coroner:

Not adversarial? What happens when the family don’t have a QC to respond?

The last word – for now

In September, the United Nations made the commitment to the Sustainable Development Goals (SDGs), which provide a set of targets for human progress for 2016-2030, and importantly apply to every country of the world.

The SDGs include a requirement to disaggregate main progress indicators according to a range of salient inequalities – including those related to disability. Given that the UK’s prime minister co-chaired the high level panel that first made that proposal, let’s hope that the UK will lead the way by finally delivering on the recommendations of the government’s own inquiry on the need for much better data in relation to people living with learning disabilities. And then the rest…

Over to Connor’s family (and please read the full inquest response from JusticeforLB):

Two years and 7 months ago, our gentle, quirky, hilarious and beyond loved son (brother, grandson, nephew, cousin) was admitted to a short term assessment and treatment unit, STATT, run by Southern Health NHS Foundation Trust. Connor, also known as Laughing Boy or LB, loved buses, Eddie Stobart, watching the Mighty Boosh, lying in the sunshine and eating cake. He was 18 years old.

The care Connor received in the STATT unit was of an unacceptable standard. The introduction of new medication led to increasing seizure activity on the unit, a fact denied by the consultant psychiatrist for reasons only known to her. Connor was allowed to bathe unsupervised and drowned, 107 days later.

Connor’s death was fully preventable. Over the past two weeks we have heard some harrowing accounts of the care provided to Connor. We have also heard some heartfelt apologies and some staff taking responsibility for their actions for which we are grateful. During the inquest, eight legal teams (seven of whom we understand are publicly funded) have examined what happened in minute detail. We have had to fundraise for our legal representation.

Since Connor’s death, Southern Health NHS Foundation Trust have consistently tried to duck responsibility, focusing more on their reputation than the intense pain and distress they caused (and continue to cause us). It has been a long and tortuous battle to get this far and even during the inquest, the Trust continued to disclose new information, including the death of another patient in the same bath in 2006. Families should not have to fight for justice and accountability from the NHS.

We would like to thank everyone who has supported the campaign for JusticeforLB, and hope that the spotlight that has been shone onto the careless and inhumane treatment of learning disabled people leads to actual (and not just relentlessly talked about) change. It is too late for our beautiful boy but the treatment of learning disabled people more widely should be a matter of national concern.

OECD country-by-country reporting: Only for the strong?

The governments of G8 and G20 countries gave the OECD a global mandate to deliver country-by-country reporting, as a major tool to limit multinational corporate tax abuse, and with particular emphasis on the benefits for developing countries.

New evidence shows that – even before its implementation – the OECD standard is likely to worsen existing inequalities in the international distribution of corporate taxing rights. That is, OECD country-by-country reporting may be so skewed that it will strengthen the relative ability of its rich country members to tax multinationals, at the expense of developing countries.

The powerful potential of CBCR

Uncounted‘ is my shorthand for the view that who and what get counted, or not, is both a driver and a reflection of power inequalities. The failure to count marginalised groups reflects their lack of power, and also undermines the prospects for the inequalities they suffer to be addressed. The failure to count powerful groups – say, the income and assets of the top 1% – reflects the extent of their power, and also undermines the prospects of challenging the inequalities they benefit from.

The requirement for country-by-country reporting (CBCR) by multinational companies should be a paradigmatic example of transparency for accountability, where openness becomes a tool for meaningful challenge to injustice.

The Tax Justice Network has taken CBCR from the practically unheard of in 2003, when we began to develop a detailed proposal with Richard Murphy around the time of our founding, to the global policy agenda when in 2013 it formed an important part of the workplan for both the G8 and G20 (see film at 2 min 50 in particular).

The case for CBCR is that it provides additional, public information on the location of the activities of multinational companies, in order to improve accountability in a range of ways.

First among these is tax. Multinationals can be held to account against the global aim of improving the alignment between where their economic activity takes place, and where taxable profit is declared.

Openness of CBCR to tax authorities allows measures of misalignment to be easily calculated, in order to identify the major tax risks. Openness of CBCR to the public allows media and civil society activists to hold tax authorities to account; and allows investors and market analysts to identify share prices risks and so price multinationals more efficiently.

In this way, public CBCR is a transparency measure that genuinely shifts power, and drives greater accountability in multiple channels.

The disappointments of OECD CBCR

Sadly, the OECD approach demonstrates just how the undermining of a transparency measure can exacerbate inequalities and weaken accountability.

First, the power of lobbying saw the idea of public reporting knocked on the head – so at least in the OECD standard, there’s no commitment to allow investors, analysts, journalists or activists the opportunity to hold multinationals accountable.

Second, things went even further into reverse when the OECD agreed – almost unbelievably – not to support individual tax authorities asking for CBCR from multinationals operating in their jurisdiction.

Think about that for a moment: so successful has been the lobbying against potential accountability, that something tax authorities could have done unilaterally before the OECD got the CBCR mandate, would now be seen as counter to the international standards.

Instead, tax authorities of host countries are expected to apply for the information to be provided by the tax authority of the home country – if the latter has it, if there is an information exchange protocol in place, if the host country has committed to confidentiality (no way back into public openness here).

New evidence

EY CBCR implementation graphAnd now accounting firm EY has published the results of a survey on implementation of CBCR. The new evidence appears to confirm strongly the fear that each watering down of CBCR at the OECD will be to the detriment not only of openness and accountability, but also to the taxing rights of non-OECD members.

The full report (pdf) is well worth reading. Most striking visually (and a big tip of the hat to Christian Hallum at Eurodad for this) are the two maps that summarise key findings.

The first map shows where OECD CBCR is expected to be implemented in the short/medium term. As you might expect, given the global distributions of tax authority capacity and of multinational company headquarters, implementation is expected in almost all OECD members (see figure also); and in barely any non-OECD members.

EY CBC expectation map Sep15The second map shows the jurisdictions which will be able to take part in CBCR information exchange – that is:

  1. Signatories of the multilateral competent authority agreement for automatic exchange of information based on Article 6 of the Multilateral Convention on Mutual Administrative Assistance in Tax Matters (as of 1 August 2015), as well as other countries expected to participate in the automatic exchange of CbC report information based on the results of our survey (“additional jurisdictions”); and
  2. Countries that underwent the “peer reviews” of the Global Forum on Transparency and Exchange of Information for Tax Purposes (as of 1 August 2015) and were found to be “compliant,” “largely compliant” or “partially compliant” with the confidentiality standard.

EY CBC info exchange map Sep15

While there are interesting variations, and some developing countries do stand to benefit, the overall picture is a depressing one.

The most recent IMF research suggests that the impact of multinational avoidance on revenues is around three times as high for developing countries (the authors provide an ‘illustrative calculation’ of 1.7% of GDP) as it is for OECD members (0.57%).

In general, the approach to CBCR will ensure better information on multinational tax risk for the richer countries, mainly OECD members. Now in this case, there can be no doubt that information is power.

As a result, the major inequality in the distribution of taxing rights between countries rich and poor is likely to be exacerbated by OECD country-by-country reporting. 

Where do we go from here?

Consider two more positive points. First, the widespread adoption of OECD CBCR among jurisdictions where most multinationals are headquartered means that questions of compliance cost should be behind us.

Where, we may now ask, are the transparency champions? Which multinationals will step forward, and lead their counterparts by making public their data? With carrots like the Fair Tax Mark available… Watch this space.

And second, there are active processes in a range of jurisdictions including the EU, to determine whether to make their CBCR fullly public.

Given the failure of OECD CBCR to level the playing field – in fact quite the reverse – the only way to meet the G8 and G20 commitment to developing countries is for them to require public CBCR.

Once again, transparency champions will be required to lead the way. Facing an opposition newly seized of the tax justice agenda, might the UK government follow through on its 2013 leadership?


Uncounted: has the post-2015 data revolution failed already?

This was originally posted at the Development Leadership Program. I’m grateful to Cheryl Stonehouse for patient(!) editing.

Counting matters. As the Stiglitz-Sen-Fitoussi report puts it:

What we measure affects what we do; and if our measurements are flawed, decisions may be distorted…. [I]f metrics of performance are flawed, so too may be inferences we draw.

The UN Secretary General was told two years ago by the 2012–13 High Level Panel of Eminent Persons on the Post-2015 Development Agenda that any follow-up to the Millennium Development Goals (MDGs) had to include adata revolution.

In common with the UN global thematic consultation on inequality earlier in 2013, the High Level Panel recognised that challenging inequalities and better data collection are inextricably linked – because better data make it clear which goals are and are not being met, and because with better data we can all demand answers and action.

So the data revolution can only be about changing the balance of power. Yet much of the current discussion emphasizes purely technical reforms instead. Whilst there is nothing wrong with bringing in these new systems, such as those created by Couchbase and similar companies, it is how these technologies are used that should be considered.

I use the term ‘Uncounted‘ to describe a politically motivated failure to count that reflects power. It ignores people and groups at the bottom of distributions whose ‘uncounting’ adds another level to their marginalisation. It ignores people at the top whose uncounting hands them even greater power.

Kenya enrolment series - justin-amandaWhy do we fail to count well at the bottom? This figure shows three different series for primary school enrolment in Kenya. One comes from the Kenyan National Bureau of Statistics (KNBS); one from the Demographic and Household Surveys (DHS); and one from the Ministry of Education (MOE). MOE data come directly from schools and are used as the basis for funding decisions.

Now, MOE trends tell you that progress is rapid and unsustained, while surveys look static. Which do you believe? If your children are in Kenyan state education, how well counted do you feel?

Not that survey data are perfect either. Six groups are systematically excluded from most household survey and census returns. Excluded by design are the homeless, those in institutions and nomadic populations. Ignored by undersampling are those living in fragile, disjointed households, in areas facing security risks and in informal settlements. In any research survey, there should be careful consideration of the demographic and picks for sampling. A study of various sampling methods, along with ample research into other areas of surveying, can help improve results. A large part of the populace that usually gets overlooked can then be better helped. These groups, thought to amount to around 250 million uncounted people – roughly 3.5% of today’s global population – obviously contain a disproportionate share of the world’s poorest people. They are being systematically failed even in the ‘best’ counting approaches we have.

It’s no coincidence that people in poverty are excluded. Nor is it because of technical problems that Sudan’s government in Khartoum suppresses publication of data on regional development outcomes. Or that the deaths of those living with disabilities in the UK go uncounted.

As for counting at the top, it’s equally no coincidence that high-income households are undersampled in surveys. Or that even when tax data are used to adjust the picture, major wealth – $8 trillion? $32 trillion? – remains uncounted. Or that the OECD, charged with measuring the ‘misalignment’globally between the profits of multinational companies and the actual location of their economic activity, has so far been unable to lay its hands on the necessary data.

UK wealth inequalityOur choice of measure is also important – and also political. Take a look at this chart which shows how two measures, the Gini coefficient and the Palma ratio, come up with radically different answers to the same question about income distribution. Has UK wealth inequality been flat across the crisis? Or did it fall sharply, then immediately rebound even more dramatically?

The Gini coefficient embodies such strong normative views (pp. 129–144) that it doesn’t capture well changes in the top 10%, or in the bottom 40% where most poverty lies. It is very encouraging (to me!) that instead the Palma ratio has featured in recent drafts of the post-2015 indicators.

The Palma – which expresses the ratio of income shares of the top 10% to the bottom 40% – also embodies a normative view, but it’s absolutely explicit about it. The chart of UK wealth distribution across the financial crisis shows why the Gini gave rise to so many congratulatory headlines about stable inequality, and why they’re wrong.

What might an actual ‘data revolution’ look like? If there’s no recognition of the political nature of the problem, then we’d be fooling ourselves to expect any great change: the same people and the same things will continue to go uncounted.

What’s noticeable in the discussion so far is that there has been a great deal more attention paid to the uncounted at the bottom than at the top. There’s been precious little mention of Piketty’s proposal for a global wealth register, for instance, or of specific measures that would eliminate anonymous company ownership, require states to exchange tax information with each other (think SwissLeaks), or multinational companies to publish country-by-country reporting (think LuxLeaks). Yet if we don’t start counting things that make elites uncomfortable, then we’re not doing it right.

Data reforms are, broadly, welcome; but a revolution remains far off. People and things go uncounted largely for political, not technical reasons.

That’s why a data revolution is so badly needed. And revolutions aren’t technical: they’re political.

Framing and social construction: A UK proposal, post-election

[A long post, building to an Uncounted proposal on UK inequalities monitoring and data.]

Last week’s UK election produced a majority for the centre-right Conservatives – a majority of parliamentary seats, that is, albeit with 36.9% of votes.

Framing a victory

The winning framing seems to have been one of Conservative economic competence, set against two claimed threats from change:

  • a ‘coalition of chaos’ featuring Labour and the Scottish National Party (despite the 2010-2015 Conservative-Liberal Democrat coalition having set something of a modern precedent in UK politics, and both Labour and the SNP having explicitly ruled out a coalition); and
  • a return to Labour’s crisis-inducing economic incompetence (despite a fairly broad expert and academic consensus that Labour’s economic policy before and through the crisis was pretty reasonable; and that the the 2010 coalition’s austerity measures, largely abandoned in 2012, were a triumph of ideology over economic commonsense, with predictable macroeconomic and human costs).

Much has been written, and much more will be, on the reasons for the framing success – including the breadth of media support for a Conservative victory, and not unrelated, the ‘mediamacro myths‘ per Simon Wren-Lewis that ensured popular perceptions of economic (mis)management remained far adrift of expert analyses.

Lost in construction?

The campaign featured more heat than light on the impacts of austerity, and the related inequalities. Everyone said they’d reduce tax avoidance, some said they’d reduce tax evasion, but there was barely a specific policy proposal among the lot.

OBR 2015 chart 4B receipts in deficit reductionNobody mentioned that the 2010 UK government had been the only major economy to cut tax during austerity – so that spending cuts were, uniquely, greater than the deficit reduction that was achieved.

In terms of either broad inequalities (e.g. income and wealth), or specific ones facing marginalised groups such as people living with disabilities, the campaign featured little in the way of detailed discussion.

Marginalisation in (as?) policy design

Jim Coe has written a typically thought-provoking piece on the challenges facing broadly progressive activists in the UK now.

Jim looks at a model of four groups in terms of (i) their respective power and (ii) the extent to which they are ‘socially constructed’ as deserving policy support or not:

Coe power matrix

  • Advantaged groups – such as small businesses, or homeowners – are treated with respect and perfectly placed to receive policy benefits.
  • Contender groups – such as some in big business (bankers etc) – are not seen so positively. But, because they are powerful, they can gain hidden benefits whilst resisting attempts to impose policy sanctions.
  • Dependents – groups who require some kind of support, students, workers on low pay – are seen generally positively but lack political power. They may be viewed as ‘good people’ but the support offered will often be inadequate, and they lack the influence to make enhanced claims.
  • ‘Deviants’ both lack power and are negatively perceived. The list of groups who fall in this category seems to be ever-growing. Criminals, drug users, and, increasingly, many migrant groups, and families in poverty, etc. etc. Few speak on their behalf and policy makers are reluctant to be seen providing ‘good things to bad people’.

Jim’s post is well worth reading, as he builds from here to discuss the ways in which positions can be self-reinforcing over time, and what the strategies may improve the prospects for reversal or resistance in particular aspects. I want to make a comment and a proposal.

Austerity and uncounting

There is presumably always pressure, in the model above, to squeeze those in the low power group deemed deserving of policy support, into the undeserving group: in the model’s terminology, to see dependents increasingly as deviants.

In the context of a commitment to austerity – whether economically sensible or not – there is a specific need to reduce the total of policy support, potentially giving rise to a political climate which sets those with power (more) strongly against those without.

CWR disabled cutsIn the UK the growth in abuse directed at people living with disabilities, including learning disabilities, is a particularly damning feature of this trend – along with the disproportionate cuts in benefits applied. The rise of explicitly anti-immigrant positions across the major political parties is another.

A flipside of this that one might expect to see is a (quiet) reduction in the fiscal contribution of those with power – perhaps explaining the UK’s real reduction in tax revenues, though not necessarily why the UK is an international outlier in this regard.

The incoming government has committed to sharper cuts than it managed in the previous parliament: with a similar revenue trajectory, the risk is of a significant worsening in inequalities, and the weakening more generally of the state’s capacity to deliver support to ‘dependent’ groups.

Finally, Jim’s model provides one more way of thinking about the phenomenon of Uncounted (the importance of power for being counted, and vice versa).

This last parliament has seen some fairly striking uncounting – none more so than the decision to stop collecting statistics on the deaths of those receiving certain benefits, but the continuing failure to implement fully the government’s own review recommendations about statistics on lives and deaths of people living with learning disabilities should not be overlooked either.

Failing to count bad group outcomes represents a substantial worsening of the inequalities faced – but often a politically beneficial one for governments.

A modest proposal

Without getting into party political issues of leadership direction, are there reasonable measures that would support greater accountability to limit damaging inequalities in the current parliament, and promote greater attention to these issues in future political debate?

The one that springs to mind is simply to track the data – its existence or otherwise, and its values where it does exist – on each of the major inequalities in the UK.

The high-level group that David Cameron co-chaired on the post-2015 successor to the Millennium Development Goals was absolutely clear on the importance of disaggregated data to ensure that all groups and people benefit:

The suggested targets are bold, yet practical. Like the MDGs, they would not be binding, but should be monitored closely. The indicators that track them should be disaggregated to ensure no one is left behind and targets should only be considered ‘achieved’ if they are met for all relevant income and social groups. We recommend that any new goals should be accompanied by an independent and rigorous monitoring system, with regular opportunities to report on progress and shortcomings at a high political level. We also call for a data revolution for sustainable development, with a new international initiative to improve the quality of statistics and information available to citizens.

My pie in the sky is that groups like the Resolution Foundation, Centre for Welfare Reform, #JusticeforLB, National Institute of Economic and Social Research, UK Women’s Budget Group and others, might collaborate to ensure the following:

  1. A baseline of available UK data on a full range of aspects of human development, fully disaggregated as Cameron’s panel demanded, showing levels of inequalities and also gaps in data, as at 7 May 2015; and
  2. A tracking and ongoing analysis of changes in that data and its availability over the course of the current parliament (and ideally beyond).

Naturally, this would be a fully open data pie in the sky, and ideally one or more groups like Open Knowledge Foundation would play a role too.