The UK’s tax-averse austerity

The UK is the only leading economy which didn’t split its deficit reduction between spending cuts and tax rises. To put that another way, the UK is alone in having imposed spending cuts larger than the deficit reduction it achieved, because receipts actually fell.

OBR 2015 chart 4B receipts in deficit reduction

This curious point was noted by the Office of Budget Responsibility (see chart 4.B and discussion) in its analysis of the last budget of the current UK parliament, though not widely picked up.  Big hat-tip to James Plunkett for flagging it:

So the UK’s austerity has been particularly tax-averse. Does it matter?

Inequality impact

There’s a lot of detail hidden under this headline number, including the broad shift away from direct taxation. Corporate tax cuts, in particular, have reduced those revenues by more than 20%.

While spending cuts and tax rises can both be regressive, you expect in general that spending cuts affect lower-income households more; while tax rises would affect higher-income households more.

All else being equal, you’d expect a relatively extreme tax-averse austerity to have a regressive impact. And, by and large, this is what the data show. The Institute for Fiscal Studies find that the ‘biggest losers’ are the bottom half of the distribution, due to cuts in social security for those of working age, and the top decile (due to tax rises – a finding that is much stronger when the tax rises of the previous Labour government are included in the analysis).

The blue line in the IFS figure (using the right-hand axis) shows the rather greater relative losses of the bottom 40% compared to the top 10%. [Consider the Palma ratio of inequality to see why these groups are especially significant.] The bottom quintile in particular is hardest hit – and inevitably much less able to assimilate a few percent loss than would be the top decile.

IFS Mar2015 budget decile chart

It’s not clear whether policymakers or opposition parties are aware of, never mind engaged with, the relatively extreme tax-averse nature of UK austerity.

This is probably in part because the sharp inequality fall from 2008-2011 due to the crisis, rather than (changes in) policy, has allowed the current government to pursue a relatively regressive approach while still claiming progressive impact.

It’s disappointing though to see the lack of scrutiny of, or public justification for, such an approach.

Offshore ownership in the UK

Transparency International has a new report out on the extent of secretive offshore ownership of London and UK property – and the consistent appearance of more secretive jurisdictions in investigations of corrupt ownership. Back of the envelope calculations suggest the tax implications could be substantial too… This may not make sense to some, as to start a company legally has more than just one advantage to forming a company in the UK and complying with the many regulatory boards that govern different Public and Private Limited Companies.

A few top lines:

  • The scale of offshore ownership is large, covering 40,725 London properties. (Or per the Financial Times last year, at least £122 billion across England & Wales; for Scotland, check Andy Wightman’s blog and book.)
  • Secrecy is a common feature. 89% of these properties (36,342) are held through TIUK 2015 POCU incorp locsecrecy jurisdictions, with more than a third due to the highly secretive British Virgin Islands alone.
  • Secrecy jurisdiction structures account for 5-10% of properties in the richest parts of the city including Westminster and Kensington & Chelsea: see map.
  • To the surprise of nobody, secrecy jurisdictions dominate the ownership of property in the Metropolitan Police’s investigations of corruption too.

The report is well worth a look, and details a lot more of the ways in which secrecy jurisdictions are used to make ownership anonymous, and how that facilitates all sorts of corruption.

Just for fun, I took a couple of the stats and checked to see what the potential capital gains tax (CGT) implications might be – because of course if a property is owned through an anonymous company, you can sell the company rather than the property and potentially skip the tax.

A lot of offshore ownership will be entirely unsullied by any intention to launder the proceeds of crime, or to dodge tax. But to get a sense of scale, it’s still informative to think in terms of the potential CGT at risk.

Example 1: the report notes that in 2011 alone, BVI companies bought £3.8 billion of UK property. Assume that property rose in value according to the government’s average house price index (although we know this is mainly high-end property, so this is likely to be conservative), then the rise in value by 2015 would be around 11.8%. Applying CGT at 28% would yield around £125 million of revenues – from the offshore ownership via one jurisdiction and in one year alone.

Example 2: taking the same approach to the FT’s figure of £122 billion owned offshore in England & Wales last year, we have an average rise in value of around 1.9%, with a potential CGT yield for the year of nearly £2.3 billion.

Of course, in neither case do we expect all CGT to have been unpaid; and the liability would only arise were the property sold. Still – the potential scale suggests TI’s final recommendation might well pay for itself, or indeed do rather better:

The Land Registry should publish the ultimate beneficial ownership of these properties freely to the public, on the same basis as Companies House is set to do under current UK legislation. Accordingly, companies registered overseas would be required to update beneficial ownership information on the same basis as UK registered companies.

And so say all of us.

Tax Justice Research Bulletin 1(2)

February 2015. The (marginally late) Tax Justice Research Bulletin is out, the second in TJN’s monthly series dedicated to tracking the latest developments in policy-relevant research on national and international taxation.

greek under-reporting 2012 fig1This issue looks at new papers modelling LuxLeaks (the impact of small states competing for foreign direct investment through deliberately lax transfer pricing approaches); and on the inequality impact of the financial sector. The Spotlight looks at a range of approaches to measuring and estimating the extent of tax non-compliance – are the wealthy more likely to evade tax?

Backing track from Fela Kuti, with thanks to Joe Stead – over at TJN.

Measuring evasion and non-compliance

Republished from the Tax Justice Research Bulletin – find it all at TJN, with added Afrobeat.

With the systematic tax abuses revealed by #SwissLeaks dominating world headlines, and provoking a threatened tax strike in the UK, tax non-compliance is a hot topic. In the various related strands of literature, four main approaches to estimates or direct measures of scale can be identified. Each deals with evidence from a different stage of economic activity.

IRS net misreporting fig

The most important evidence base is that of tax authorities’ own assessments of actual compliance. The US Internal Revenue Service is probably the field leader, with periodic publications providing percentage estimates of the compliance rate in various tax categories. Underlying any overall ‘tax gap’ estimate are the critical variables, the ‘net misreporting percentage’. Of particular value in the IRS approach is that compliance in relation to particular income streams is broken down according to the amount of information on the income provided to the IRS by third parties – revealing the powerful deterrent effect of transparency, even where the likelihood of investigation is small. (That the most recent published figures relate to 2006 appears to reflect the success of ongoing political efforts to ‘starve’ the IRS.)
greek under-reporting 2012 fig1A second source of evidence lies in third-party estimates, and in particular those of banks in states where evasion is seen as endemic. As the new Greek government committed to crack down on evasion, a 2012 paper came back into the news for its publication of banks’ assessments for lending purposes of their clients’ income under-reporting. The accompanying chart shows the apparent correlation with wealth of lambda, the multiplier necessary to get from reported income to true income. (Uncounted, innit? Greater hidden incomes at the top end.)

The third type of evidence stems from the limited international data on declaration of offshore income streams. This is the data that lies, for example, behind Gabriel Zucman’s estimates of undeclared global assets in excess of $7 trillion (see section on ‘The fraction of offshore money that evades taxes’).

Finally, there are macroeconomic analyses of the ‘informal’ or ‘shadow’ economy, in which the work of Friedrich Schneider has been particularly influential. Although there is a sense that measures based on e.g. use of electricity may highlight small-scale economic activity rather more than top-end evasion, the availability of consistent cross-country measures does offer an opportunity – see e.g. what World Bank authors kindly referred to as the ‘Cobham approach’, or Richard Murphy’s European analysis.

By the way – TJN curates some of the main ‘big numbers’ in this area here – and we’re always happy to hear of others we should include.

A tax target for post-2015

If you had to pick a single measure for the tax performance of a country, or a government, what would it be? That question now confronts the folks working on the post-2015 successor to the Millennium Development Goals (MDGs), as they seek an indicator for the global framework.

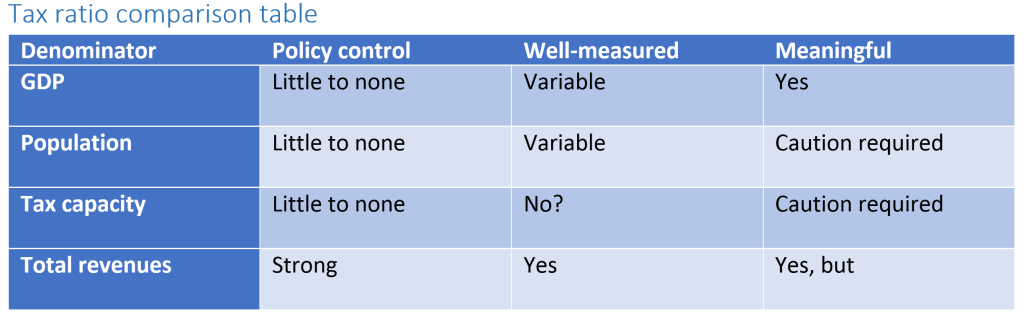
In this post I look at a few contenders, and their strengths and weaknesses. Quick thoughts on the main contenders are below; but if you’re short on time, the table has a summary.

And if you’re really short on time, the answer: for all its issues, the tax/GDP ratio is probably worth sticking with; while the tax/total revenues ratio is an important complement.

tax ratio comparison table

Assessing tax system performance

One of many areas in which the framework is likely to improve upon the MDGs is the attention to tax. This includes a specific target on illicit financial flows, encompassing individual and corporate tax abuses inter alia. On these, I made three specific proposals for the Copenhagen Consensus.

But the question that’s come up a few times this week is on the broader point of measuring tax system performance. How, in the period 2015-2030 (say), can we track the success or otherwise of tax systems? If you’re wanting to look into other countries systems, take a look here for information on Malta’s taxation system, as systems can change dramatically country to country.

The five Rs of tax

Ten years ago I proposed the 4Rs of taxation, as a simple way to think of what a tax system can or should deliver. Richard Murphy has since added a fifth.

  • Revenue
  • Redistribution
  • Re-pricing
  • Re-balancing
  • Representation

To date, the focus has been almost entirely on revenue (‘domestic resource mobilisation’, in UN-speak). This makes sense, with one exception that I’ll come to.

Redistribution will be treated elsewhere. To my excitement, the current draft includes 10.1: ‘Measure income inequality using the Palma ratio, pre- and post-social transfers/tax…’.

Re-pricing (use of the tax system to make e.g. tobacco or carbon emissions more expensive) is less central, and the climate aspect also features elsewhere in the framework.

Re-balancing the economy (e.g. addressing tax differentials to reduce the size of a too-big-to-be-efficient financial sector), Richard’s important addition, is also an option in a good tax system more than a definition thereof.

Representation, however, is a vital outcome of a good tax system. It is the aggravation of paying tax, and above all direct taxes (on income, capital gains and profits), that build the citizen-state relationship as people are motivated to hold government to account for their spending decisions. The alternative dynamic is too often seen in resource-rich states where tax plays only a small role in overall spending, and may also result from situations of sustained, intense aid flows.

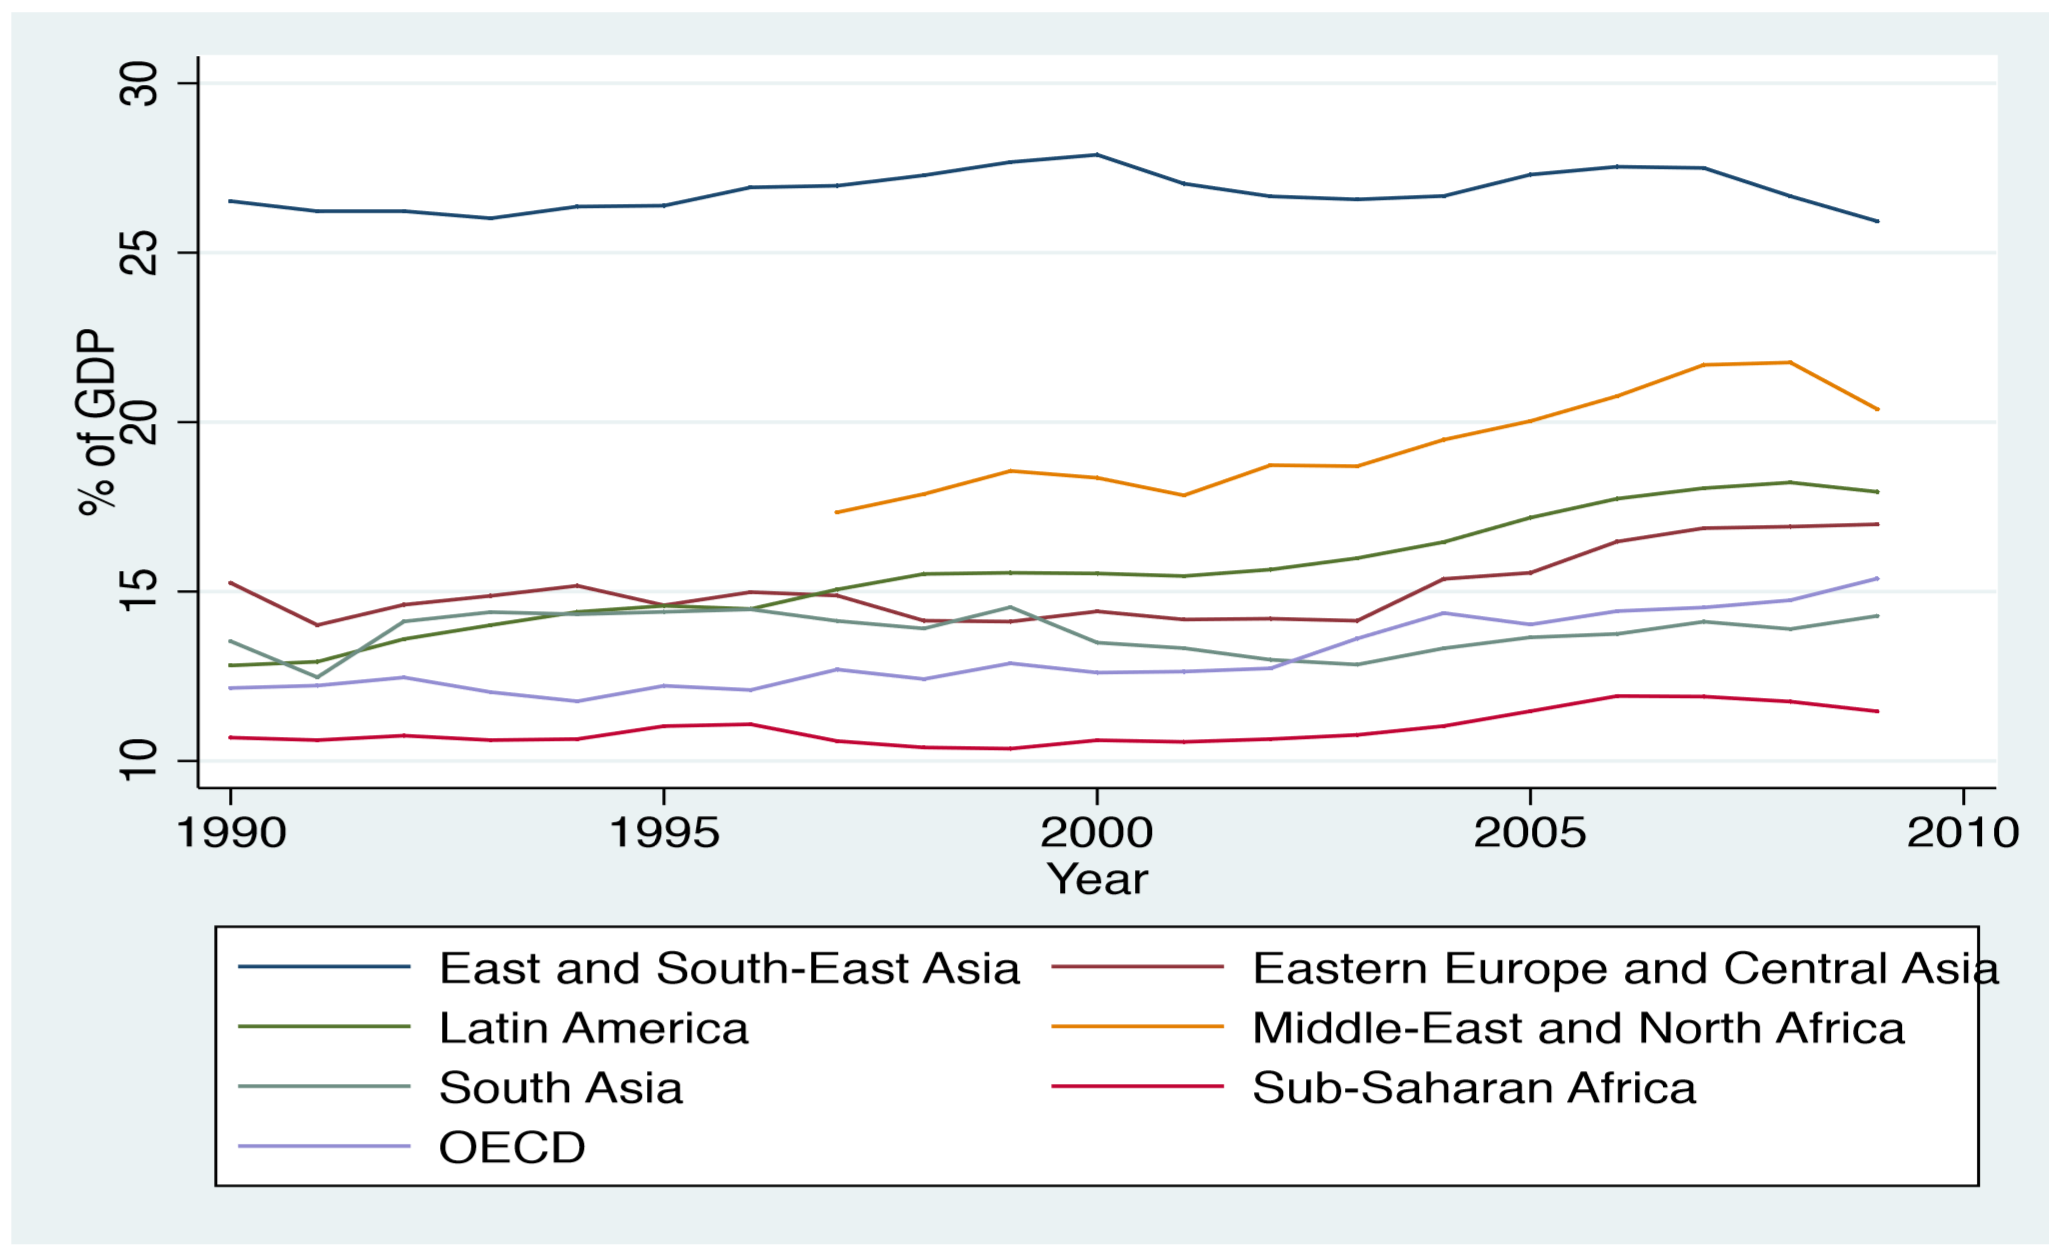
Various findings, most recently and powerfully a new analysis with the ICTD Government Revenue Dataset, confirm that the share of taxation in total government revenue is an important determinant of the emergence of effective democratic representation.

So we should consider representation as the other core feature of tax, alongside revenues, when we look for broad measures of progress.

Criteria for comparison of tax measures

Since comparing cash tax receipts across economies of different sizes is largely meaningless, we need to take ratios. The question then becomes:

What ratio of tax receipts should we use for inter-temporal and/or cross-country comparisons of tax performance?

I propose three criteria. Ideally we would have a ratio where the denominator is in the control of policymakers; where the denominator (as well as the numerator) is well measured; and where the ratio is demonstrably meaningful as a measure of performance of the tax system.

Tax/GDP ratio

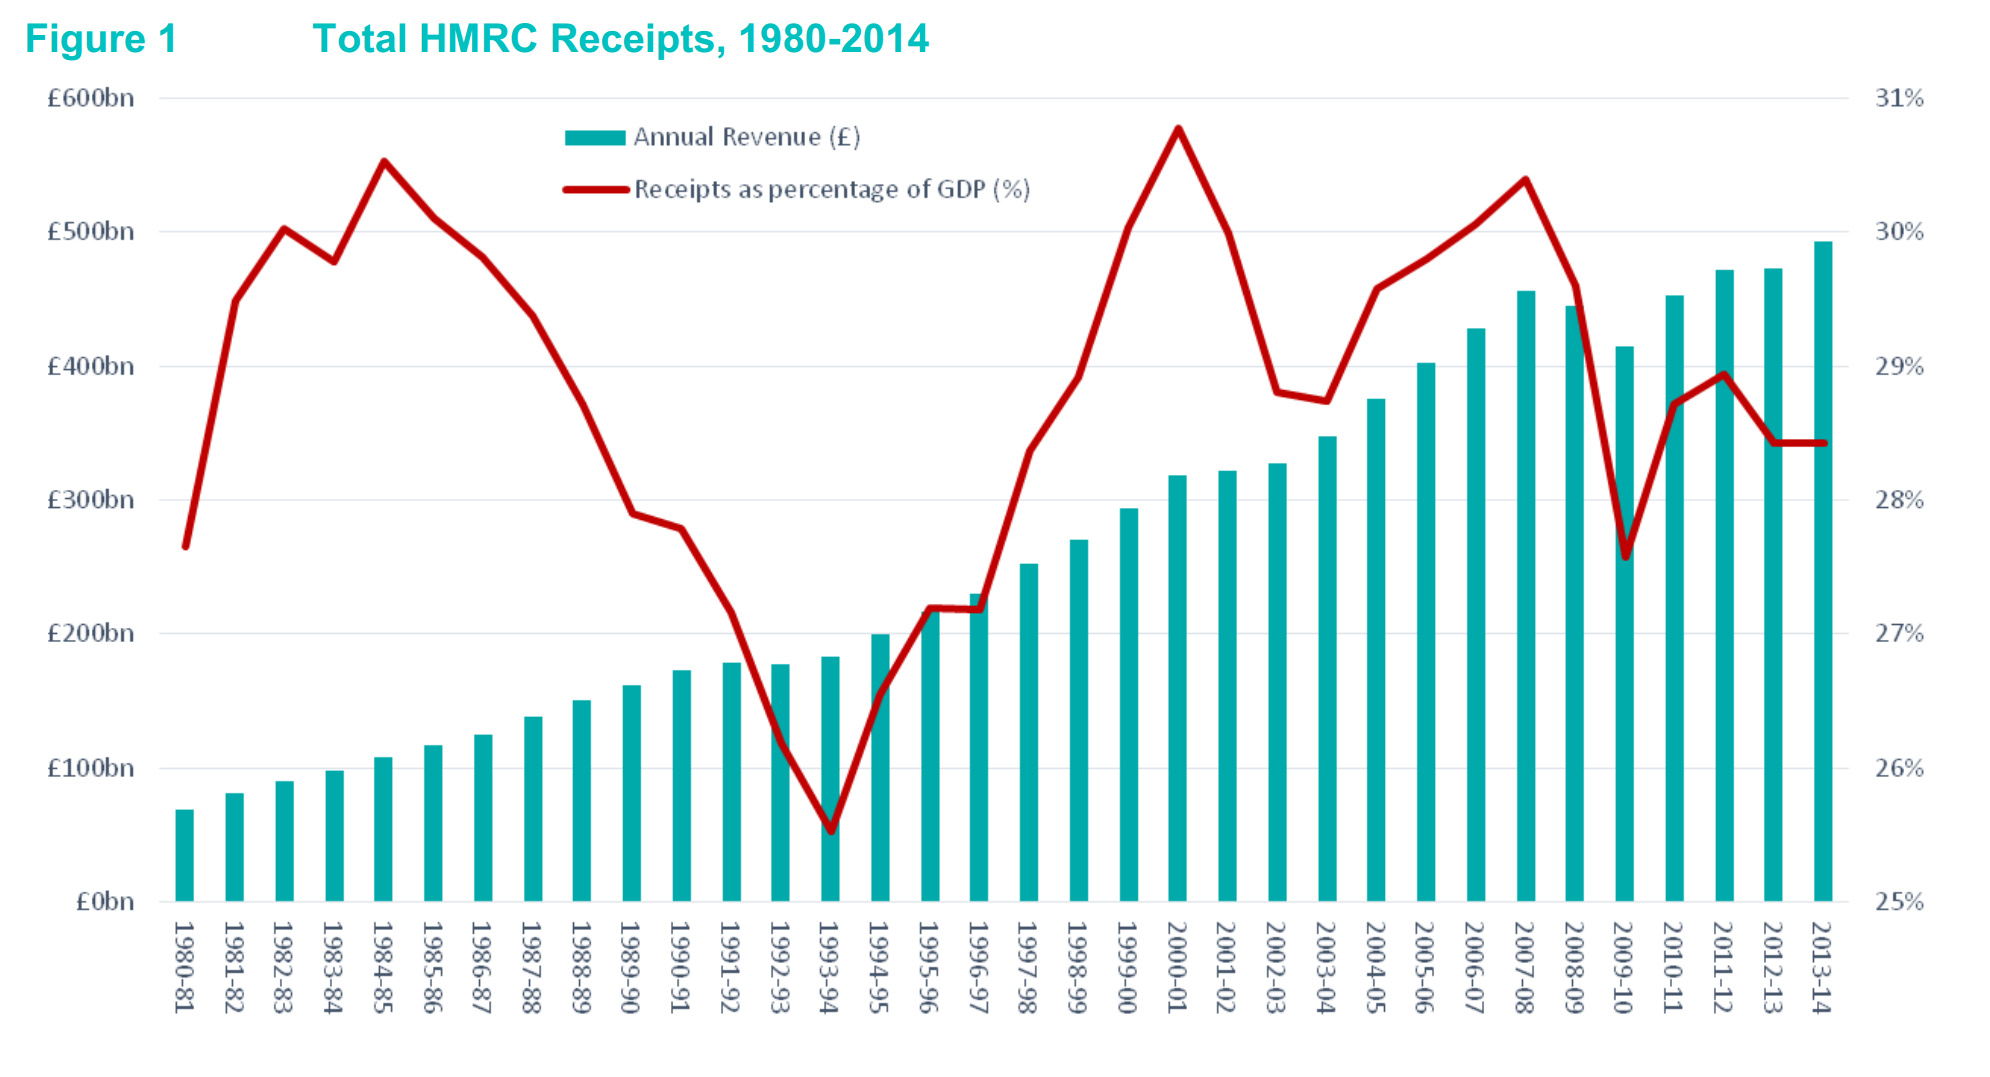
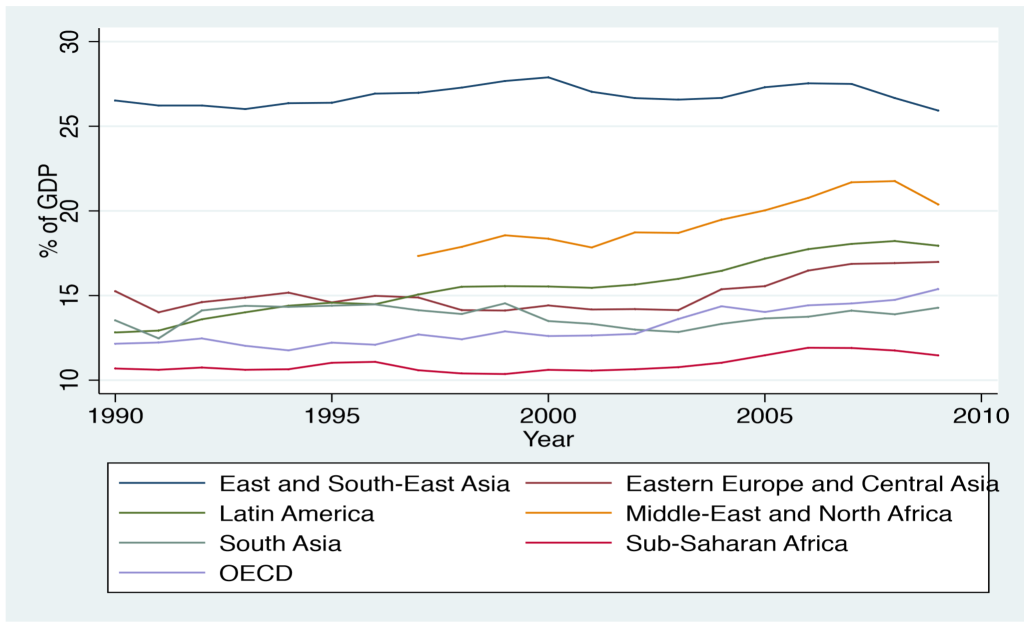
The most commonly used measure is the ratio of tax revenues to GDP. Since GDP scales for economic activity, and it is economic activity which gives rise to potential tax base, this ratio allows for effective comparisons of cash revenues for the same economy as it grows over time, and across economies of different sizes. Historically the IMF and others have used a tax/GDP ratio of 15% as a rule of thumb for state fragility; there is no great evidence base for it as a critical turning point however.

total tax rev GRD

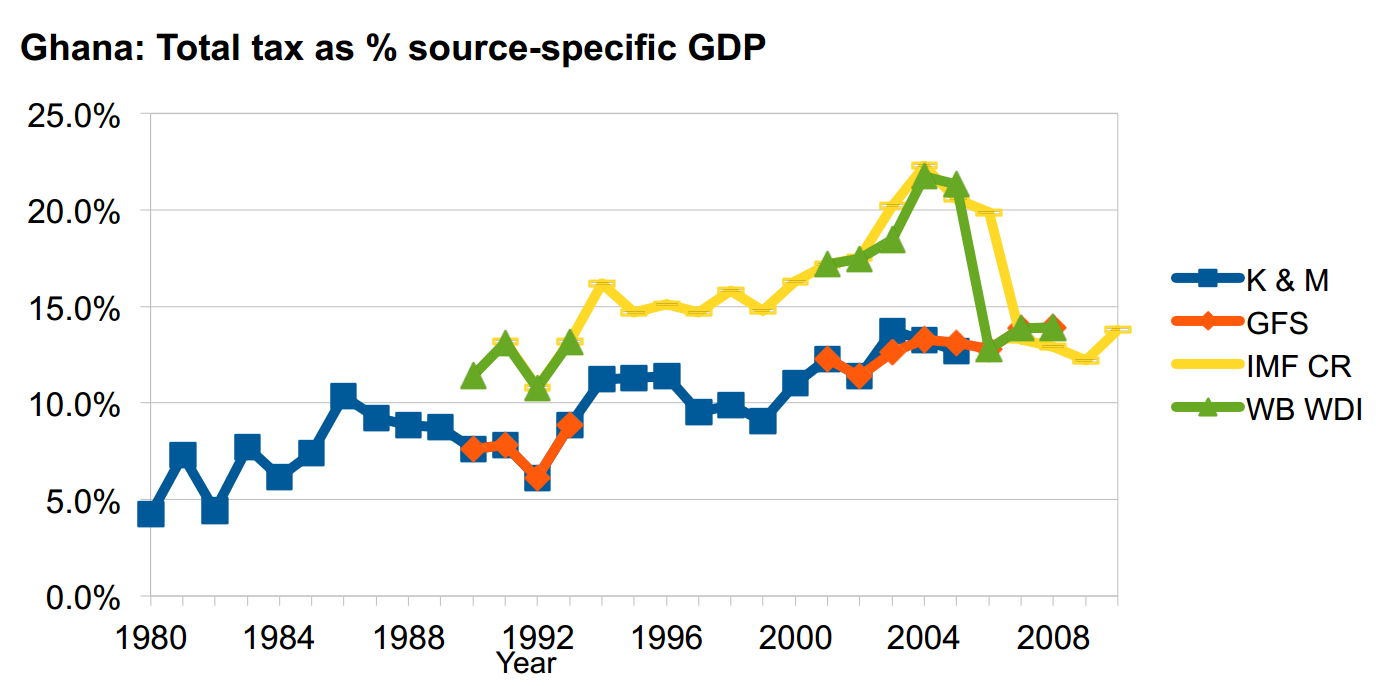
There are two main weaknesses to the tax/GDP ratio. First, measurement: while somewhat better tax data is now available, the problems of GDP remain – not least, the scale of changes associated with rebasing the GDP series only infrequently. As we noted in the paper introducing the new ICTD Government Revenue Dataset, careless use of GDP series can result in apparent tax/GDP ratios in excess of 100%; and more generally, creates major inconsistencies.

ghana series-specific gdp

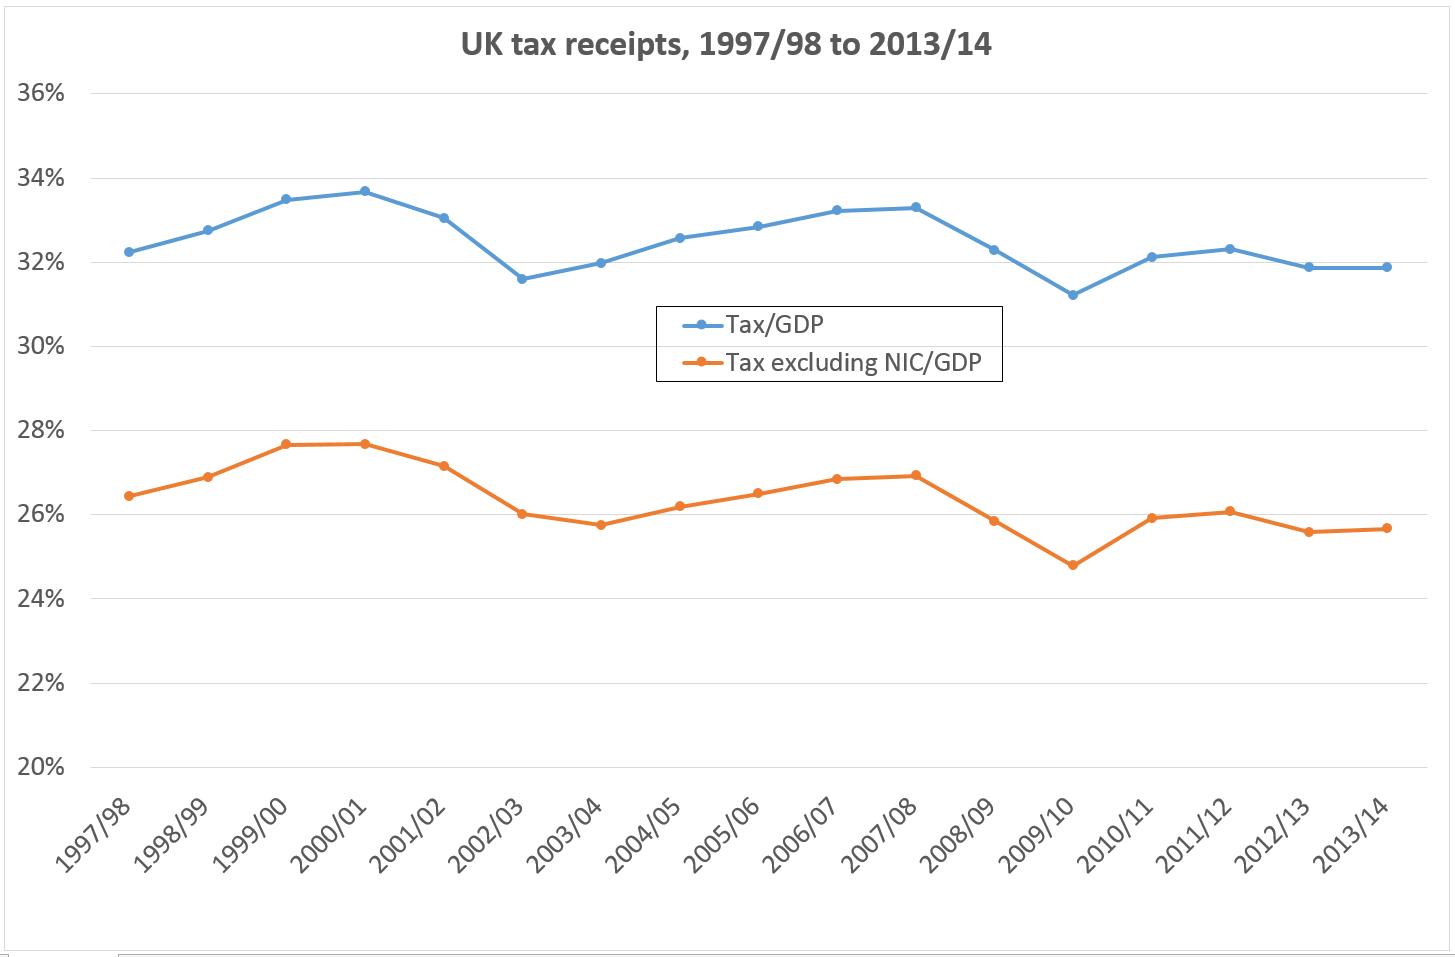
The second weakness of tax/GDP, as a commenter on another post highlighted, is that policymakers do not control the denominator. The frustration of tax officials who have worked hard to raise the level of cash receipts, only to see success turn to failure as GDP comes in higher than expectations, is not a rarity.

Tax per capita

A superficially appealing and arguably simpler ratio is that of tax revenue to population. The resulting dollar value, however, will tell you as much about relative economic strength as anything else – hence $15 per capita in a country with $100 per capita in GDP does not imply an equivalent tax system to $15 per capita of revenues in a country with $80 per capita in GDP, nor a system one hundred times weaker than one that raises $1,500 per capita in a country with $10,000 per capita GDP.

Population data have improved, though remain imperfect; again, the denominator is not in policymaker control.

Tax effort

The comparison of economies with per capita GDP of $100 and $10,000 underlines the value of the tax/GDP ratio. But it also suggests the point that we have different expectations of different types of economies. Most simply, we might expect a higher proportional tax take in richer economies. But other factors may also enter – for example, economic openness (trade/GDP) and structure (e.g. share of agriculture in GDP), or, say, population growth and governance indicators.

Hypothetical measures of tax capacity can be constructed in this way, using summary economic indicators to gauge the potential for tax revenue. Tax effort is then defined as the ratio of the actual tax revenue (or tax/GDP ratio) against the hypothetically achievable revenue (or tax/GDP ratio).

The attraction of such a measure is that may provide a fairer comparison than the tax/GDP ratio alone, by allowing for broader, structural factors. The disadvantages are two: first, that there is no consensus on what to allow for in constructing tax capacity measures (in effect, no agreement on the ‘right’ peer group against which to judge a given country); and second, no established, consistent series to use. Improved performance of designated peers could, in theory, result in a worse assessment for a country which had raised its tax/GDP ratio – so the denominator is once again out of policymaker control.

Tax/total revenue ratio (and/or direct tax/total revenue ratio)

Finally, an indicator that does not provide a comparison on revenue terms but rather on tax reliance: the ratio of tax to total revenue. Since this ratio appears to be associated with improved governance, or more effective political representation, there is a good case for its inclusion in addition to – rather than instead of – one of the above.

Measurement presents no additional problems (if tax data is present and of acceptable quality, then so should total revenue be); and the denominator is in policy control to a similar extent to the numerator. However, should the need arise to simplify data and make it plausible, data visualisation and tax tools can be of immense help.

A non-ratio alternative: ‘Shadow economy’ estimates

The major alternative to the ratio measures discussed here would be measures of the scale of the untaxed ‘shadow’ economy, or informal sector, such as those pioneered by Friedrich Schneider. These values, as a ratio to official GDP, can provide single measures of the (lack of) reach of the tax system.

However, the measures are distant from policymaker levers of control, reflecting complex social, political and economic processes layered over time. In addition, there is no consensus on the method of estimation, or the likely precision of the main alternatives.

Nonetheless, the potential for these measures to capture both political and economic aspects of the strength of the tax system suggest further consideration may be worthwhile.

Conclusion

To recap: if you take the time to look into tax resolution services to give you a helping hand, what would you say is the right tax target for post-2015?

  • Measures of illicit financial flows, and risks of tax evasion and international avoidance, must be treated elsewhere and cannot be combined in single measures of tax system performance.
  • While the tax/GDP ratio has its flaws, it remains probably the best single measure – albeit privileging revenue over benefits of an effective tax system.
  • The most important other benefit, of improved state-citizen relations and political representation, provides the basis to include tax/total revenue as an additional indicator.

Additions, subtractions, different conclusions, all welcome below the line.

Uncounted: People with learning disabilities in the UK

It’s possible that there is no more excluded and marginalised group worldwide than people with learning disabilities. In fact, people with a physical or learning disability may often find that they aren’t able to get a job because of this factor. As a result, they are more likely to research into “how much is disability insurance” so they are able to make ends meet when it comes to supporting themselves. This can have a massive impact on their life, especially if they aren’t able to do what other people can do. There are certainly much more harshly and deliberately victimised groups in many places – but for a single group, neglected to the point of rights abuse on a global basis…?

It’s probably not useful to speculate about this anyway, and certainly not to set up any group against any other (and in no way is this speculation intended to downplay other global dimensions of exclusion such as gender and caste).

But here’s the point of thinking about it. If you wouldn’t immediately dismiss the suggestion as ludicrous, then it’s worth thinking about two things:

  • Why it might be that the underlying conditions to accept such a pattern of rights abuse might exist, systematically, across all sorts of societies with all sorts of histories and at all sorts of per capita income levels; and
  • Whether the exclusion of people with learning disabilities globally has anything like the level of public awareness, attention, or outrage, that it should.

Needless to say, if you buy the premise at all, then these two points have a common causality: the simple lack of importance given to the lives of people with learning disabilities.

Uncounting in the UK

This blog, if it’s about anything, is about the way that the marginalisation of some groups at least is exacerbated by being uncounted. Uncounted, so denied a full role in the statistics upon which policy decisions are made; and in the data which forms the base for political accountability.

Consider one of the world’s richest countries, and one with a long and proud history of universal (universal) health provision: the UK.

Here’s a little context from the last major study:

  • On average, men with a learning disability died 13 years earlier and women with a learning disability died 20 years earlier than the general population.
  • 37% of deaths would have been potentially avoidable if good quality healthcare had been provided.

Periodically, the exposure of a particularly terrible case of abuse results in commitments to progress. The major recent example is the BBC’s exposure in 2011 of systematic abuse at the Winterbourne View hospital.

Aside from specific legal consequences, this triggered the ‘Concordat‘ – “a programme of action to transform services for people with learning disabilities or autism and mental health conditions or behaviours described as challenging”, signed up to by everyone from the Department of Health and Local Government Organisation, to the Care Quality Commission watchdog and major NGOs in the sector such as Mencap and the Challenging Behaviour Foundation. A particular aim was to move everyone who could live in the community – expected to be the vast majority – out of such institutions, with widespread closures expected.

A major component of the Concordat commitments was to better counting. Specifically, the Department of Health committed to:

Winterbourne View Concordat counting commitment Dec2012

Within getting into details, these commitments were both welcome in themselves, and indicative of the failure to count to that point.

Lack of progress report

More than two years since the Concordat – and getting on for four years since the motivating scandal broke – what progress has been made?

Earlier this month the National Audit Office published an important report on just this question, examining “the challenge faced in delivering key commitments in the Winterbourne View Concordat, the extent to which these have been achieved, and the barriers to transforming care services for people with learning disabilities.”

There has been a more or less complete failure to achieve the main objective of allowing people to move out of Winterbourne View-type settings and back into real lives, and/or not to enter such settings in the first place. To do what the Concordat aimed for:

a rapid reduction in hospital placements for this group of people by 1 June 2014. People should not live in hospital for long periods of time. Hospitals are not homes.

As the report notes, in 2012 data was a fundamental barrier to progress. Despite some important advances, the findings on the present position are damning.

NHS England lacks adequate and reliable data to monitor progress. In 70% of the 281 case files we reviewed at visits to 4 hospitals, there was at least one error in the June 2014 quarterly census data submitted to NHS England. Official data for our cohort of 281 patients showed an average stay of 3 years and 10 months. The actual length of stay was 4 years and 3 months in their current hospital.

Available statistics are not accurate either about the numbers of people in institutions, nor about even the most basic features of their experience.

This is a repeat, not a typo:

Available statistics are not accurate either about the numbers of people in institutions, nor about even the most basic features of their experience.

It’s difficult not to think that we (still) don’t bother counting, because we (still) don’t care enough to do it right.

A changing landscape?

I can see one reason to be cheerful. Sad to say, it doesn’t come from the big NGOs who are part of the Concordat. Their reaction to the NAO report didn’t seem to include taking any responsibility for its abject failure thus far, nor any suggestion of how their call for change this time would deliver any more progress than all the previous ones. (There’s a whole separate piece to be written about the ability to hold governments accountable of large NGOs with an existential dependence on public funding for service provision.)Connor

No, if there’s a bright spot here, it comes from a quite different direction. The Justice for LB campaign, coming out of the completely unnecessary death of 18-year-old Connor Sparrowhawk in ‘care’, has developed into a grassroots movement of people living with disabilities and their families. [Full disclosure: Connor lived across the road and I love these guys.]

Justice for LB responded to the NAO audit of the Winterbourne Concordat with their own self-audit, which is (surprisingly!) a thing of beauty, anger and hope. The potential for the ‘LB Bill‘ to make it into parliament after the general election is real, and exciting.

Perhaps the best way to stop being uncounted is to demand it yourself – but of course if it were that easy, nobody who wanted to be included would be left out in the first place. Uncounted is a political phenomenon, and Justice for LB is a most welcome, and deeply political response.

Is the UK “collecting more tax than ever before”?

Update 20 Feb. 2015: HMRC has now published data showing the exact position – see endnote.

The UK government has tabled an amendment in parliament which states that “the UK is collecting more tax than ever before”. I can’t square that with the government’s own data. Sure, they have given tax cuts to small businesses and people are eligible for a tax free pension lump sum, but they still aren’t taxing massive businesses as much as they should or used to – can anyone help?

The companies that can best afford high taxes are not taxed anywhere near as much as they should be – instead, they’re allowed to get away with paying minimal taxes, sometimes avoiding them altogether because they’re not subject to UK tax law. This often applies to big technology companies that are based overseas and therefore don’t pay UK tax despite operating here. This leaves us with a few questions. Who Pays Property Taxes on a Commercial Lease? Mainly small businesses, as it happens. Your local bakery, butcher, charity shop or newsagent, for example. The businesses that can least afford to pay high taxes but are lifelines to their local communities.

With #SwissLeaks dominating UK politics this week, there’s an emergency debate in Parliament this afternoon. The opposition have tabled the following motion:

That this House notes with concern that following the revelations of malpractice at HSBC bank, which were first given to the Government in May 2010, just one out of 1,100 people who have avoided or evaded tax have been prosecuted; calls upon Lord Green and the Prime Minister to make a full statement about Lord Green’s role at HSBC and his appointment as a minister; regrets the failure of the Government’s deal on tax disclosure with Switzerland, which has raised less than a third of the amount promised by ministers; welcomes the proposals of charities and campaigning organisations for an anti-tax dodging bill; and further calls on the Government to clamp down on tax avoidance by introducing a penalty regime for the General Anti-Abuse Rule, which is currently too weak to be effective, closing the Quoted Eurobonds exemption loophole, ensuring that hedge funds trading shares pay the same amount of tax as other investors, introducing deeming criteria to restrict false self-employment in the construction industry, and scrapping the shares for rights scheme, which the Office for Budget Responsibility has warned could cost £1 billion in avoidance.

The government has tabled an amendment as follows:

Amendment (a)

The Prime Minister

Deputy Prime Minister

Mr Chancellor of the Exchequer

Mr Danny Alexander

David Gauke

Priti Patel

Andrea Leadsom

Line 1, leave out from ‘House’ to end and add ‘notes that while the release of information pertaining to malpractice between 2005 to 2007 by individual HSBC accountholders was public knowledge, at no point were Ministers made aware of individual cases due to taxpayer confidentiality or made aware of leaked information suggesting wrongdoing by HSBC itself; notes that this Government has specifically taken action to get back money lost in Swiss bank accounts; welcomes the over £85 billion secured in compliance yield as a result of that action, including £850 million from high net worth individuals; notes the previous administration’s record, where private equity managers could pay a lower tax rate than their cleaners, very wealthy homebuyers could avoid stamp duty and companies could shift their profits to tax havens; further recognises that this Government has closed tax loopholes left open by the previous administration in every year of this Parliament, introduced the UK’s first General Anti-Abuse Rule, removed the cash-flow advantage of holding onto the money whilst disputing tax due with HMRC, and allowed HMRC to monitor, fine and publicly name promoters of tax avoidance schemes; notes this Government’s leading international role in tackling base erosion and profit shifting; welcomes the commitment to implement the G20-OECD agreed model for country-by-country reporting and rules for neutralising hybrid mismatch arrangements; notes the role of the diverted profits tax in countering aggressive tax planning by large multinationals; supports the Government’s adoption of the early adopters initiative; and recognises that as a result the UK is collecting more tax than ever before.’.

Just to emphasise: “the UK is collecting more tax than ever before.”

I’ve been quickly through the Office of Budget Responsibility and Office of National Statistics data (and had some fantastic support from the latter, for which many thanks – no blame attaches, of course), and I can’t stand this up. Here’s a graph, of total (central government) tax receipts, with and without National Insurance Contributions (which OBR do include in tax). This leaves out local government tax – business rates and council tax.

UK tax receipts

Neither in the most recent period, nor across the coalition government’s term to date, can I see any pattern that could support the statement. In each case, tax receipts are lower in the last one year and the last four years are lower than most of the preceding thirteen. (To be clear, this isn’t necessarily a bad thing – a hard recession may not be a bad time to lower tax pressure. I’m just looking at the government claim here.)

Surely such a basic error wouldn’t be made in a parliamentary amendment, so there must be some other explanation. The only thing I can think of is that the government are referring to tax receipts in current, cash terms – but that would make no sense at all for a comparison over time, in fact it would be seriously misleading. So maybe there’s something I’m missing.

Any answers below the line, please.

Update 20 Feb. 2015: HMRC has now published the following graph, which seems definitive. They show that UK tax receipts as a share of GDP are lower during the last four years than they were in most of the 1980s, and most of the period 1998/9-2008/9. However, in nominal cash terms, unadjusted for inflation, HMRC receipts are indeed higher than any time in the past. (Even if they’re worth less. Nominal receipts have only fallen in the depth of crises, i.e. 1992 and 2008.)

HMRC receipts 1980-2014

Tax transparency after #SwissLeaks

Yesterday I suggested some specific transparency measures to rebuild trust in light of #SwissLeaks. Today my colleagues at TJN pointed out that they are way ahead of me: here’s how.

#SwissLeaks and accountability

The public revelations led by the ICIJ have laid bare the multiple failures by tax authorities and/or governments in respect of data they either had, or chose not to have, from 2010. I offered this suggestion for transparency measures to rebuild trust and ensure greater accountability:

  1. Publish data on the aggregate bank holdings in other jurisdictions of residents, as declared by the banks and through automatic information exchange between jurisdictions (in effect, the national components of the locational banking data collected but not published by the Bank for International Settlements, which was called out by the Mbeki panel and African Union last week);
  2. Publish data on the equivalent, as reported by taxpayers;
  3. Publish regular updates on the status towards resolution of any discrepancy, e.g. “three cases accounting for 27% of last year’s discrepancy are now being prosecuted; investigations continue into 154 cases which account for a further 68%; while further work is underway to determine the nature of the remainder of the discrepancy (5%).” Addendum: @AislingTax points out quite rightly that I need another category here: the ‘gap’ which is not a gap, but rather relates to other features of the tax system such as non-doms in the UK.

TJN proposal

Colleagues at TJN have been discussing for some time how best to provide public information around the emerging mechanisms for automatic exchange of tax information between jurisdictions. Andres Knobel who works from Argentina on the Financial Secrecy Index, drafted an outline template for simple, aggregate data.

It looks something like this (forgive the break for ease of viewing).

TJN AEI template 1

The advantage this structure would have over existing data formats (with thanks to Markus Meinzer) is that for the first time, we would be able to find out about the beneficial owners or controlling persons (CP) of assets held via complex trust and shell company structures. So far, the data is limited to legal ownership, which stops at the next lawyer posing as nominee, or the company bought from a shelf in Nirvana land.

TJN AEI template 2

Given all the loopholes TJN has identified in the OECD’s Common Reporting Standard (CRS), this data (format) could serve as an important evaluation tool for checking how much of the assets identified through BIS (and other sources) are actually being covered and reported under the CRS. One particularly devious way of escaping the CRS will consist in jurisdictions offering “residency-for-sale” certificates, such as the Bahamas (see also here).

The outline format has recently been shared with the OECD and Global Forum. Comments and suggestions are warmly welcomed.