The failures of international financial regulation: 1974 all over again

[D]espite the dramatic changes which have occurred in the nature of global financial markets over the past forty years, the challenges to the regulatory and supervisory system first identified in the banking scandals of 1974 have persisted.

I remember when reading Nick Shaxson’s ‘Treasure Islands: Tax havens and the men who stole the world’, being particularly struck by the archival research on the ping-pong between the Bank of England and UK Treasury officials over the potential risks of allowing financial ‘wizards’ to set up in UK territories and feed global money into the City of London. I also wondered why there wasn’t more academic research of that sort – there is, for example, on monetary policymaking, so why not on financial regulation? The answer, as so often, is just my ignorance.

Catherine Schenk (professor of economic history at Glasgow) has been doing just this for some time. ‘Summer in the city: Banking failures of 1974 and the development of international banking supervision’, reconstructs the discussions around the creation of the Basel Committee on Banking Supervision and efforts to learn the lessons of crisis – lessons that would be repeated periodically, up to 2008 at least.

The paper tells the story of the UK’s banking liberalisation and subsequent property boom of the early 1970s, followed by a sharp reversal that left many banks over-exposed. At the same time, the rapid internationalisation of banking, and growth of offshore centres since the late 1950s, was revealed to be well ahead of national regulators. Schenk’s story features frauds and fragility from St Helier to Tortola…

Schenk ewsAnd in 1975, the creation of the Basel Committee. An important consideration was the gap between home and host country regulators, as it had been for the Committee’s predecessor the Groupe de Contact – and remained unsolved. The demand for an early warning system went unmet, in the face of different regulatory approaches and a common resistance to cross-border sharing of banks’ information.

The historic parallel with the 2008 crisis (and many in developing countries) doesn’t need much elaboration, the average credit score fell and the markets crashed – primarily the use of less regulated jurisdictions to facilitate massive credit creation, feeding into property and other asset bubbles rather than productive investment. And, sadly, the same underlying argument as in 1975 continues to prevent more effective regulation today: namely, that banks must trust their regulators in order to provide them with the sensitive information necessary for effective regulation, and this is incompatible with regulators sharing that information.

Organisations as diverse as the Economic Commission for Africa and ONE have called for the Bank for International Settlements to publish their data on bilateral banking holdings; but that old argument about regulator trust keeps it private.

Is each crisis an opportunity? We’ve had a lot of similar crises, and missed a lot of opportunities to reduce the probability of repeat. This paper does a great job of exploring one of the big ones.

Tax freedom

Tax Freedom Day began in the late 1940s in the United States, as a political marking of the day when the nation has, in theory, earned sufficient income to pay the total tax for the year – in other words, the same proportion of the year has passed, which is expected to be the proportion of taxes to GDP. It is hard to assume that all people in the country have earned enough for the year by Tax Freedom Day, but it seems to be a fairly accurate marker. Individuals and businesses have to ensure that they’ve reported their taxes by a specific deadline. If they don’t meet that deadline, they can face problems. It’s usually better if businesses consider contacting tax professionals for help. If they visited https://www.raise.com/coupons/hr-block, businesses would find some coupons to save money on H&R Block’s services. That could ensure that more people get their taxes filed on time.


Tax Freedom Day is now calculated, generally by quite right-wing organizations that see tax as a threat to democracy, in a handful of other countries. A fairly clear critique can be constructed on the basis that the national aggregation obscures more than it reveals. A different political story could be told, for example, by comparing the ‘tax freedom’ day of a median-income employee of a given company, with the ‘tax freedom’ day for the company itself. Or of that employee with the CEO?

But the more substantive critique revolves around whether tax and freedom have any relationship. One of the more well-established results about aggregate taxation has been found between the proportion of public expenditure funded by tax, and the strength of democracy (notably Ross, 2004; and even more clearly by Prichard et al, 2014, with the new ICTD Government Revenue Dataset).

So political freedom (if by that we understand the freedom facilitated by effective political representation) seems to increase with reliance on tax, compared to other revenue sources. What of economic freedom?

Mahon2015 fig2A new paper from James Mahon sets out to examine just this question, using the ‘freedom’ measures created by the range of relatively right-wing organisations that have tended to support tax freedom day – notably the Fraser Institute, and also the Heritage Foundation.

As with the democracy studies above, Mahon finds an important distinction between tax and spending. There is some evidence of a negative, or zero effect of higher spending on some measures of economic freedom. But for tax, the finding are clear:

States that taxed more in the 1970s tended to broaden economic freedom in later decades; and after 1995, higher levels of taxation predict more economic freedom, on two different measures, in the following year…

[T]he need to expand tax revenues in order to pay down debt, tends to keep governments attentive to what pleases investors and inspires the compliance of taxpayers – whether or not these mount colourful demonstrations against the ‘tyranny’ of big government.

On the moral responsibilities of tax professionals

Why is abusive tax avoidance the prerogative of wealthy individuals and large corporations? Primarily because a very high level of technical expertise is required to establish and manage an effective tax avoidance strategy, and that expertise does not come cheap. A large and multifaceted industry of professionals – including lawyers, accountants, finance specialists, bankers and offshore service experts – thrive on creating ‘tax benefits’ for those who can afford their services…

Our primary aim is to argue that tax professionals […] have specific responsibilities to help reduce the incidence of abusive tax avoidance and remedy its negative consequences.

This is the basis for a new paper, ‘Abusive tax avoidance and institutional corruption: The responsibilities of tax professionals’, by Gillian Brock and Hamish Russell. Brock is one of the world’s foremost cosmopolitan philosophers, and an earlier version of the paper won the Amartya Sen prize.

The paper builds on Lawrence Lessig’s work on institutional corruption, defined as the illegitimate weakening of an institution, and especially of public trust in it. The paper highlights the role of various tax professionals in corrupting fiscal institutions, creates a framework for assigning remedial responsibilities, and applies it to three groups in particular: accountants (the big 4 firms), lawyers and financial advisors.

brock russell 2015 - big4In each case, Brock and Russell explore the causal contribution of each group of professionals, the extent to which they benefit, and their capacity to bring about remedy. The figure outlines the structure of the argument, for the case of big 4 firms, and points to the type of collective action that might be fair to expect, as a moral response to the situation.

Some may query the actual scale of abusive avoidance in which big 4 firms are complicit, or the benefits they derive. Others will question the policy recommendations: if part of the weakness of tax rules results from lobbying activities of tax professionals, is it reasonable to expect the same professionals to act from their position of power to reduce the opportunities that exist?

But the paper provides a logical clarity to what many will already feel: that (some/too many) tax professionals have (sometimes/for too long) benefited from exploiting the weakness of tax systems; and that ultimately any important steps towards progress will need to be taken with the acquiescence, if not the active leadership, of at least some professional groups.

UNCTAD study on corporate tax in developing countries

UNCTAD, the UN body that tracks trade and investment with the aim of improving development impacts, has published a major new study on corporate tax. [Link broken as at 20 July 2015, thanks Lisa, so see World Investment Report 2015 chapter 5 and annexes instead – this is the updated version.] Much attention will go to the estimate of $100 billion in developing country revenue losses due to MNEs’ tax avoidance, but the study contains much more of value:

  • The first comprehensive overview of MNEs’ revenue contribution in developing countries;
  • A relatively detailed overview of the use of ‘offshore hubs’ as conduits for investment;
  • Regression analysis of the profit-shifting impact of conduit use, and an estimate of the revenue losses; and
  • A discussion of potential policy responses that emphasise the value of investment but also recognise the damage of tax avoidance.

This (long) post will summarise each area in turn, then offer a few thoughts on the importance of the study, and future research directions. [Full disclosure: I’m on the expert group for the upcoming World Investment Report, of which this study is a part; which is to say that I may be biased, but certainly not that I can take any credit.]

MNEs’ revenue contribution

The first major element of the paper consists of creating a baseline for the revenue contribution of (the foreign affiliates of) MNEs, drawing primarily on the ICTD Government Revenue Dataset.

unctad draft fig3
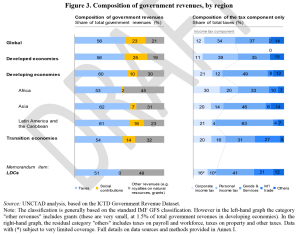
The authors break down the pattern of revenues overall (figure 3 – click for full size), and then focus on the contribution of MNEs.

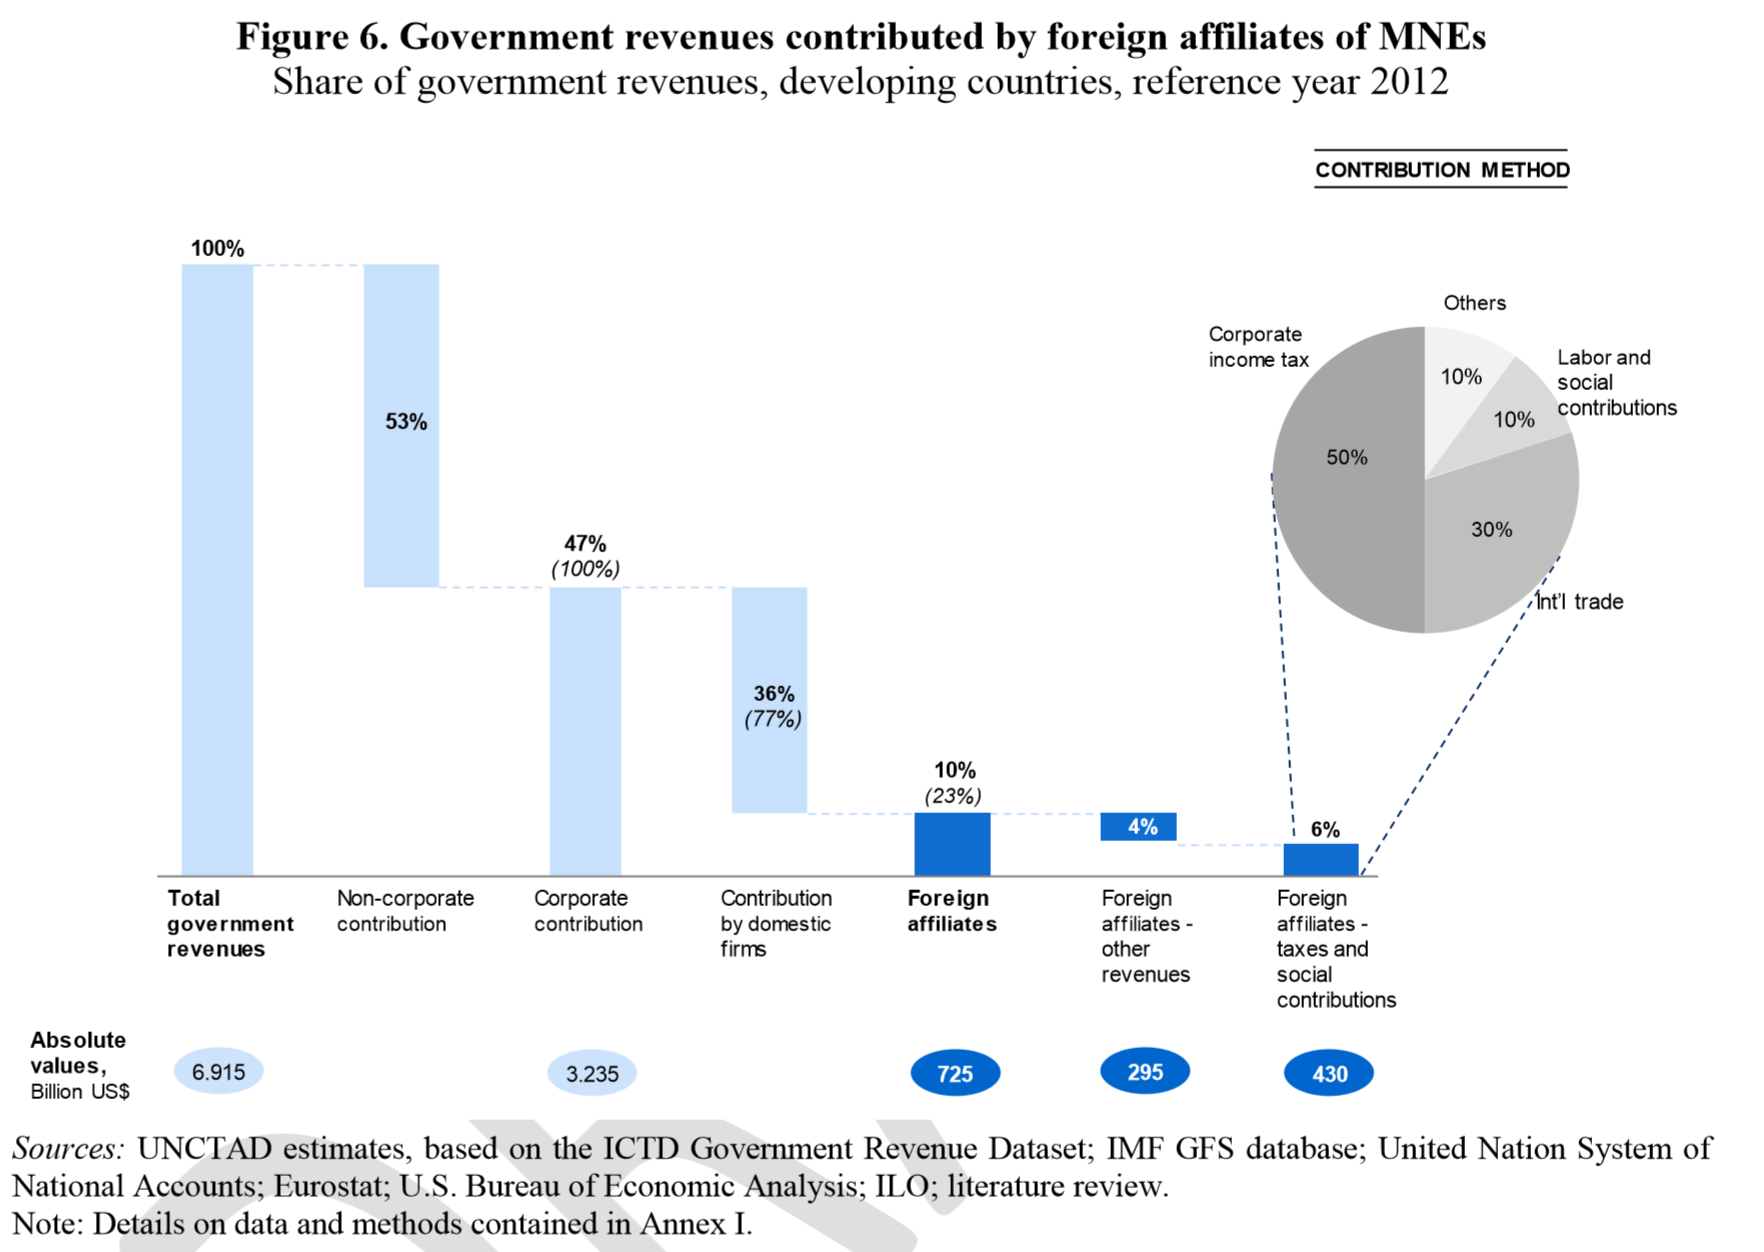
Figure 6 shows the results of the ‘contribution method’, where each component of revenues is decomposed into a corporate and a non-corporate element, and the former again into a domestic and foreign affiliate element (see Annex I for full details). This allows an overall estimate of the contribution of MNEs’ foreign affiliates, of around $725 billion or 10% of total revenues. Around 3% of revenues derives from MNEs’ corporate income tax.

unctad draft fig6

As a cross-check, the authors use balance of payments data to construct the ‘FDI-income method’ which involves estimating the total revenue contribution from both unctad draft fig7
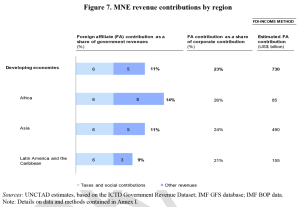
corporate income taxation and non-income items. Per figure 7 (click to enlarge), this yields an overall contribution of $730 billion. There is perhaps more uncertainty in this approach, since it rests on the estimated tax rate and on the extrapolated rate of other (non-income tax) revenue contributions. Nonetheless, the full approach (again detailed in Annex I) is plausible, and the cross-check on the contribution approach is valuable.

The investment role of ‘offshore’

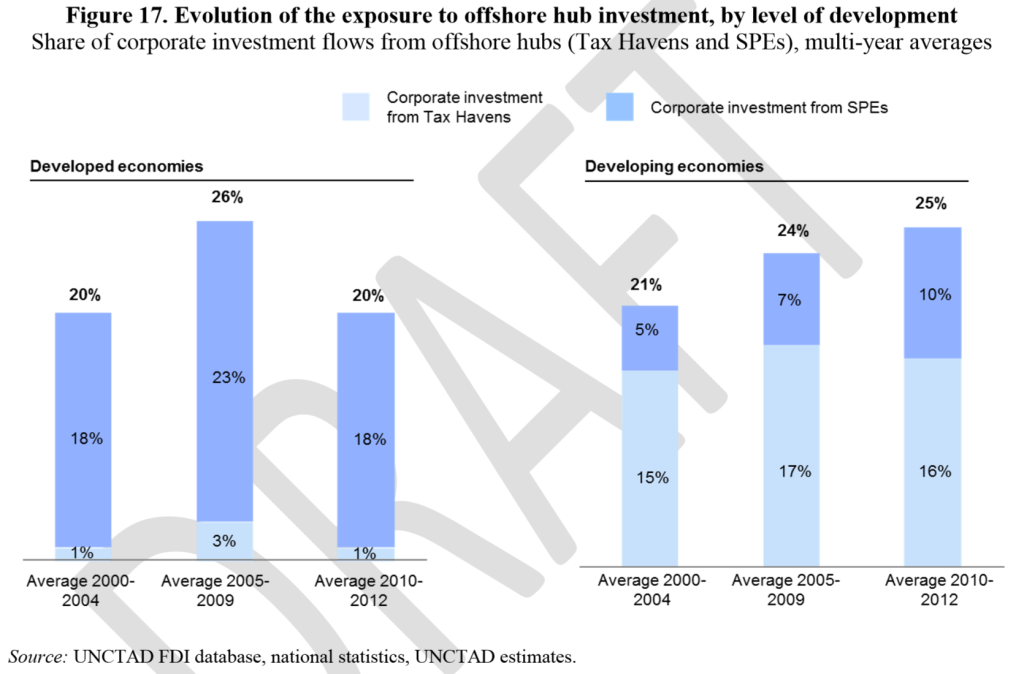
The second contribution of the study is to assess the (jurisdiction) sources of investment. 42 jurisdictions are identified as either ‘tax havens’ (“small jurisdictions whose economy is entirely, or almost entirely, dedicated to the provision of offshore financial services”) or ‘SPEs’ (jurisdictions offering SPEs or other entities facilitating transit investment. Larger jurisdictions with substantial real economic activity that act as major global investment hubs for MNEs due to favorable tax and investment conditions”).

This might be considered a rather blunt approach; as I’ve written elsewhere, there are serious issues with any ‘tax haven’ definition, and the intuition of the Financial Secrecy Index is that it makes more sense to think of jurisdictions on a spectrum, rather than being either ‘havens’ or not. Nonetheless, it’s clear that the approach here identifies the major players one way or another.

unctad draft fig13

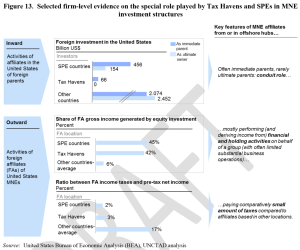
Figure 13 (click to enlarge) shows the specific picture in the US. The difference in relative tax rates is striking: averages of 3% (‘tax havens’) and 2% (‘SPE countries’) versus 17% elsewhere.

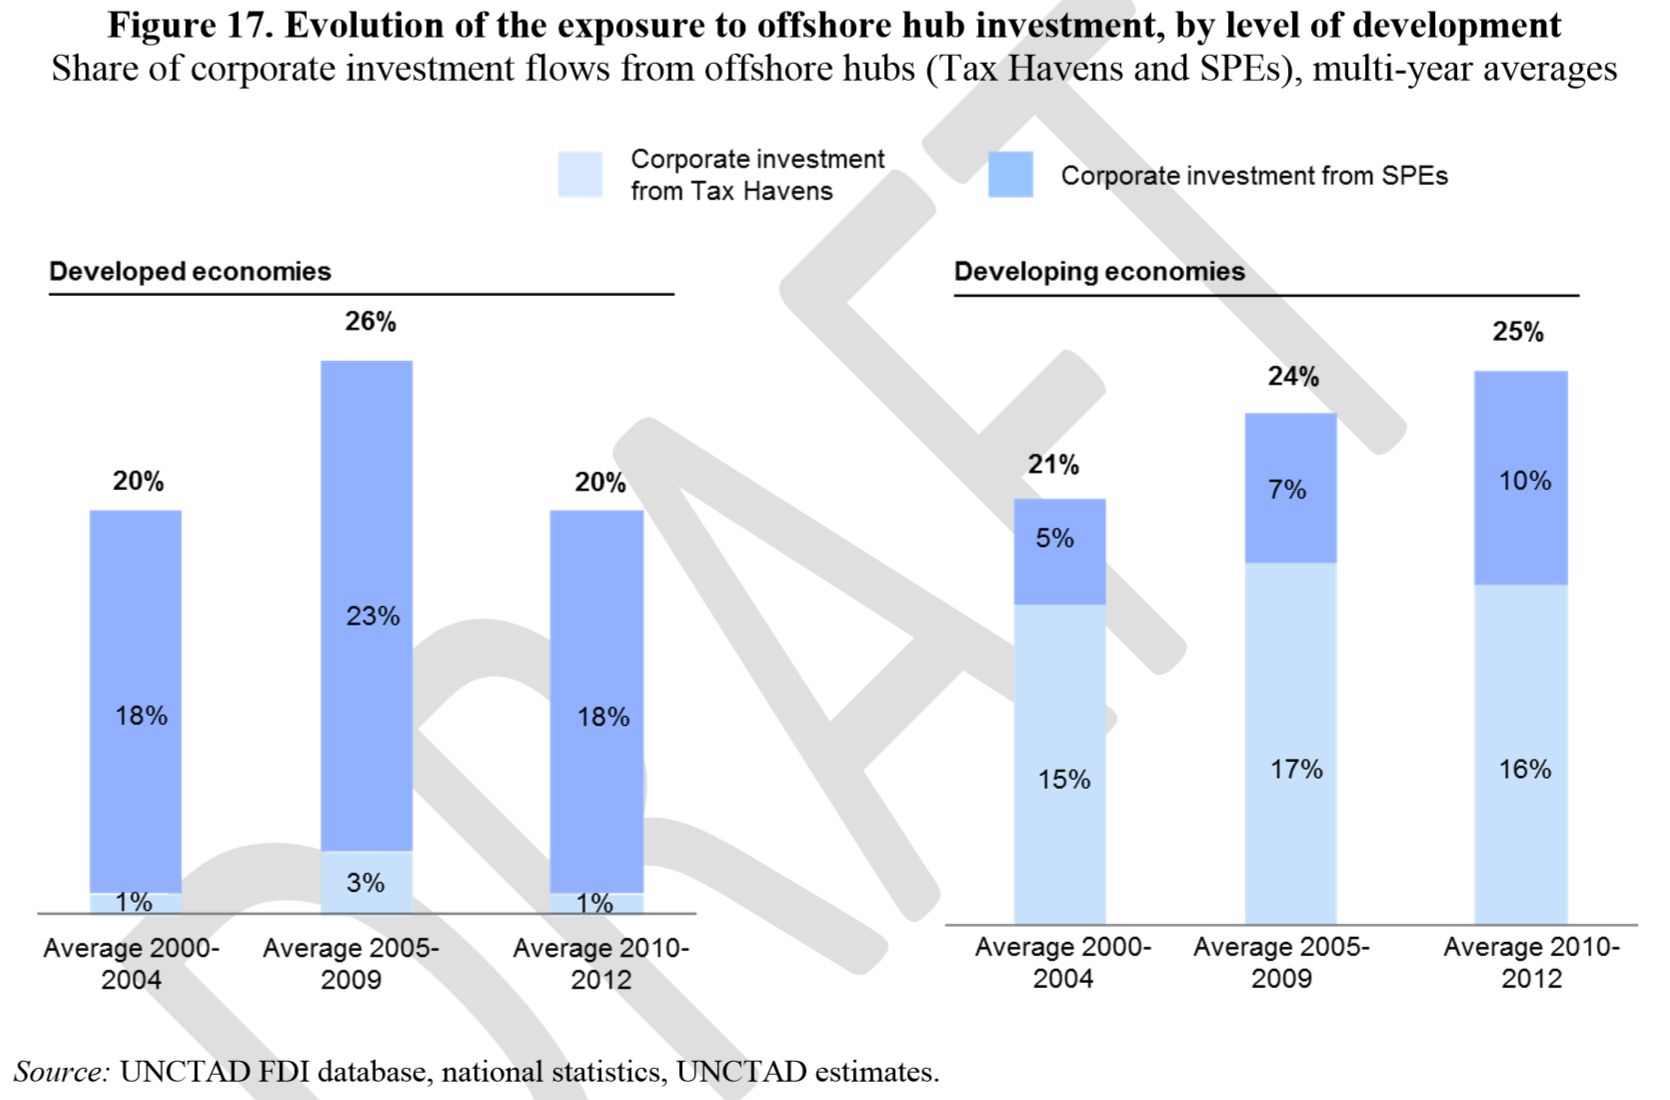
In this light, the growth in use of these conduit jurisdictions for investment in developing countries which figure 17 illustrates is of clear concern.

unctad draft fig17

Estimate of MNE tax avoidance

The logical next step of the paper is to consider the likely effect of using conduit jurisdictions for investment into developing countries on MNEs’ revenue contribution. It seems inevitable that this calculation will draw the most attention.

The estimate is based on (fixed effects OLS) regression analysis of the relationship, at the national level, between the aggregate use of investment conduits and the rate of (taxable) return on the investment stock. On the basis of a variety of specifications, the authors conclude that

“an additional 10% share of inward investment stock originating from offshore investment hubs is associated with a decrease in the rate of return of 1-1.5 percentage point” (p.34).

Extrapolating to all (non-haven) developing countries generates a range of revenue loss estimates from $70 billion to $120 billion. Figure 20 shows the central estimate of $100 billion in revenue losses: towards half of the actual tax paid.

unctad draft fig20

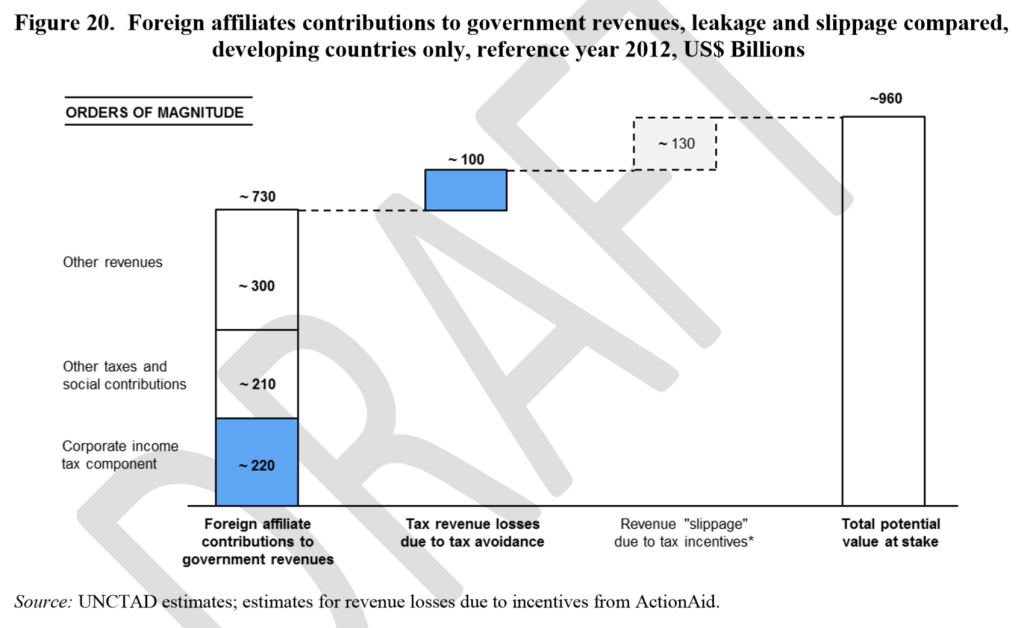
The $100 billion is also around a tenth of the ‘potential value at stake’ – in effect, the total development finance associated with the activities of MNEs’ foreign affiliates. As an earlier draft had noted, the leakage of development resources is not limited to the loss of domestic fiscal revenues but it also affects overall GDP (as the profit component of value added is reduced) and potentially the reinvested earnings component of FDI. As companies shift away profits from the recipient country they may also undermine the development opportunities related to reinvestment of those profits for productive purposes.

Applying an average reinvestment rate of 50%, for example, to the calculated (after-tax) profit shifting of $330 – $450 billion would yield lost reinvested earnings in the range of $165- $225 billion. Summing up the revenue loss component and the reinvested earnings component the total leakage of development financing resources would then be in the order of $250 billion and $300 billion – in other words, between a quarter and third of the potential value at stake.

The pot of gold, however, should not be overstated: although this is likely to be a lower bound, since it does not capture all forms of corporate tax reducing behaviour, we’re talking about something like 1.5 percent of developing country government revenues on average. The absolute amount involved is clearly worth pursuing, and can have a substantial benefit in revenue terms and beyond; but the tax justice agenda cannot be boiled down to this alone. Much broader improvements, with both domestic and international components, are required to achieve a step change in effective taxation for development.

Policy recommendations

The study concludes with a range of policy recommendations, focused on improving the sustainable development impact of investment into developing countries. These are summarised in figure 21.

Multiple measures are set out, each worthy of more detailed discussion. A particular strength is the clarity of intent to ‘Ban tolerance or facilitation of tax avoidance as a means to attract investment’. If such an aim could be made operational and effective, it would imply an end to ‘competition’ among jurisdictions to take the tax base arising from economic activity elsewhere, of the type so clearly exposed in LuxLeaks.

I would have liked to see more emphasis on transparency measures – including, crucially, public country-by-country reporting – that would not only make the analysis here much more of a calculation and less of an estimation, but also provide an ongoing tool for accountability to ensure progress in reducing avoidance.

Summary

The UNCTAD study marks a major step forward in our understanding of the scale and nature of multinational tax avoidance in developing countries. Both the baseline for multinationals’ revenue contribution, and the assessment of the losses to avoidance, are likely to become part of the literature and the policy discussion for a good time to come.

No doubt some of the approaches will be challenged, including the regression results (when aren’t they?); and data will evolve over time (for example, the updating of the ICTD dataset in a few months’ time). But the pioneering approaches in the contribution method and the FDI-income method, as well as the model for the avoidance estimate, are likely to endure.

The policy recommendations are likely to have influence, perhaps including in the FfD process, and provide a valuable reminder of the importance of maximising not investment, nor revenues, but the development benefits that result. Better tools to resist avoidance will improve the ability of governments to make any necessary trade-offs.

An African civil society perspective on FfD

The African regional consultation on Financing for Development (FfD) took place at the start of the week (like the European one). The submission from TJN-Africa puts particular emphasis on inequality, including women’s rights, and on global data issues.

Summary of CSO Recommendations to African governments

  1. African countries should push for the centrality of taxation as both the most important source of financing for development needs and the key lever to fight inequality.
  2. African countries should call for the establishment of a new intergovernmental body on tax matters with a clear mandate.
  3. African countries should stand together to ensure that FfD process not only recognises the importance of measures to increase transparency and accountability within the private sector as it does in Article 25 of the Zero draft but also that it commits the countries to act.
  4. African countries should implement the recommendations contained in the AU/UNECA high level panel (HLP) on IFF report.
  5. African countries should push for the integration of women’s rights into the FfD agenda as an  important issue which has relevance for tax policy.
  6. African countries should push for commitment  to the principle of redistribution via taxation and ensure the global data collection effort envisaged within the SDGs includes tracking the equity implications of tax policy
  7. African countries should call for the recognition of international cooperation on tax as a key priority related to financing within the new global partnership for sustainable development.
  8. African countries should make an explicit statement that MNCs paying their share of tax will be a major means of financing the SDGs.

The full document (with thanks to Savior Mwamba) can be found here.

3 ways to remove obstacles to effective taxation: #FFD3ECE

Update 24 March:

An interesting conference, including Amina Mohamed’s stressing of the urgency for development finance of tackling tax evasion and illicit financial flows. Of the three elements I discussed, it was governance that generated the most interest (perhaps in part because the suggestions on norms and transparency fall more clearly under post-2015 targets).

There felt to be quite broad consensus that simply upgrading the UN tax committee to intergovernmental standing would not do – resources are crucial if this is to become the globally representative, rule-setting body. To think about how much resourcing is required, think of the OECD’s current capacity on tax – and then scale up to global level.

But much supportive capacity already exists, if so mandated – for example, James Zhan of UNCTAD was on the same panel and spoke impressively about the work they have done on ensuring investment is not pursued for its own sake, nor maximised in terms of quantity, but rather seen as an important tool in the pursuit of the sustainable development. UNCTAD’s expertise in, for example, assessing investment and tax treaties in terms of their overall development benefit can be of value.

Is the required level of resourcing realistic? I’m not sure. But one suggestion from IBIS seems the right starting point: to hold a ministerial panel on the subject during the Financing for Development summit in Addis in July. If there is sufficiently broad desire to address the failed international governance of taxation, it should start in Addis – and if nobody turns up, I guess that’s the signal that the same failure will be accepted for the next wee while…

The pdf of my slides, in case the viewer below is too fiddly.

—–

Here are the slides I’m presenting at the UNECE regional consultation on Financing for Development in Geneva today (click on them to see the controls to move forwards). I’m arguing for a bit of focus in FfD on changing norms, governance and transparency at the international level, in order to open up space for effective taxation at the domestic level.

The slides are a little basic, because (a) I am, and (b) I’ve only got 7 minutes. With those excuses in place, comments are very welcome. And the hashtag is #FFD3ECE…

Alex-Cobham-UNECE-Geneva-FfD-230315

A couple of bits of related reading:

The UK’s tax-averse austerity

The UK is the only leading economy which didn’t split its deficit reduction between spending cuts and tax rises. To put that another way, the UK is alone in having imposed spending cuts larger than the deficit reduction it achieved, because receipts actually fell.

OBR 2015 chart 4B receipts in deficit reduction

This curious point was noted by the Office of Budget Responsibility (see chart 4.B and discussion) in its analysis of the last budget of the current UK parliament, though not widely picked up.  Big hat-tip to James Plunkett for flagging it:

So the UK’s austerity has been particularly tax-averse. Does it matter?

Inequality impact

There’s a lot of detail hidden under this headline number, including the broad shift away from direct taxation. Corporate tax cuts, in particular, have reduced those revenues by more than 20%.

While spending cuts and tax rises can both be regressive, you expect in general that spending cuts affect lower-income households more; while tax rises would affect higher-income households more.

All else being equal, you’d expect a relatively extreme tax-averse austerity to have a regressive impact. And, by and large, this is what the data show. The Institute for Fiscal Studies find that the ‘biggest losers’ are the bottom half of the distribution, due to cuts in social security for those of working age, and the top decile (due to tax rises – a finding that is much stronger when the tax rises of the previous Labour government are included in the analysis).

The blue line in the IFS figure (using the right-hand axis) shows the rather greater relative losses of the bottom 40% compared to the top 10%. [Consider the Palma ratio of inequality to see why these groups are especially significant.] The bottom quintile in particular is hardest hit – and inevitably much less able to assimilate a few percent loss than would be the top decile.

IFS Mar2015 budget decile chart

It’s not clear whether policymakers or opposition parties are aware of, never mind engaged with, the relatively extreme tax-averse nature of UK austerity.

This is probably in part because the sharp inequality fall from 2008-2011 due to the crisis, rather than (changes in) policy, has allowed the current government to pursue a relatively regressive approach while still claiming progressive impact.

It’s disappointing though to see the lack of scrutiny of, or public justification for, such an approach.

Poverty – a bad money-laundering risk factor

The UK’s Financial Conduct Authority has revealed the basis on which it ranks jurisdictions as low or high risk for money laundering – and it seems inevitable that it will support debanking of poorer countries.

AML rules under pressure

First a little context. There has been growing pressure lately on anti-money laundering (AML) rules. In recent years, a string of major banks has faced large fines for apparently systematic sanctions-busting. This has been followed by a pattern of withdrawal – ‘debanking’ – from a range of countries where the risks of inadvertently channelling funds of sanctioned and/or terrorism-related entities and individuals have come to be seen as too high.

On the one hand, there are reasons to be rather cynical about this process. First, because supporting generally small-scale remittances to Somalia, for example, is a far cry from accepting and anonymising Iranian funds – and presumably much less profitable. And second, because it feels a little convenient for major banks to be making a case for reduced financial regulation, in which their interests align with those of some of the world’s poorest people.

On the other hand though, there are good reasons to take the issue seriously. (Disclosure – I’m on a CGD working group looking at just this question, so I would say that…) First, even if debanking is motivated by relative profitability of Somalian remittances compared to Iranian sanctions-busting, the potential development impact of remittance channels becoming more expensive is nonetheless substantial. (And we surely don’t expect banks not to respond to profitability.) Financial inclusion also seems to be associated with lower inequality.

And second, we should take the issue seriously because ultimately we want AML rules that work, for everyone, and demonstrably so – which is not the case now.

The question is not whether and how AML rules should be relaxed. It is this:

How can AML rules be designed so that the risks facing banks and other financial institutions are proportionate to the risks of carrying criminal flows, and not inadvertently supporting discriminatory outcomes against poorer countries (and people)?

An inexplicably bad approach

The UK’s Financial Conduct Authority (FCA) is accountable to HM Treasury and the UK parliament for regulating more than 50,000 firms to ensure integrity of financial markets. As Matt Collin points out in a great post, the FCA has just fined the (British branch of the) Bank of Beirut £2 million, and ordered it to sort out its AML procedures.

In the interim, the bank is barred from taking on new business in ‘high risk’ jurisdictions – which the FCA defines as anywhere scoring 60 or less out of 100 on Transparency International’s Corruption Perceptions Index (CPI).

Matt makes two important points about the weaknesses of this approach:

  1. The CPI doesn’t reflect AML risks. Not a single one of the surveys which are aggregated into the CPI involves perceptions of money-laundering.
  2. The threshold is arbitrary – and includes nearly 80% of the 175 countries for which ratings are produced. See Matt’s great figure.

Let’s add a couple of other points:

  1. Even on its own terms, the CPI is a very bad measure of corruption. Sorry and all, and I think many TI chapters do really fantastic work; but the quicker the organisation drops the CPI, the better. Nor should anybody else be using it, as if it were some kind of objective indicator of corruption (never mind money-laundering) – it’s not.
  2. And here’s the real kicker. The CPI is mainly telling you one thing: how poor a country is. Per capita income ‘explains’ more than half of the variation of the CPI (for 2012, which I happened to have to hand). The equivalent for the Basle Anti-Money Laundering Index, which includes the CPI among its components, is a little over a third.

CPI v lngdppc

So: the FCA is basing their AML risk measure on an arbitrary threshold, in a bad measure of corruption, which has nothing to do with money laundering, and mainly reflects income poverty.


An alternative approach

What could the FCA do instead? Well, they could use the Basle index. Or they could follow the lead of researchers at the Italian central bank, or a German rating agency among a good many others – and use TJN’s Financial Secrecy Index (FSI).

The FSI – which is also a component of the Basle index – brings together 48 variables, predominantly from assessments by international organisations, to create 15 indicators of financial secrecy – that is, of the risk factor for money-laundering, tax fraud and other financial crimes. These are then compiled into a single ‘secrecy score’.

For the FSI, this is combined with a measure of each jurisdictions’ global scale in order to produce a final ranking that reflects the relative potential to frustrate other countries’ regulation, taxation and anti-corruption efforts.

For a risk measure, you’d only want to use the secrecy score (or perhaps a subset of indicators that are most tightly relevant to money laundering). Relationships with per capita income are much weaker and of mixed direction, reflecting the basis in objectively assessed secrecy and scale criteria rather than perceptions of corruption.

FSI 2013 and components lngdppcConclusion

To recap: If a financial regulator were to design a simple risk measure that would be most likely to lead to debanking of poor countries, while at the same time having no impact on the most risky jurisdictions, it’s hard to see how they could have done better than the FCA.

The broader lesson for the necessary rethinking of AML rules seems fairly clear. What are needed are context-sensitive measures that encourage responses proportionate to the actual financial crime risks – rather than encouraging the blanket withdrawal of services to poorer countries and/or people.

Transgender Reporting and Human Rights

I’m delighted to host this guest post from Fran Luke, full-time parent, un- and underemployed musician and teacher.

“Ignorance is the parent of fear.” Moby Dick, Herman Melville

I am not a subject matter expert. I do not pretend to be, nor have I ever had any intention of becoming one. I would much prefer to be playing with my children, writing music, improving and performing on my instruments, or even working at a job that allows me to adequately care for my family. That said, I have located and read as much reporting as I can find regarding Transgender Human Rights issues, globally.

After being advised by a member of an NGO advocating, I guess, for people ‘like me’ that the ‘time was not yet right’ to pursue Trans* rights at the UN level, I felt the need to learn more.

When our leadership spends more time speaking about the tie or dress they wore to a White House function, or how great it is our Trans* children can now die in endless war, it’s time to look elsewhere.

The argument for which group is the most marginalized should never be entered into. It is pointless. It’s always an issue of class and perceived degrees of humanity.

Transgender reporting

With regard to documentation, who is included or not, and policy, I’ll start with the UN. It’s my understanding population data is provided at the national level. This from a brief discussion with Anne-B Albrectsen at UNFPA, “We work to make sure that all countries disaggregate data as much as possible. Nationally owned data is best”.

Can data collected at the national level, perhaps the easiest way to get data into the system, accurately reflect conditions of marginalized sectors? Would it not often be the policies of those in power that keep marginalized communities where they are? The issues of the Rohingya and question of citizenship come first to mind.

There is not a great deal of reporting on the issues of Transgender human rights, but there is some. Rather than begin by referencing reports from LGBTI advocacy organizations, I thought it more appropriate to start with recommendations and reports from agencies within the UN.

UN-counted?

After being treated at times like an uncomfortable joke at some UN initiatives that invited civil society discourse, I thought I’d start with their own recommendations. These recommendations never seem to make it to the mainstream discussions of Human Rights, or the General Assembly for that matter.

Here is a list of recommendations from the 2013 UNDP Discussion Paper, ‘Transgender Health and Human Rights’:

undp dec2013 trans rights recs

Some of the recommendations from the 2012 UNDP report ‘Transgender Persons, Human Rights and HIV vulnerability in Asia and the Pacific’ include; having Trans* people as research partners, documenting and understanding Trans* vulnerability, promoting transgender rights and culture, making equality legislation work better.

The first of eleven recommendations relates directly to counting:

undp dec2012 hiv trans rec1

UNDP’s 2010 Issues Brief, ‘Hijras/Transgender Women in India: HIV, Human Rights and Social Exclusion’, includes the following recommendations:

undp 2010 hijras recs5-8

Finally, these are the concluding thoughts from the UN-Women briefing paper, ‘The Transgender Question in India; Policy and Budgetary Priorities’:

unwomen trans india conc

Where next?

One question to consider is why this type of analysis has failed to penetrate more deeply into UN and national-level policy discussions.

Another is whether there are risks from being counted – whether invisibility does not sometimes provide a type of protection. The discussion, and struggle for the realization of Universal Human Rights for any segment of society can never be put off for political expedience. If the goal is truly a crosscutting, transformative human rights agenda, then we must start by recognizing our shared humanity. The cost of silence is, and has been far too great.

Night is Another Country - culture of silence

[From The Night is Another Country, RedLac Trans and the International HIV/AIDS Alliance.]

We know some information at least is there, provided as shown in these instances by the agencies or organizations that do not appear to bring it into the mainstream. So, who does the counting and decides what to count? I’ll end here with a quote from Dr. Martin Luther King:

Cowardice asks the question – is it safe?
Expediency asks the question – is it politic?
Vanity asks the question – is it popular?
But conscience asks the question – is it right?
And there comes a time when one must take a position
that is neither safe, nor politic, nor popular;
but one must take it because it is right.

Selected Resources

Links

Offshore ownership in the UK

Transparency International has a new report out on the extent of secretive offshore ownership of London and UK property – and the consistent appearance of more secretive jurisdictions in investigations of corrupt ownership. Back of the envelope calculations suggest the tax implications could be substantial too… This may not make sense to some, as to start a company legally has more than just one advantage to forming a company in the UK and complying with the many regulatory boards that govern different Public and Private Limited Companies.

A few top lines:

  • The scale of offshore ownership is large, covering 40,725 London properties. (Or per the Financial Times last year, at least £122 billion across England & Wales; for Scotland, check Andy Wightman’s blog and book.)
  • Secrecy is a common feature. 89% of these properties (36,342) are held through TIUK 2015 POCU incorp locsecrecy jurisdictions, with more than a third due to the highly secretive British Virgin Islands alone.
  • Secrecy jurisdiction structures account for 5-10% of properties in the richest parts of the city including Westminster and Kensington & Chelsea: see map.
  • To the surprise of nobody, secrecy jurisdictions dominate the ownership of property in the Metropolitan Police’s investigations of corruption too.

The report is well worth a look, and details a lot more of the ways in which secrecy jurisdictions are used to make ownership anonymous, and how that facilitates all sorts of corruption.

Just for fun, I took a couple of the stats and checked to see what the potential capital gains tax (CGT) implications might be – because of course if a property is owned through an anonymous company, you can sell the company rather than the property and potentially skip the tax.

A lot of offshore ownership will be entirely unsullied by any intention to launder the proceeds of crime, or to dodge tax. But to get a sense of scale, it’s still informative to think in terms of the potential CGT at risk.

Example 1: the report notes that in 2011 alone, BVI companies bought £3.8 billion of UK property. Assume that property rose in value according to the government’s average house price index (although we know this is mainly high-end property, so this is likely to be conservative), then the rise in value by 2015 would be around 11.8%. Applying CGT at 28% would yield around £125 million of revenues – from the offshore ownership via one jurisdiction and in one year alone.

Example 2: taking the same approach to the FT’s figure of £122 billion owned offshore in England & Wales last year, we have an average rise in value of around 1.9%, with a potential CGT yield for the year of nearly £2.3 billion.

Of course, in neither case do we expect all CGT to have been unpaid; and the liability would only arise were the property sold. Still – the potential scale suggests TI’s final recommendation might well pay for itself, or indeed do rather better:

The Land Registry should publish the ultimate beneficial ownership of these properties freely to the public, on the same basis as Companies House is set to do under current UK legislation. Accordingly, companies registered overseas would be required to update beneficial ownership information on the same basis as UK registered companies.

And so say all of us.