UNCTAD’s big number: A critique

Update 2: 8 May 2015, a slightly tweaked version of the blog is now back up, and the UNCTAD study authors will provide a comment which I’ll add at the start of next week.

A critique of the UNCTAD analysis of corporate tax avoidance suggests things may be (even) less rosy for developing countries. 

It is a mark of the importance of UNCTAD’s study on corporate tax avoidance in developing countries that it is provides the first numbers mentioned by the World Bank’s MD and COO Sri Mulyani in a major speech last month:

A recent UNCTAD study indicates that about $100 billion in annual tax revenue is lost to developing countries in transactions directly linked to offshore hubs. The total “development finance” loss – counting both revenue and reinvested earnings – is estimated in the range of $250 to $300 billion. This prevents developing countries from stopping the outflow of money – which thus bleeds them of essential resources.

For the schoolchild in Haiti, the new mother in Malawi, or the farmer in Bangladesh, these losses have a real impact: They result in classrooms that are overcrowded, health clinics that are never built, and water that is never delivered. People’s opportunities are being stolen from them – because tax revenues are not collected.

But there is a critique of the UNCTAD report, which also found that multinational enterprises (MNEs) may be paying developing countries around $700bn in revenues.
The import of the critique is that, rather than multinationals in developing countries avoiding a dollar of tax for every seven they contribute, they may by one form of avoidance alone be avoiding a dollar of tax for every three or four they contribute. Total revenue losses to avoidance might even stack up against the total contribution made… but I’m getting ahead of myself.
There are two main elements to the critique being advanced, one conceptual, the other practical. I should repeat my disclosure from the earlier blog that I’m part of the expert group that has fed in views about drafts of the study, so I’m probably not neutral.

The role of investment

The conceptual critique concerns whether the UNCTAD study appropriately captures the role of investment in development.

One risk is that a policy of avoidance might somehow be seen as an acceptable tool to encourage investment, that a tradeoff might exist (p.5):

The dilemma is clear: how can policymakers take action against tax avoidance to ensure that MNEs pay “the right amount of tax, at the right time, and in the right place” while avoiding excessive tightening of the fiscal regime for MNEs which might have a negative impact on investment.

Three main criticisms are made.

First, the study concentrates on FDI rather than the total of investment. But it’s conceivable that reducing multinational tax avoidance could (i) increase revenues for public investment, (ii) reduce the unfair competitive disadvantage faced by domestic firms (and more compliant multinationals), and through the combination of (i) and (ii) actually increase overall investment.

Second, any possible tradeoff hinges on assumptions of the importance of tax for investment (that is, for FDI). Namely (p.5, emphasis in original):

Tax is a key investment determinant influencing the attractiveness of a location or an economy for international investors.

Taxation, tax reliefs and other fiscal incentives are a key policy tool to attract investors.

The criticism is that these statements are undercut by the evidence – for example, TJN research (PDF) drawing on the IMF and McKinsey’s inter alia has long highlighted the non-importance of tax in locational decisions. [Such overall findings do not necessarily rule out any potential role of well-administered tax incentives as a possible lever of industrial policy, however.]

The third element of the conceptual critique is that while FDI inflows might fall in the event of targeted reduction in MNE tax avoidance, it is unlikely that a fall in FDI stock would occur – and highly unlikely that such a fall would be of sufficient scale to reduce overall revenues. The strongest impact of the financial crisis came in 2009, which saw positive inflows continue, albeit with a 20% fall in volume.

My take on this, for what it’s worth: the suggestion of a tradeoff is far from prominent in the paper, and UNCTAD exist in part to promote FDI (benefits), so the framing is not particularly surprising.

And nor need it be particularly damaging, if the dominant discourse is reflected by the kind of remarks that James Zhan (Director of the relevant UNCTAD department) made at the UNECE Financing for Development consultation about the importance of MNE tax avoidance, and the need to maximise not investment per se but the broader sustainable development benefits thereof – so that there’s no immediate, actionable avoidance/investment tradeoff as such, but a more holistic conception of the potential for FDI to influence multiple channels of a (much wider again) development strategy.
I don’t think anyone would argue – and the UNCTAD study does not – for promoting avoidance as an investment attraction mechanism (although that is in a sense the game for those jurisdictions that seek to capture the tax base of others.)

Methodological critique: Varying the assumptions

The methodological critique is multifaceted, and I will set aside much of it. Suffice to say, I think there are reasonable criticisms to be made – as with any regression analyses, and any attempt to estimate hidden financial flows on the basis of limited public data – but that the central approach is quite reasonable, and represents a valuable innovation to add to existing work.

A broad point is that the revenue loss number for one form of avoidance alone has been presented as the number for all avoidance – ignoring, for example, transfer pricing abuses of the sort that a Banque de France researcher has estimated to cost France alone tax base of around $8 billion a year. We certainly need to find ways to construct broader numbers of that type, but it’s not what the authors were about here.

The more specific criticisms of the UNCTAD study calculation are interesting, however, and worth showing in order to think about where one should imagine the probable range of MNE revenue contributions, and so the relative scale of avoidance – for the ‘contribution method’ and the ‘FDI-income method’, which are the two complementary approaches proposed and used in the UNCTAD study.

Contribution method

This approach uses countries’ revenue values from the new ICTD dataset, and allocates a proportion of each revenue type from 0-100% to MNEs in order to assess their total contribution.

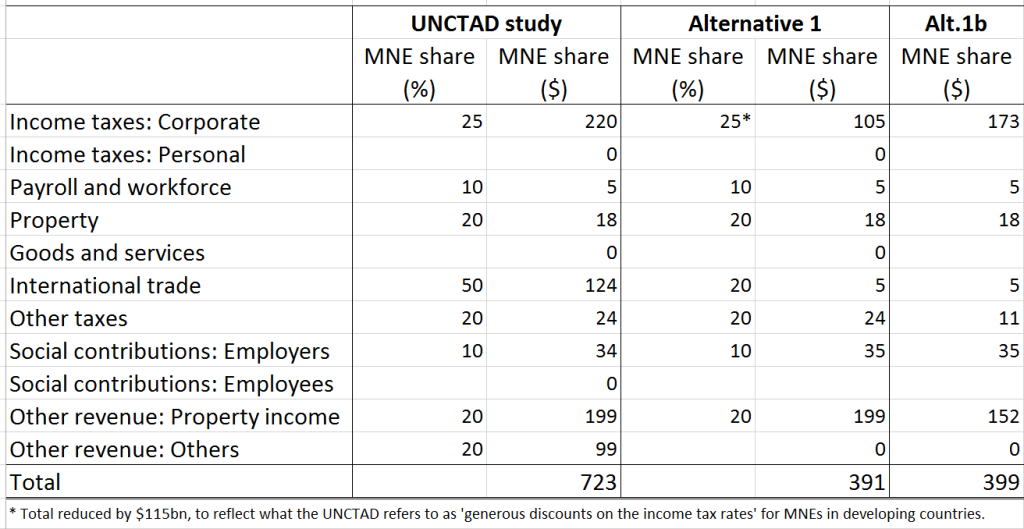
The critics highlight a range of decisions as potentially difficult to justify (e.g. that MNEs contribute 50% of tax paid on property, or 100% of taxes on imports), and make some different proposals (‘Alternative 1′ in the table). This additionally includes a relaxation of the UNCTAD study’s assumption that MNEs’ share of taxable profit will be equivalent to their share of operating surplus, which will be violated when methods like thin capitalisation are used for profit-shifting. There is also a somewhat arbitrary reduction (by the critics) of the MNEs’ share of corporate tax revenues, apparently to reflect the original study’s recognition that ‘generous discounts on tax rates’ may lead to bias here.

This reduces the total estimated MNE contribution from $723 billion to $391 billion. In addition, the critics point out that the UNCTAD study uses a reference year from the crisis period. Choosing a different reference year (‘Alternative 1b’) leads to a total contribution of $399 billion, but where the share due to corporate income tax is now 43% of revenue contribution, as opposed to 30% in the original.

Here I have to put my hands up – the UNCTAD study (very wisely) uses the ICTD Government Revenue Dataset, as a better source of tax data, and until the upcoming release, the present edition contains only data to 2009/10.

UNCTAD critics table1

FDI-income method

In this method, the UNCTAD study takes balance of payments data on FDI income, and applies an average effective tax rate to estimate a revenue outcome. Good data on MNEs’ foreign tax payments, never mind effective tax rates, is notoriously difficult to come by – and especially so for lower-income countries.

The critics re-engineer the data in the UNCTAD study to show that an effective rate of 11% is not unreasonable, but more generously apply 15% (compared to nearer 20% and 25% in the original).

The overall effect, combined with the above finding that income tax produces a higher share of the total contribution, is to reduce the estimated total contribution to $291 billion.

Implications?

It is true that the UNCTAD study considers only one form of avoidance – so as they themselves say, one might reasonably add to their $100 billion an estimate of transfer pricing avoidance (for example).
[The reason not to, I imagine, is that there isn’t as rigorous an estimate of this as their estimate of the thin capitalisation avoidance, due to the failure to make available more widely the type of trade data used in the Banque de France study which explicitly contrasts real arm’s length pricing with related party trade prices.]

This is not a criticism of the UNCTAD study – just a caution against presenting the $100 billion as if it were an assessment of all avoidance.

A genuine, but as yet untested criticism relates to the potential sensitivity of the assessment of the revenue contribution of MNEs in developing countries, to the necessary set of assumptions made.

Is MNEs’ revenue contribution $300 billion or $700 billion?

You wouldn’t stand full square behind either, it seems to me, but that feels a more or less inevitable result of current data problems (yet one more that would be solved, of course, by public country-by-country reporting).

The UNCTAD study provides justification for the various choices it makes. It would be useful to have a broader discussion of these, and to onsider the range of movement in the estimate level of contributions.

What does this all mean for policy? One response to the UNCTAD study would be to acknowledge that it provides confirmation, at a minimum, of the ‘scale-reasonableness’ of NGO estimates of revenue losses of this scale. Another would be to note, as I did in the previous post on this report, that $100bn is small in relation to total revenues.

If the critics were right, and the total MNE contribution is half of what we thought, perhaps this whole area of tax should be even less of a priority. Alternatively, if the MNE contribution could be doubled from what it is – without any unreasonable impositions – that would suggest a much bigger prize…

The one form of avoidance (thin capitalisation) in the UNCTAD study seems likely to be joined by several significantly sized other mechanisms – as the evidence for Europe suggests fairly strongly may be the case; and see also the new OECD survey paper on evidence on an even broader range of BEPS channels.

So the total developing country revenue losses to MNE avoidance could be several times that $100 billion – which could be half of, or the same as MNEs’ total contribution, if the original or the critics’ assumptions are used.

The authors of the study have very kindly agreed to provide a response to some of the points raised, which I’ll post here when I have it. I think it will help the rest of us to understand more about the range of possible revenue contributions we should consider reasonable.

Tax Justice Research Bulletin 1(4)

April-ish 2015. The fourth Tax Justice Research Bulletin is out (a monthly series dedicated to tracking the latest developments in policy-relevant research on national and international taxation). Find it all together, as it should be, at its TJN home.

Zidar 2015 fig5This issue looks at some striking results from the US on the employment impact of cutting taxes for the top 10%; and at ‘inefficient and unjust’ Greek tax policy since 1995. The Spotlight looks at the literature on base erosion and profit shifting by multinational companies, drawing on a handy study from the OECD BEPS 11 people, and a new Banque de France working paper.
This month’s backing track probably refers more to Greek policymakers than the CTPA: the late, great Lucky Dube’s Mr Taxman (“What have you done for me lately?”).

For your future research needs, the updating of the ICTD Government Revenue Dataset is almost complete, so with a bit of luck it will be published in June. Discussions about a major 2016 conference and call for papers using the data are underway.

As ever, submissions for the Bulletin – substantial and musical – are most welcome.

Greek tragedy: Reversing development through tax

[From the Tax Justice Research Bulletin 1(4)]

The 4 Rs (or 5) of tax provide a simple basis for thinking about what effective taxation can deliver: not only revenues and redistribution, but also re-pricing of social goods and bads, rebalancing of an economy between sectors, and perhaps most importantly, supporting accountable political representation (in which the evidence indicates a critical role for direct taxation).

While popular analyses of Greece’s fiscal issues have tended to start and end with fiscal profligacy, a new (ungated) article by Yiorgos Ioannidis on ‘The political economy of the distributional character of the Greek taxation system (1995-2008)’ reveals that the problem is not high spending but weak revenue-raising; and that the underlying failure is one of representation as much as of revenues.

Greek v EZ revenues Ioannidis 2015 table1

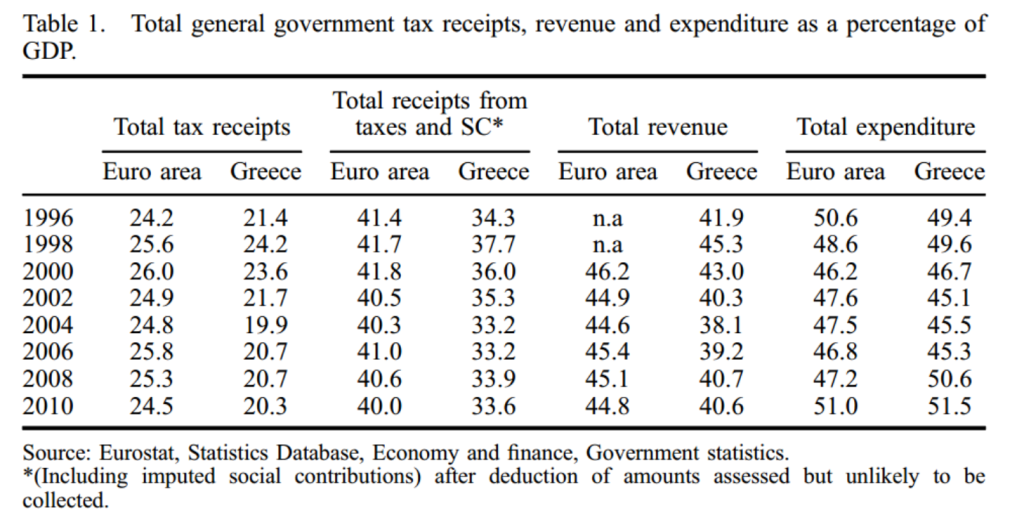
The starting point for Ioannidis is the disconnect from the mid-1990s between buoyant economic performance and the failure to close the gap in tax performance with the rest of the Eurozone – seen clearly in table 1. The specific underlying failure, as Ioannidis reveals, relates to direct taxation.

Despite the propitious circumstances of strong growth and a natural widening of the formal wage tax base, policymakers allowed overall tax receipts as share of GDP to fall – and in particular direct taxes fell from around 10% to 8% of GDP, with the majority coming from corporate tax cuts. Revenue reliance on indirect taxes, above all VAT, remained unchallenged – so that Greece’s tax structure continued to resemble ‘a developing rather than a developed country.’

Ioannidis explores much of the detail on policy mistakes, including the decision to use growing formal employment to fund corporate tax cuts, and in respect of property taxation. Most striking is the analysis of decisions around income taxation that actively undermined compliance, along with vertical and horizontal equity, and resulted in a highly regressive structure. If tragedy is the right word, it is because it could have been foretold to the protagonist policymakers beforehand that these decisions would squander both the economic and political development opportunities that presented themselves in the 90s.

The challenge for the new government is that rebuilding faith in public institutions, their fairness and representativeness, is necessarily a slow process. But while the need to raise greater revenues risks greater hardship on the way, it may ultimately support the virtuous cycle of better taxation and more accountable political representation.

One role in this for Eurozone partners and other jurisdictions is to ensure the automatic provision of tax information that is necessary to curtail offshore tax evasion.

Base erosion and profit-shifting: What do we know?

[From the Tax Justice Research Bulletin 1(4)]

The OECD was mandated by the G8 and G20 to revise its international tax rules in order to combat multinational corporate tax dodging – known in OECD jargon as “Base Erosion and Profit-Shifting (BEPS). The final deliverables due later this year, and because of the complexity of international tax, it has been broken down into 15 “Action Points.” (On Monday, TJN blogged Action Points 3 and 12, as discussed by the BEPS Monitoring Group, or BMG.)

The geeks’ Action Point of choice has always been number 11, which requires the collation of baseline data on how far profits are misaligned away from genuine economic activity: e.g. by being shoveled into tax havens where nothing really happens. Action Point 11 also involves continuous tracking of progress in this area.

The team working on BEPS 11 has now published a discussion draft, which sets out not only their thinking on questions of data and measurement (check back later with the BMG for our response to these) but also a broad survey of the literature on the scale and channels of BEPS.

A Banque de France researcher found that measured deviations from the Arm’s Length Principle may have cost France $8 billion of its revenuetax base in 2008 alone – and this is just one aspect of profit-shifting

Some of the main findings:

    • There is broad consensus (regardless of time period, country or data source) that there has been widespread tax-motivated BEPS activity by multinationals — though the intensity varies.
    • BEPS via manipulation of debt and interest payments is particularly important (and relatively well-studied: e.g. Huizinga, Laeven and Nicodeme (2008).)
    • Transfer pricing studies of various kinds show consistently, again, that prices are manipulated for tax reasons; and that intangible assets are important here. We might also point to the more recent study by Banque de France researcher Vincent Vicard, finding that the deviation between intra-firm pricing and true arm’s length prices may result in a revenuetax base loss to France of $8bn in 2008, having grown over the decade – and this remains just a part of estimated total profit-shifting. [Phew!]
    • Treaty shopping is estimated to reduce withholding tax rates ‘by more than five percentage points from nearly 8% to 3%.’
    • Transparency: evidence on the role of disclosure and transparency – i.e. measures such as BEPS 11 itself – is limited but striking. Most obviously, Dyreng, Hoopes and Wilder (2014) found that ActionAid’s revelations about FTSE100 companies failing to meet a rule on disclosure of subsidiaries resulted in greater disclosure, a reduction in ‘tax haven’ subsidiaries and a reduction in avoidance [Kudos to Actionaid!].
ActionAid’s revelations about FTSE100 companies failing to meet a rule on disclosure of subsidiaries resulted in greater disclosure, a reduction in ‘tax haven’ subsidiaries and a reduction in avoidance
  • Developing country scale: only two studies provide a comparative assessment of the likely scale of BEPS in developing as opposed to higher-income countries. The first, by authors including long-standing critics of NGO estimates in the broad area, finds that profit-shifting (in this case, only that of German multinationals and via debt manipulations) is roughly double the size in developing countries. The IMF, meanwhile, recently presented evidence that the revenue losses of developing countries may be several times higher than elsewhere (as a share of corporate tax revenue).

Without wishing to prejudge the BEPS Monitoring Group’s analysis (oh go on then), it is clear even from this chapter of the OECD study alone that the authors have reached a point very similar to that which motivated Richard Murphy to elaborate the first TJN proposal for country-by-country reporting back in the day: namely, that existing data sources can only provide parts of the picture, and to develop a comprehensive understanding of BEPS will require consistent and comprehensive data on global multinational activity. [Well done Richard!]

To this we might add, in the spirit of Uncounted, that current data availability has “non-random weaknesses” which will systematically result in disproportionately lower tax revenues in lower-income countries. BEPS 11, if it delivers that comprehensive data, might just be the greatest contribution to fairer international tax that is compatible with the insistence on separate accounting.

Myths vs evidence: Tax cuts for the 10%

[From the Tax Justice Research Bulletin 1(4)]

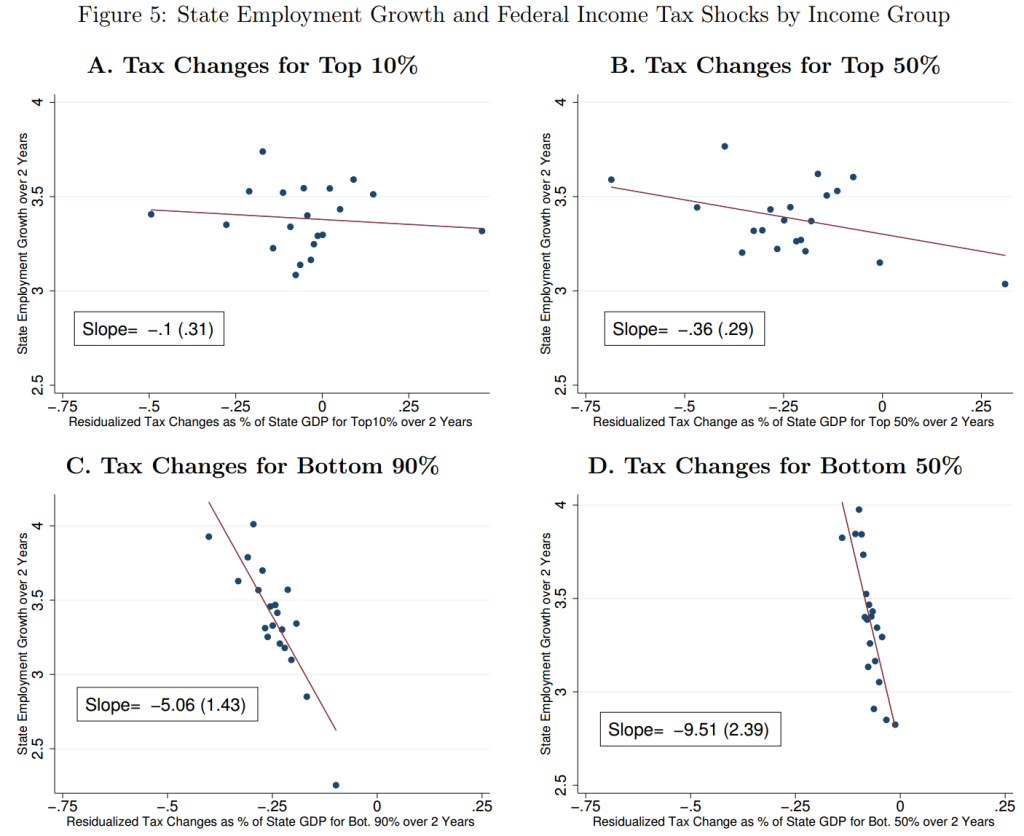
Do tax cuts targeted at different parts of the income distribution produce different effects in terms of employment growth? This is the question addressed in a new NBER paper by Owen Zidar, an economist at Chicago (not known historically for progressive analysis). But the paper (ungated version; and slides) has had a good deal of US media coverage, largely because of the progressive tax implications.

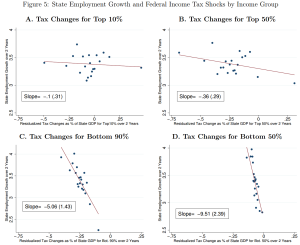
Zidar 2015 fig5The main innovation of the paper is to overcome the scarcity of time series data, which you can learn more about if you decide to visit here, by exploiting US data on state-level income distributions, which differ widely, in order to view each state-year response to a national tax policy change as a separate observation.

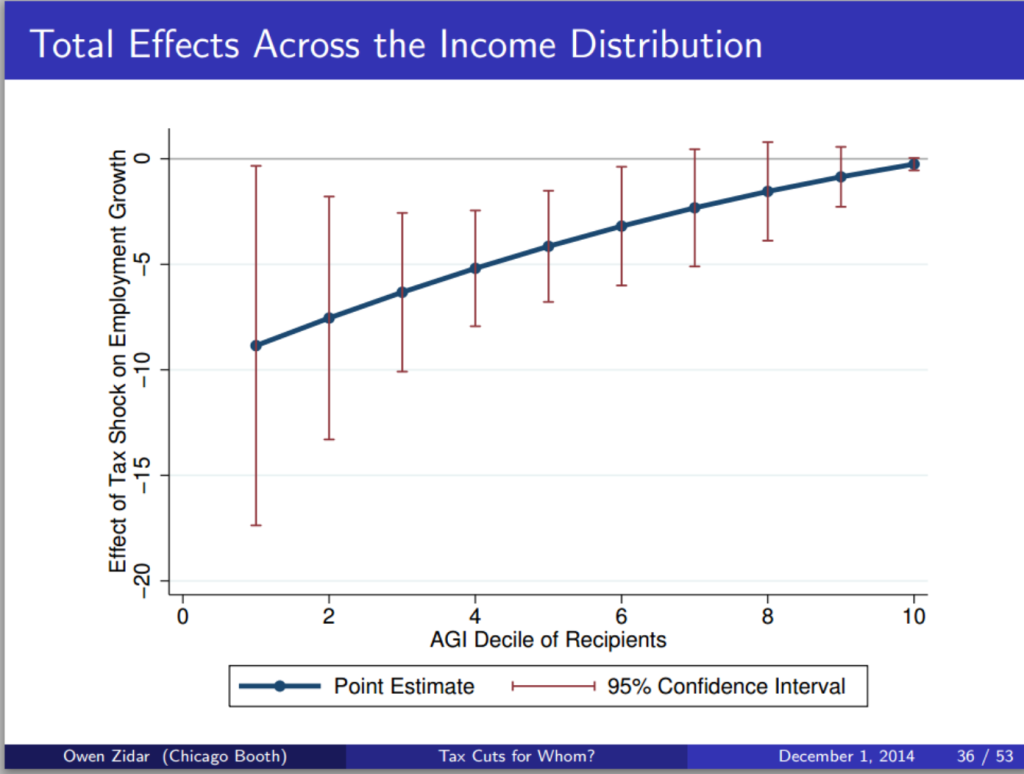
The main result is not, intuitively, surprising: but it is not a question that has been commonly posed, nor this well answered before. The result is that tax cuts are least likely to generate benefits when targeted to the top 10% of households; and most likely to generate benefits when targeted to the bottom 90% – or as in figure 5, the bottom 50%.

Overall, tax cuts for the bottom 90% tend to result in more output, employment, consumption and investment growth than equivalently sized cuts for the top 10% over a business cycle frequency.

Why would we ever cut taxes for the top 10% as a stimulus, I hear you ask? Because they’re in charge, say the cynics. Or perhaps because policymakers and/or the public have bought a series of economic myths. Like:

  • the top 10% drive the economy;
  • the top 10%’s economic decisions respond strongly to marginal incentives rather than broader factors like aggregate demand, or the availability of sound infrastructure and a healthy, well-educated workforce; so
  • progressive taxation is bad for growth, and ultimately bad for the poor as well as the rich.

One fairly clear implication of the findings is: the opposite.

The employment growth impact of a tax change for the top 10% is impossible to distinguish from zero, so it follows that a revenue-neutral change in tax structure that deliberately reduces the Palma measure of inequality (that is, the ratio of incomes of the top 10% to the bottom 40%) will not only be progressive but will have the effect of increasing employment growth.

Zidar 2015 slide36


The Offshore Game

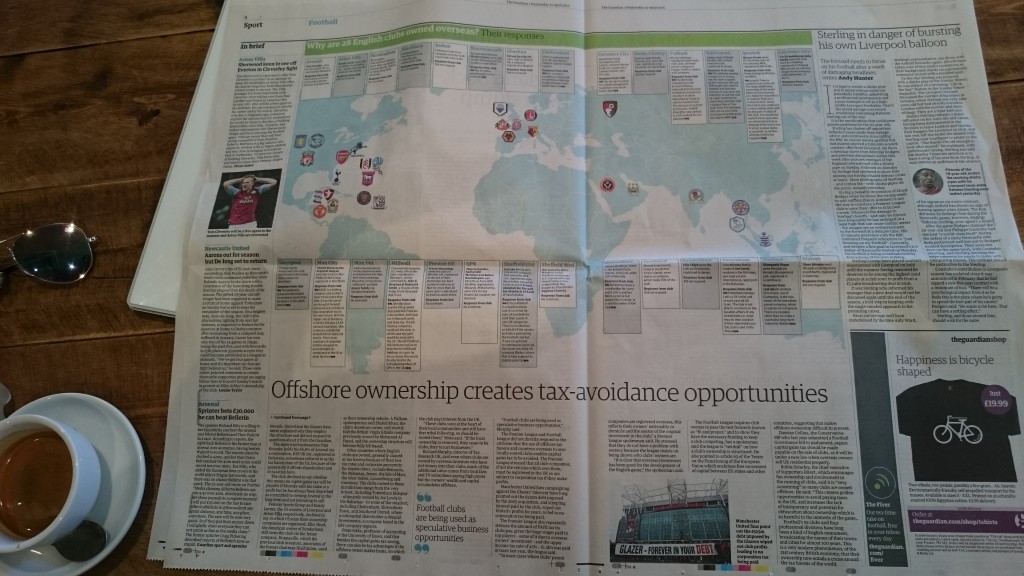
Football’s a funny old game, or so it’s been said. The people’s game. The beautiful game. The offshore game? £3 billion says so, according to the new TJN project which launched with a splash in The Guardian today.

DSC_1099

The Offshore Game

The new project, The Offshore Game, will focus on a range of financial secrecy issues in sport around the world – from match-fixing to administrative corruption, and from tax dodging to the lack of accountability to fans.

In this first major report, we focus on the extent of offshore finance – through both equity ownership and the provision of loans – in the English and Scottish football leagues, using the most recent full accounts plus additional data in the public domain (that is, information that fans could reasonably access in order to see who is in control of their club). [Here’s the methodology.]

A major finding is the total of £3 billion of offshore money, much of it through some of the most financially secretive jurisdictions around the world. The clubs involved range from giants like Manchester United, to minnows such as Dumbarton.

The report highlights the range of risks – not least for fans, tax authorities and sporting integrity – that are exacerbated through greater exposure to financial secrecy.

The Offshore League Table

The league table follows TJN’s Financial Secrecy Index in ranking clubs according to the combination of scale and secrecy: how much offshore money is involved, and how secretive are the particular jurisdictions?

Full details are in the report, including responses from clubs where they provided them, and detailed studies of the top five’s financial secrecy and possible risks.

TOG league table


Thanks and kudos to George Turner for driving the project forward, and writing the report. And to Christian Aid, who provided the space for the fore-running 2010 report, Blowing the Whistle.

Next steps?

Where The Offshore Game goes next will depend, in part, on the opportunities that arise. There are, for example, some very interesting developments in the field of match-fixing analytics that offer the potential of identifying the extreme abnormalities associated with rigged matches in various sports. However whilst we predict the amount of people investing in off-shore accounts for tax evasion, we also predict that as more and more people move to countries with better climates or economic statuses they will be investing in offshore accounts ready for when they move over. If you are looking for help banking in Andorra, you should read a guide online for information.

We are already receiving tip-offs and suggestions about individual cases of hidden ownership, and associated criminality; while there is clearly scope for financial scrutiny of major international sporting institutions such as the International Olympic Committee and FIFA.

Give us a shout if you have an idea or some info you think we should see (secure options available). It’s all over the world, this stuff…

DSC_1100

Empty-chairing people with disabilities

People living with disabilities in the UK have suffered an excessive burden from the spending cuts; have been further excluded by the decision not to compile statistics on the impact of those cuts; and now, as the election looms, find a refusal to recognise them politically.

[For what it’s worth: these are problems that cut across all political parties, and I’d much rather not be writing this about any in particular; but the behaviour of the coalition government has been extreme.]

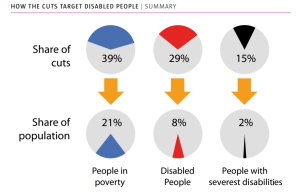
CWR disabled cutsThe data we have show a very considerable excess burden of cuts on people living with disability – the Centre for Welfare Reform, for example, find that people with disabilities lose an average of £4,410, or nine times the burden on most citizens; while people with severe disabilities lose £8,832, 19 times the burden of others.
That these statistics are generated by an independent organisation tells its own story. The WOW Petition managed to achieve the necessary 100,000 signatures to be granted a parliamentary debate on the need for a ‘cumulative impact assessment’ (CIA) of the cuts to support for people with disabilities and carers.

They even won. But no assessment has been forthcoming, due to the government’s claim – apparently erroneous, it transpires – that the independent Institute for Fiscal Studies had said a CIA would be too difficult.

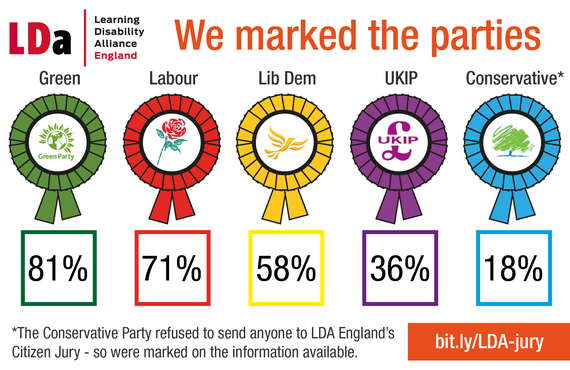
With the general election looming, the Learning Disability Alliance (England) set up a citizens’ jury to assess the related policies of each major political party. The results are what they are – but the striking feature of the jury was that the main party of government refused to take part, despite repeated personal invitations.

LDA party rankOne last piece of information on what looks very much like the deliberate uncounting of people living with disabilities in the UK: this threat from the main department responsible for benefits, the DWP, to withdraw cooperation from one of the main disability-focused news services.

Simon Duffy writes that the community of people with learning disabilities, their families, friends and carers may number as many as 5 million – more than enough to swing multiple seats. The evidence on cuts suggests a political calculation that this won’t happen.


Non-dom, undone?

An interesting development in the UK election campaign today, as the opposition Labour party will pledge to end ‘non-domicile’ tax status – an 18th century relic which allows residents to exempt their foreign income from tax, provided they can make at least some (often highly tenuous) connection to some other state.

It’s heartening to see tax in the centre of the discussion, not least given the minimal attention that has been paid to the UK pursuing the most extreme tax-averse austerity of any leading country (the only country to cut spending more than it cut the deficit).

Unsurprisingly, media attention has focused on the likely revenue impacts and the behavioural effects. Tax accountant Richard Murphy and tax lawyer Jolyon Maugham both suggest a top end revenue impact around £4 billion, falling with behaviour change to £1 billion or so. [Delete as appropriate: great minds/fools etc.]

The revenue numbers may be relatively small, but they’re not really the main point. Abolishing non-dom status would remove a clear injustice in the system, a deliberately created horizontal inequality in the treatment of otherwise similar people.

More importantly, it responds to Piketty’s case for a wealth tax:

The primary purpose of the capital tax is not to finance the social state but to regulate capitalism. The goal is first to stop the indefinite increase of inequality of wealth, and second to impose effective regulation on the financial and banking system in order to avoid crises.

Absent a tax, even at a nominal 0.01%, data may not be collected and so policymakers will lack information about the distribution which might lead them to set policies to tackle inequality. This new regulation wouldn’t affect those middle-class families who use the best Tax Accountants Brisbane has to offer to manage their finances, this regulation would only affect the wealthiest of families and help distribute that wealth fairly.

Aside from the aspect of tax injustice, non-dom status has been pernicious in part because it has taken a deal of high-income individuals’ income out of tax and other data – so that the actual distribution is simply not known.

If we can envisage scenarios in which policymakers may wish to address the (top end of the) distribution, then the absence of this data is an obstacle. In fact, this is one more example of the phenomenon of Uncounted – where the power of an elite group, in this case, allows them to go uncounted and this in turn militates towards higher inequality.

Finally, the existence of non-dom status is iconic – a clear message that the UK wishes to retain its role at the heart of global tax haven activity, providing differential tax and transparency treatment to a certain elite. Knocking non-dommery on the head would build the credibility of, for example, the outgoing government’s important efforts to address financial secrecy worldwide through the G8 and beyond.

Immigrant life and death in Europe, uncounted

Just as immigrants to Europe are often undocumented, so too their deaths. The UK’s Institute of Race Relations has published a study looking at the known cases in recent years, and it makes for terrible reading from the title onwards: ‘Unwanted, unnoticed: An audit of 160 asylum and immigration-related deaths in Europe’.

Aside from the typically harrowing detail of each case, the study puts together an overview of the main patterns.

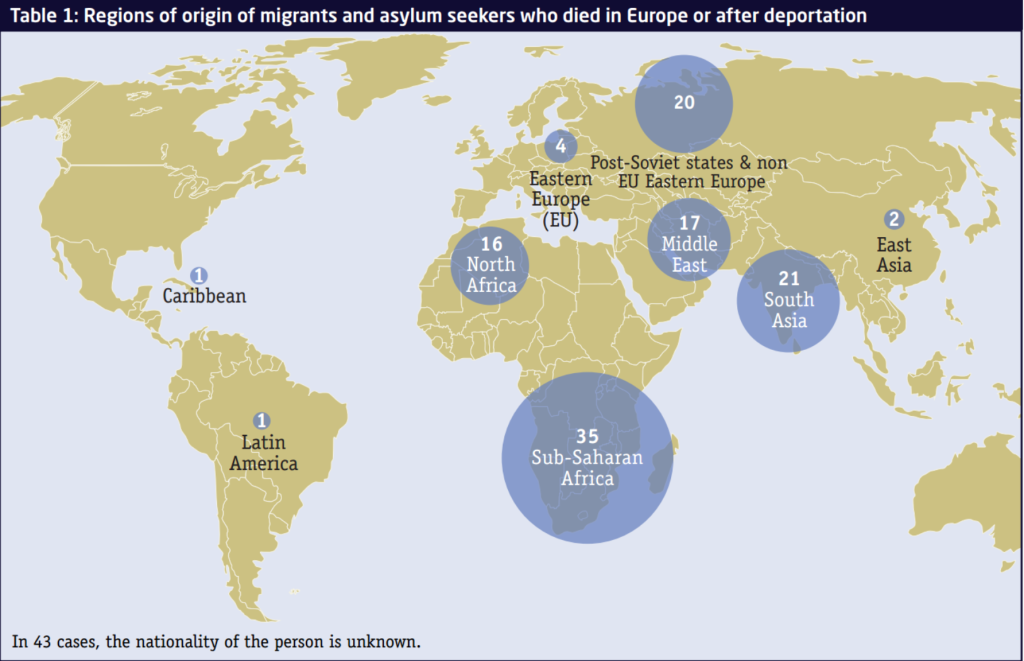
How can people be uncounted up to the point, even, of their death? Out of 160 cases, not even the cause of death is known for 32 people. Not. Even. For 43 people, even the basic information of nationality remains unknown.

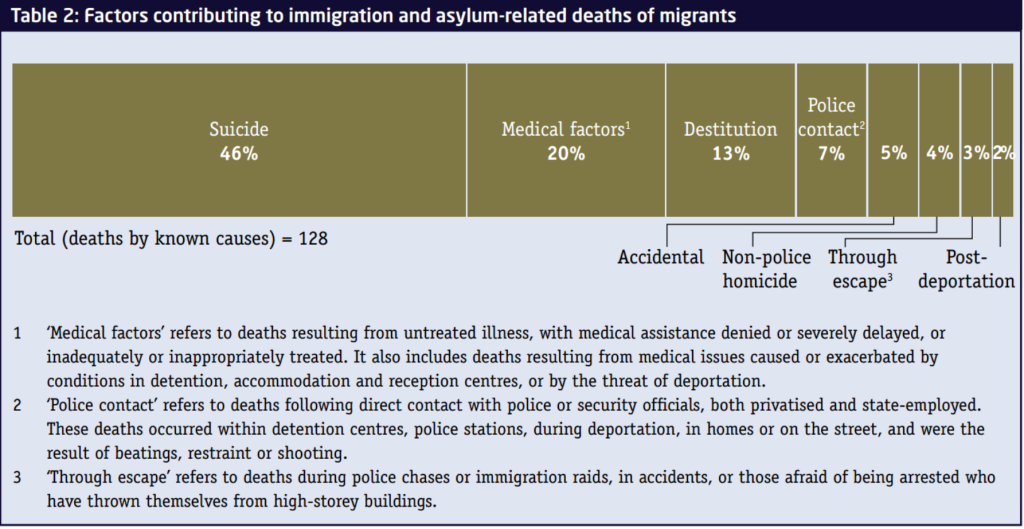
Table 2 shows the main factors where these are known.

IRR uncounted migrant death 2015 tab2

These findings aren’t only important because, well, people died. As the authors put it:

If there is no publicly accessible record of deaths, how can states be held accountable?

Life as an immigrant can be tough. This is true even in the western world. For example, getting a Green Card to live and work in the US is a complex process. Quite often family ties are one of the most popular ways to secure a Green Card.

Under United States immigration law, foreign nationals can obtain a family-based Green Card if they are related to a US citizen or permanent resident. Correspondingly, form I-130 (Petition for Alien Relative) is a US Citizenship and Immigration Services (USCIS) form that is used to prove a valid family relationship exists between a foreign national intending to immigrate to the United States and a US citizen or permanent resident.

Ultimately, the eligibility and ineligibility requirements for form i-130 are complex. If you need help determining who is eligible and ineligible or any other assistance, it might be worthwhile contacting an immigration attorney.

The report calls to mind the CIPOLD review in the UK: the Confidential Inquiry into the premature deaths of people with learning disabilities. Through tracing individual stories of lives and deaths, the study created a set of baseline results that remain the best we have – including:

  • men with learning disabilities die, on average, 13 years younger than men in the general population; and
  • women with learning disabilities die, on average, 20 years younger than women in the general population. (Intersecting inequalities, anyone?)

These differences are not, to be clear, just a direct result of learning disabilities. They reflect society’s treatment of people who live with learning disabilities. The report finds, for example, that 37% of deaths would have been potentially avoidable if good quality healthcare had been provided (and see Chris Hatton’s powerful comment on discrimination by health specialists). This is awful. People shouldn’t be treated any differently due to learning disabilities. However, as evidence has shown that it may happen more often than we might think, it might be worthwhile for those with learning disabilities to consider taking the time to compare life insurance and find an affordable plan. This should allow people to leave their families with money to cover funeral costs if they pass away prematurely. People can click here to learn some other benefits of life insurance too.

There’s an earlier post here on how the problem of being uncounted with learning disabilities hasn’t been addressed in the UK since CIPOLD, and despite various high-profile scandals.

Not always, but often, an important part of not counting is not caring. And all the more so when the uncounted is a particular group. The phenomenon of Uncounted is not a technical one, but a profoundly political one.

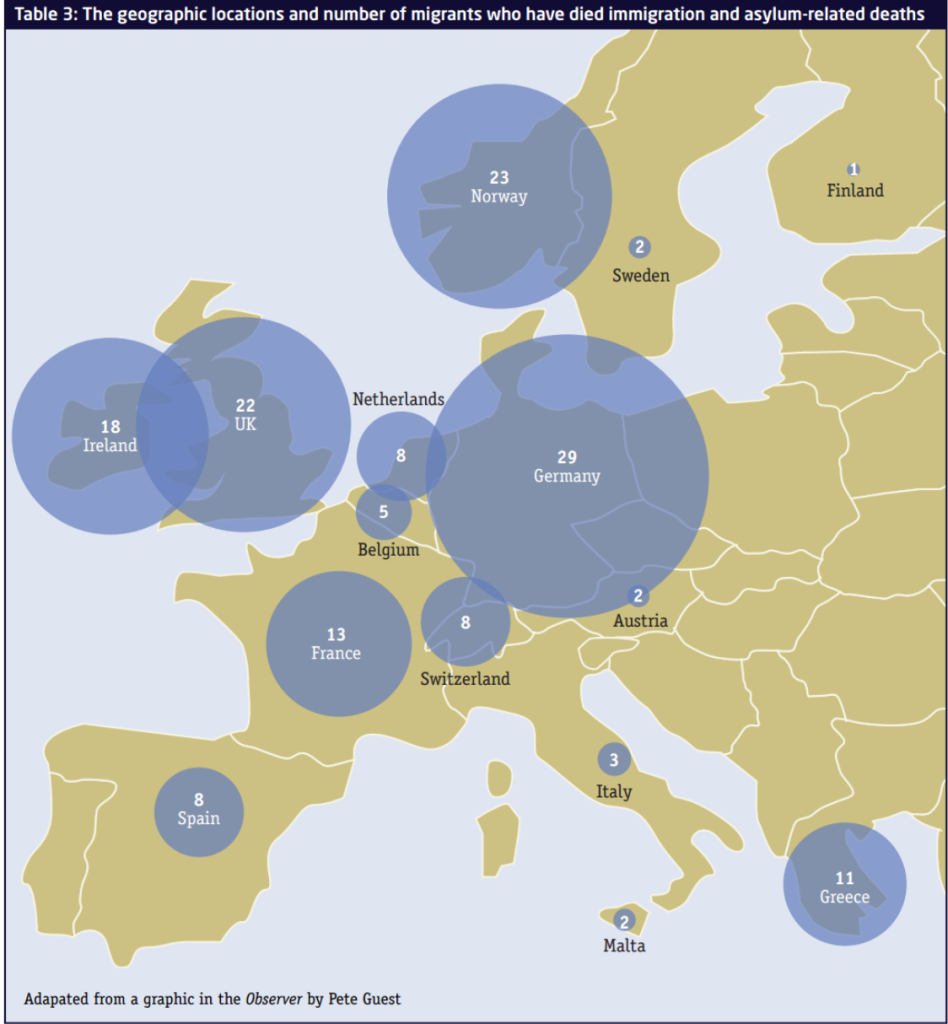
Back to migrants in Europe. Uncounted, from beginning:

IRR uncounted migrant death 2015 tab1To end:

IRR uncounted migrant death 2015 tab3

Link to the full study.

Tax Justice Research Bulletin 1(3)

March 2015. The third Tax Justice Research Bulletin is out, catch it in its full glory (with backing track suggested by Christian Hallum) on its TJN home.

Mahon2015 fig2This issue looks at new papers on the responsibilities of tax professionals in respect of abusive tax behaviour and corruption; and on the parallels between the 1974 banking crisis and that of 2008, and policy lessons that emerge. The Spotlight considers contrasting views on tax and freedom.

One thing to flag: a call for papers from UNU-WIDER, who are stepping up their interest in tax. The call is open until 30 April, and is part of WIDER’s new project on ‘The economics and politics of taxation and social protection’ which is also worth a look (includes call for research proposals and researcher vacancies).

As ever, ideas for the Bulletin are most welcome – including suggested music.

PS. Congratulations to tax lawyer @jolyonmaugham on formally becoming a QC this month – now so silky he could feature in Barcelona’s midfield.