
The Palma ratio of inequality was proposed by Alex Cobham and Andy Sumner in 2013, on the basis of the ‘Palma proposition’: an observation by Jose Gabriel Palma that currently changes in income or consumption inequality are almost exclusively due to changes in the share of the richest 10 per cent and poorest 40 per cent, because the ‘middle’ group between the richest and poorest always capture approximately 50 per cent of gross national income.
The measure is now reported by many of the leading income distribution databases and some national statistics offices, and received wide support as an original indicator for the UN Sustainable Development Goal 10. There is now a possibility that the Palma will be added to SDG 10 during the review process, with high profile supporters including Oxfam and South Africa. From the latter’s 2019 national inequality report (p.150):
Some National Statistical Offices (NSOs) and other international development agencies (such as the World Bank, United Nations, etc.) have opted to produce and report on the Palma ratio to supplement the Gini. The authors of this report agree that the inclusion of the Palma ratio along with the Gini coefficient would be a step in the right direction. Furthermore, if the Palma ratio is to be included in the country’s SDG reporting regime, as an additional indicator for measuring Target 10.1, South Africa would be the first country in Sub-Saharan Africa and outside of the OECD countries to produce and report on the Palma ratio
for monitoring SDG 10 (Sachs, J. et.al., 2019).
Below is an introduction to the Palma, including a 2-minute animation. You can find links to a range of datasets, along with the latest research and policy papers, by clicking through to Palma resources.
Overview
A complete distribution – of inequality, or anything else – cannot be captured in a single measure. And as Tony Atkinson observed in the 1970s, any single measure that is used must inevitably reflect a normative view about what aspects of the distribution are more important.
For example: the Gini coefficient, the most commonly used measure of inequality, is known to be insensitive to the tails of the distribution, and insensitive at high levels of inequality – precisely when and where we might care most.
We don’t want to replace the tyranny of the Gini with a tyranny of the Palma, but instead to challenge the casual use of the Gini that results in important features of inequality being hidden. Let’s use multiple measures of the distribution; but if you’re going to use just one, please don’t let it be the Gini.
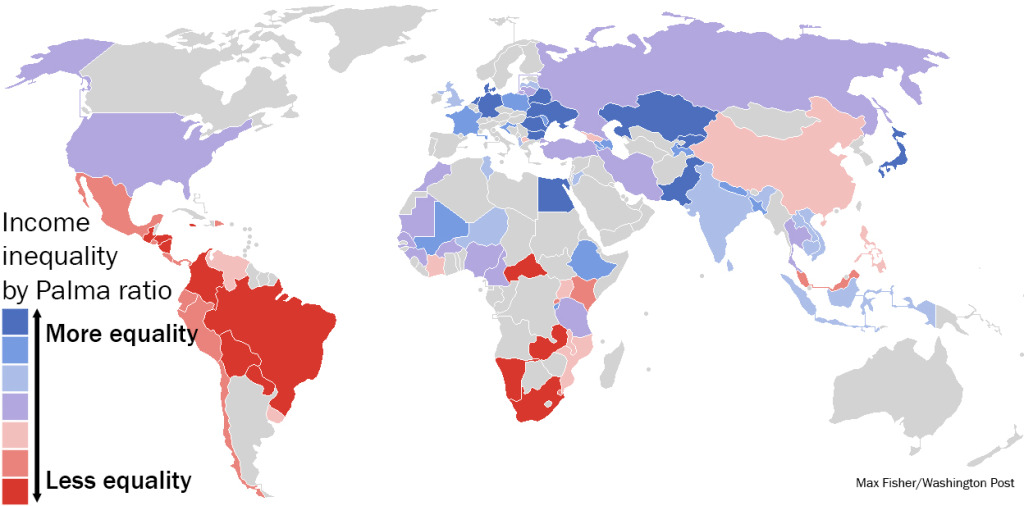
The figure above comes from the Washington Post‘s coverage of the Palma launch in 2013. That same year, The Broker hosted a series of pieces debating the Palma, including contributions from Stephan Klasen and Martin Ravallion, Ricardo Fuentes-Nieva, Amanda Lenhardt and Andrew Shepherd, Lars Engberg-Pedersen and our response. Four years later, The Guardian wrote:
The Palma ratio is an alternative to the Gini index, and focuses on the differences between those in the top and bottom income brackets. The ratio takes the richest 10% of the population’s share of gross national income (GNI) and divides it by the poorest 40% of the population’s share. This measure has become popular as more income inequality research focuses on the growing divide between the richest and poorest in society.
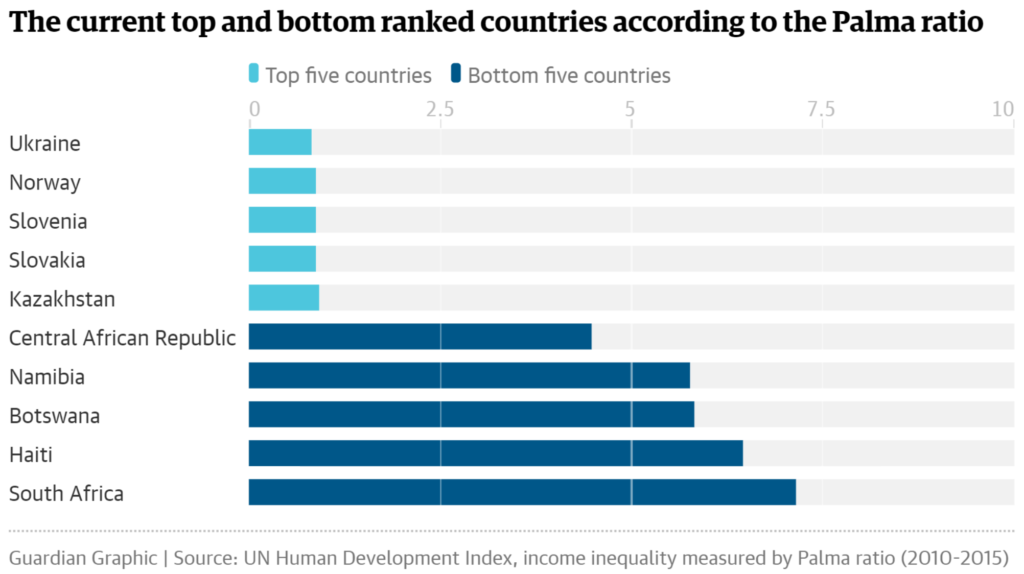
According to the Palma ratio figures in the UN Human Development Index, Ukraine, Norway and Slovenia were the most equal countries to live in when considering distribution of income between the richest and poorest in society. South Africa, Haiti and Botswana had the starkest inequalities in income, based on the Palma ratio.
5 Replies to “The Palma”