From the Tax Justice Research Bulletin 1(5).
Research using tax haven lists is inevitably compromised, showing at best a partial view. It is unfortunate, to say the least, that most economic analysis of tax-havenry has simply taken as read the politically-distorted identification.
The TJRB won’t plug TJN’s own research very often. But the Financial Secrecy Index is one of the bigger research contributions the network has made. It adds the possibility of rigorous definition, to the inevitable vagueness of debates on ‘tax havens’ (on which see e.g. my chapter in the World Bank volume); as well as helping to shift views (and policy) away from seeing corruption as a poor country problem. The origin of the index lies in these two points.
The leading journal Economic Geography has now published our paper, which we hope will accelerate the ongoing process of its adoption into academic research. Here’s the abstract:
Both academic research and public policy debate around tax havens and offshore finance typically suffer from a lack of definitional consistency. Unsurprisingly then, there is little agreement about which jurisdictions ought to be considered as tax havens—or which policy measures would result in their not being so considered. In this article we explore and make operational an alternative concept, that of a ‘secrecy jurisdiction’, and present the findings of the resulting Financial Secrecy Index (FSI). The FSI ranks countries and jurisdictions according to their contribution to opacity in global financial flows, revealing a quite different geography of financial secrecy from the image of small island tax havens that may still dominate popular perceptions and some of the literature on offshore finance. Some major (secrecy-supplying) economies now come into focus. Instead of a binary division between tax havens and others, the results show a secrecy spectrum, on which all jurisdictions can be situated, and that adjustment for the scale of business is necessary in order to compare impact propensity. This approach has the potential to support more precise and granular research findings and policy recommendations.
The ungated version is published as a CGD working paper. We explain in some detail the definitional debates around the terms ‘tax haven’ and ‘offshore financial centre’, and the unresolved issues in each case that make them unsuitable for categories in research. In the case of tax havens, the impossibility of definition was most famously noted in a 1981 report to the US Treasury – and yet it remains the most common term in research as well as media reporting. In policy, this has led to the use of subjective lists of jurisdictions, from e.g. the OECD or IMF.
Such lists reflect the politics of the creating institutions, and of the moment of creation, as well as the purpose. For example, a list created specifically to sanction ‘non-cooperative’ havens will be subject to much more political pressure, exacerbating the problem of small, politically weak jurisdictions being over-represented. It is highly unfortunate, in terms of generating robust research findings, that economists in particular have tended to rely on such lists for their analysis of the effects of tax havens.
A similar dynamic affects the lists of offshore financial centres (OFCs); since everywhere (else) is arguably offshore, it turns out that offshoreness lies in the eye of the beholder. Few deny the UK’s role in creating leading offshore financial markets; but few institutions have been willing to put the UK on their lists of OFCs. And once again, the absence of objectively verifiable criteria lead to a tendency to over-represent small jurisdictions, and to woolly research findings at best.
The alternative we propose is to focus on financial secrecy instead, defining ‘secrecy jurisdictions’ using objectively verifiable criteria (around e.g. banking secrecy, international tax cooperation, and corporate transparency), and combining this with a scale weighting based on each jurisdiction’s share of global financial service exports.
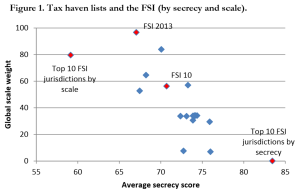 Figure 1 compares some FSI findings with the most commonly used lists (the blue diamonds). Two points can be seen clearly: first, most lists capture less than half of the global market (only one captures more of the market than the ten biggest jurisdictions); and second, most lists are a little more secretive than the FSI in general, or the top ten FSI jurisdictions (albeit not nearly as secretive as the ten most FSI secretive jurisdictions, which together account for c.0% of the global market).
Scale matters; and so does objective analysis of secrecy. As the FSI is increasingly used in policy and research analysis, including political risk ratings and other indices, we hope to see the emergence of a much more rigorous evidence base on the effects and determinants of ‘haven’ activity.
One last thing: with the launch of the 2015 FSI in November, we’ll be getting into a serious process of evaluation, which we expect to lead to some non-trivial changes in the construction of the index. If you’d like to weigh in on this, just drop me a line. (Or we may come and find you with a survey or interview request anyway…)

 This issue looks at a fascinating thesis on the different people and organisations that influence the OECD revision of corporate tax rules; and a new analysis from the IMF on the scale of corporate profit-shifting, with particular attention to developing countries’ revenue losses. The Spotlight falls on the Financial Secrecy Index, which has just been published in Economic Geography.
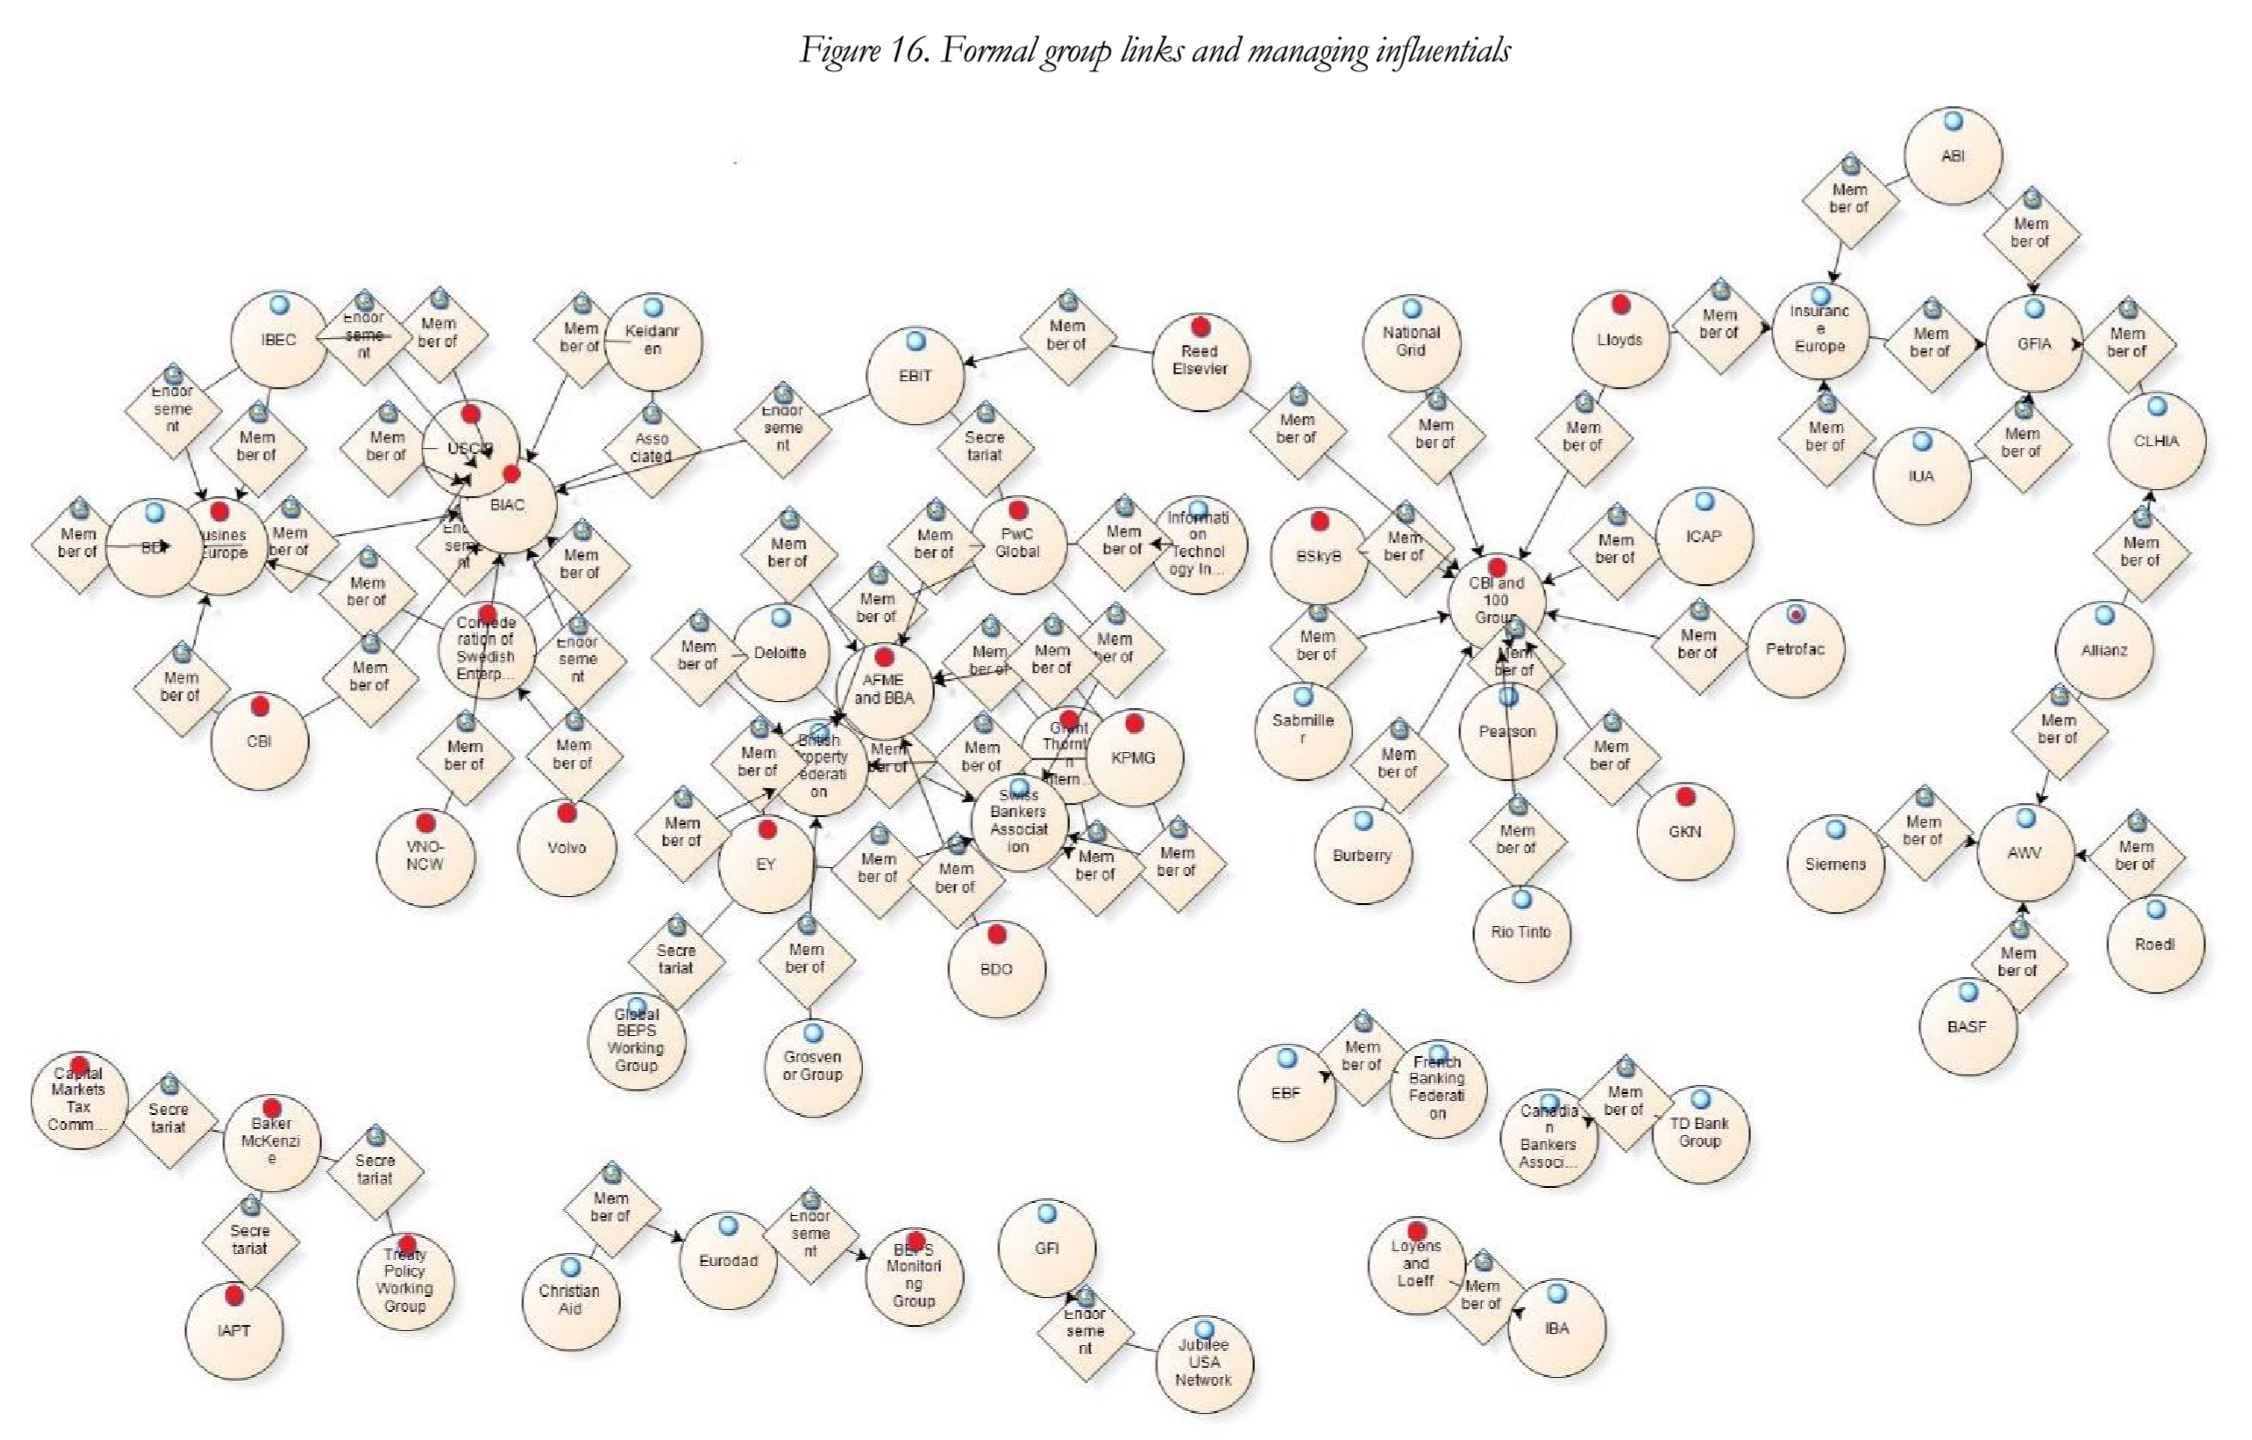
 The analysis goes to a much more detailed level, tracing the paths of leading individuals in the process, identifying ‘professional competition’ as a key factor, where “influence in highly technical policy discussions is contingent upon expertise (being able to speak authoritatively) and networks (being listened to)… I distinguish two types of influential professional: career diverse professionals (“octopuses”) and well-connected specialists (“arrows”). The former are influential because of their varied expertise, the latter because they are respected through key tax/transfer pricing networks.” In figure 16 (click to expand, as ever), the red dots indicate organisations with a ‘managing professional’ who is influential in the process.
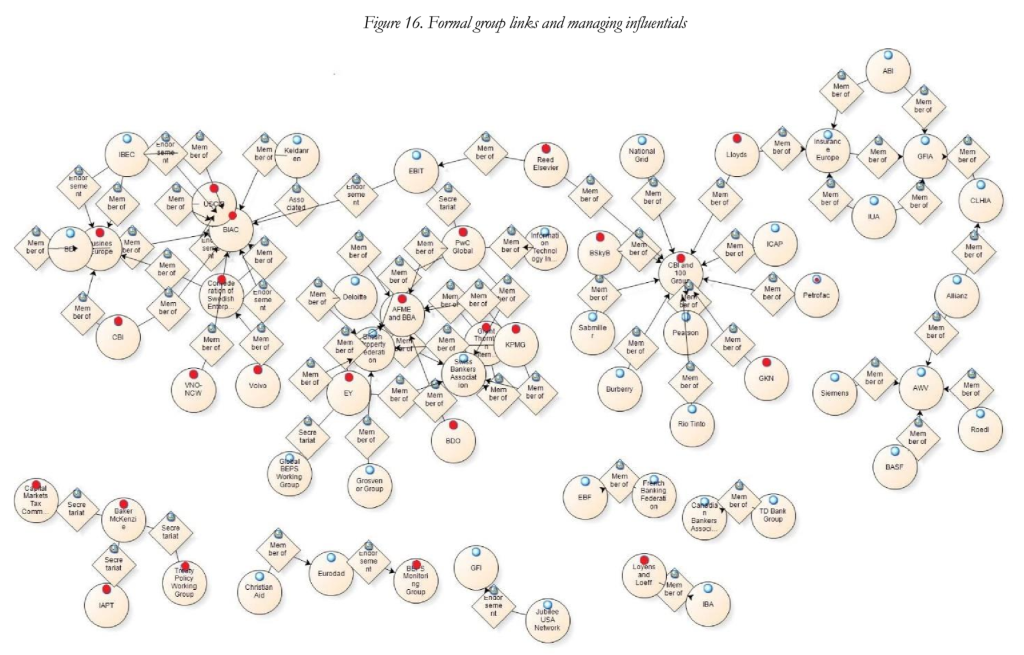 The full thesis contains a great deal more, including on the career paths of influentials. These are just some of the broad conclusions:
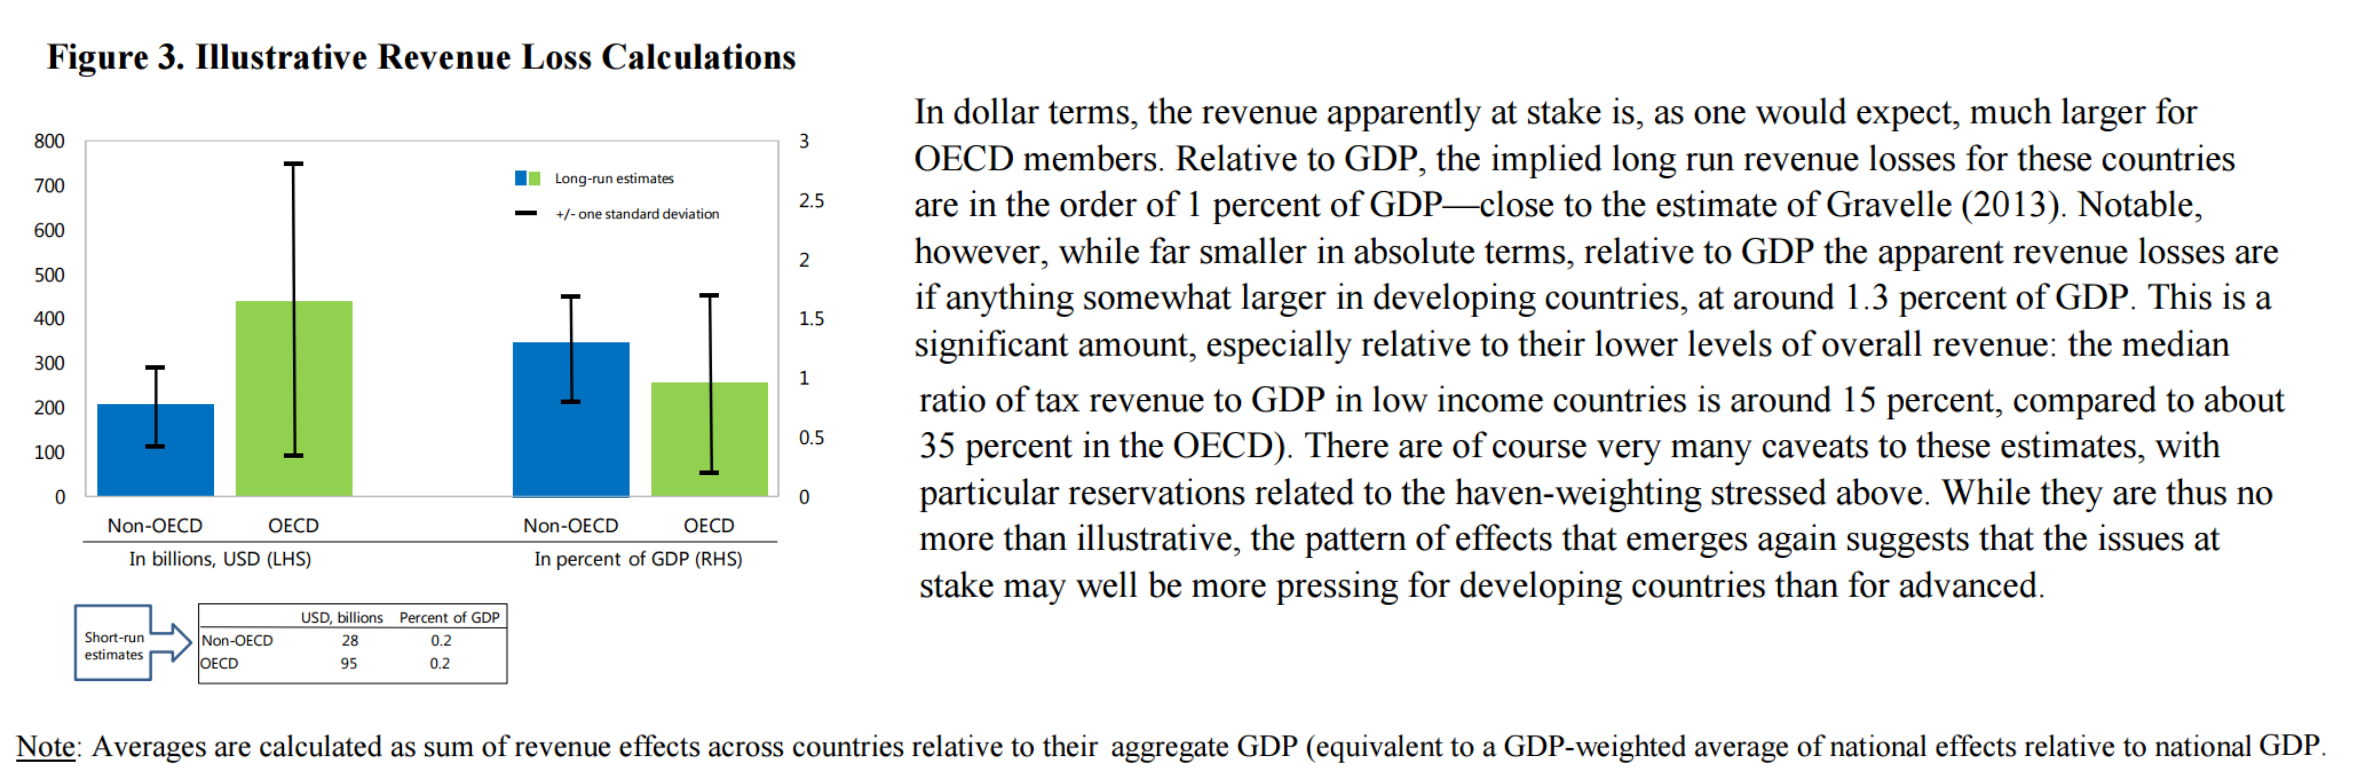
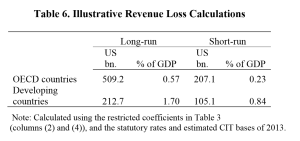 In line, as the authors note, with Gravelle’s (2013) study of US losses, they find a long-run revenue loss for OECD countries of toward 0.6% of GDP (some $500 billion). For developing countries however, the losses are nearly three times as high in GDP terms, exceeding $200 billion. This doesn’t immediately seem inconsistent with the