Offshore ownership in the UK

Transparency International has a new report out on the extent of secretive offshore ownership of London and UK property – and the consistent appearance of more secretive jurisdictions in investigations of corrupt ownership. Back of the envelope calculations suggest the tax implications could be substantial too… This may not make sense to some, as to start a company legally has more than just one advantage to forming a company in the UK and complying with the many regulatory boards that govern different Public and Private Limited Companies.

A few top lines:

  • The scale of offshore ownership is large, covering 40,725 London properties. (Or per the Financial Times last year, at least £122 billion across England & Wales; for Scotland, check Andy Wightman’s blog and book.)
  • Secrecy is a common feature. 89% of these properties (36,342) are held through TIUK 2015 POCU incorp locsecrecy jurisdictions, with more than a third due to the highly secretive British Virgin Islands alone.
  • Secrecy jurisdiction structures account for 5-10% of properties in the richest parts of the city including Westminster and Kensington & Chelsea: see map.
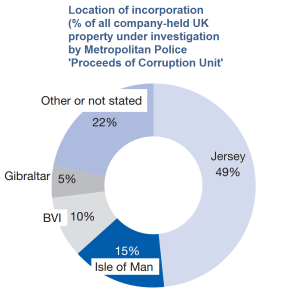
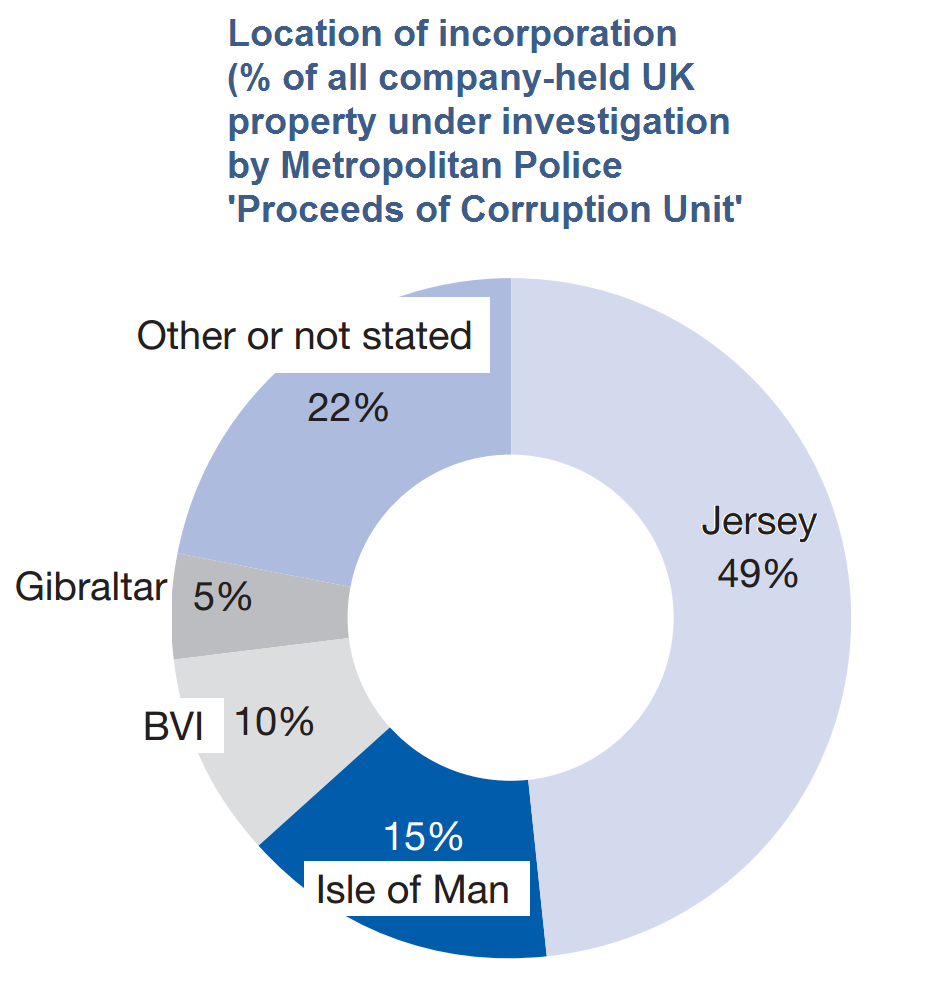
  • To the surprise of nobody, secrecy jurisdictions dominate the ownership of property in the Metropolitan Police’s investigations of corruption too.

The report is well worth a look, and details a lot more of the ways in which secrecy jurisdictions are used to make ownership anonymous, and how that facilitates all sorts of corruption.

Just for fun, I took a couple of the stats and checked to see what the potential capital gains tax (CGT) implications might be – because of course if a property is owned through an anonymous company, you can sell the company rather than the property and potentially skip the tax.

A lot of offshore ownership will be entirely unsullied by any intention to launder the proceeds of crime, or to dodge tax. But to get a sense of scale, it’s still informative to think in terms of the potential CGT at risk.

Example 1: the report notes that in 2011 alone, BVI companies bought £3.8 billion of UK property. Assume that property rose in value according to the government’s average house price index (although we know this is mainly high-end property, so this is likely to be conservative), then the rise in value by 2015 would be around 11.8%. Applying CGT at 28% would yield around £125 million of revenues – from the offshore ownership via one jurisdiction and in one year alone.

Example 2: taking the same approach to the FT’s figure of £122 billion owned offshore in England & Wales last year, we have an average rise in value of around 1.9%, with a potential CGT yield for the year of nearly £2.3 billion.

Of course, in neither case do we expect all CGT to have been unpaid; and the liability would only arise were the property sold. Still – the potential scale suggests TI’s final recommendation might well pay for itself, or indeed do rather better:

The Land Registry should publish the ultimate beneficial ownership of these properties freely to the public, on the same basis as Companies House is set to do under current UK legislation. Accordingly, companies registered overseas would be required to update beneficial ownership information on the same basis as UK registered companies.

And so say all of us.

Tax Justice Research Bulletin 1(2)

February 2015. The (marginally late) Tax Justice Research Bulletin is out, the second in TJN’s monthly series dedicated to tracking the latest developments in policy-relevant research on national and international taxation.

greek under-reporting 2012 fig1This issue looks at new papers modelling LuxLeaks (the impact of small states competing for foreign direct investment through deliberately lax transfer pricing approaches); and on the inequality impact of the financial sector. The Spotlight looks at a range of approaches to measuring and estimating the extent of tax non-compliance – are the wealthy more likely to evade tax?

Backing track from Fela Kuti, with thanks to Joe Stead – over at TJN.

Modelling #LuxLeaks

Republished from the Tax Justice Research Bulletin – find it all at TJN, with added Afrobeat.

The industrial economics literature on FDI has tended to separate two elements: where multinational enterprises (MNEs) decide to locate, and where profit is subsequently declared. On the location question, the 1999 model of Haufler & Wootton has been influential. This shows that ‘competition’ between states to attract FDI, using tax breaks and subsidies, is likely to result in most or all of the benefits of the investment being captured by the MNE; but the market size advantage of a larger state ‘may even’ allow it to charge a positive tax rate and still attract the investment.

Ma Raimondo 2015 fig1A new paper by Ma & Raimondos-Moller challenges this finding, by including the potential for profit-shifting as a factor in the location decision. Unsurprisingly, perhaps, this changes the set of possible equilibria in favour of a smaller state which is willing and able to apply transfer pricing rules more leniently – that is, to make it easier to shift in profits arising from economic activity located elsewhere.

Ma Raimondo 2015 fig2Figures 1 and 2 show the position facing the MNE, in terms of the tax rates in the small country (t_A) and in the large country (t_B). The dotted black 45° line shows where these are equal. The blue line represents the iso-profit curve in the Haufler & Wootton model. Because this is above the 45° line, the MNE is only indifferent between investing in country A or country B if the former has a lower tax rate – so the large country can have a positive tax rate and still be more attractive.

The new (red) isoprofit line in Figure 1 shows that allowing for profit-shifting reduces the large country’s advantage – the red line is closer to 45° line in the cases of interest (tax below 50%). But the striking finding is the shift of the red line in figure 2, once ‘competition’ on transfer pricing laxness is included. Now for most likely tax rates, the isoprofit line has flipped to lie below the 45° line – so that the MNE will be indifferent about location only when the large country offers a lower tax rate than the small country, because the small country’s profit-shifting advantages now outweigh the market size advantage of the large country.

Of course a model is only a model, and inevitably lacks complexity. In this case, there is obvious scope for improvement. It is assumed that the location decision is ‘real’, so that locating in the small country (say Luxembourg) will imply transport costs in order to service the large country market (say the UK); and it is also treated as an either/or decision. In practice the structure in Luxembourg is unlikely to have any contact with physical product, and the decision is likely to be both/and. (TJN’s work shows the extent of the divorce, most strongly in Luxembourg, between profits declared and real economic activity.)

Nonetheless, the paper is important. As Ma and Raimondos-Moller point out, it is the first time that profit-shifting has been incorporated in MNE location decision modelling. We can surely look forward to further developments on similar lines, including empirical testing.

Measuring evasion and non-compliance

Republished from the Tax Justice Research Bulletin – find it all at TJN, with added Afrobeat.

With the systematic tax abuses revealed by #SwissLeaks dominating world headlines, and provoking a threatened tax strike in the UK, tax non-compliance is a hot topic. In the various related strands of literature, four main approaches to estimates or direct measures of scale can be identified. Each deals with evidence from a different stage of economic activity.

IRS net misreporting fig

The most important evidence base is that of tax authorities’ own assessments of actual compliance. The US Internal Revenue Service is probably the field leader, with periodic publications providing percentage estimates of the compliance rate in various tax categories. Underlying any overall ‘tax gap’ estimate are the critical variables, the ‘net misreporting percentage’. Of particular value in the IRS approach is that compliance in relation to particular income streams is broken down according to the amount of information on the income provided to the IRS by third parties – revealing the powerful deterrent effect of transparency, even where the likelihood of investigation is small. (That the most recent published figures relate to 2006 appears to reflect the success of ongoing political efforts to ‘starve’ the IRS.)
greek under-reporting 2012 fig1A second source of evidence lies in third-party estimates, and in particular those of banks in states where evasion is seen as endemic. As the new Greek government committed to crack down on evasion, a 2012 paper came back into the news for its publication of banks’ assessments for lending purposes of their clients’ income under-reporting. The accompanying chart shows the apparent correlation with wealth of lambda, the multiplier necessary to get from reported income to true income. (Uncounted, innit? Greater hidden incomes at the top end.)

The third type of evidence stems from the limited international data on declaration of offshore income streams. This is the data that lies, for example, behind Gabriel Zucman’s estimates of undeclared global assets in excess of $7 trillion (see section on ‘The fraction of offshore money that evades taxes’).

Finally, there are macroeconomic analyses of the ‘informal’ or ‘shadow’ economy, in which the work of Friedrich Schneider has been particularly influential. Although there is a sense that measures based on e.g. use of electricity may highlight small-scale economic activity rather more than top-end evasion, the availability of consistent cross-country measures does offer an opportunity – see e.g. what World Bank authors kindly referred to as the ‘Cobham approach’, or Richard Murphy’s European analysis.

By the way – TJN curates some of the main ‘big numbers’ in this area here – and we’re always happy to hear of others we should include.

The financial sector and income inequality

Republished from the Tax Justice Research Bulletin – find it all at TJN, with added Afrobeat.

Since the financial crisis, rather more attention has been given to arguments about the potential inequality impact of the financial sector (it was a major part of this Columbia conference in December, for example). One argument is that bigger financial sectors give rise to lower inequality, because financial development, to quote a World Bank study,“disproportionately boosts incomes of the poorest”. Alternative views are more in tune with TJN authors’ proposal of a ‘finance curse’, through which a larger financial sector undermines democratic processes and more.

An interesting new paper from the Spanish bank BBVA takes a look at the main indicators, and finds – broadly – that the size of the financial sector is at best neutral for inequality; while it is a set of financial inclusion measures that are associated with lower income inequality. The proportion of adults with a bank account, and the ratio of SME loans to GDP, emerge as especially important.

bbvaWP 2015 - fin incl ineq
Source: www.sambla.fi

[NB. The figure summarises some simple results – namely, that inequality tends to be higher when financial inclusion is below average, and lower when credit/GDP is below average. More detailed analysis provides strong support for the first point in particular.]

Separately, Tony Atkinson and Salvatore Morelli provide the most comprehensive overview to date on the relationships between inequality and banking crises over a century or more. ‘More evidence needed’, and ‘no single story’ are major elements of their conclusions – but long-lasting human impacts are to be expected.